| Param | Original file | Final file |
|---|---|---|
| Filename | modeM0/AS1G08_071T02_9000001620_11132cztM0_level2.evt | modeM0/AS1G08_071T02_9000001620_11132cztM0_level2_quad_clean.evt |
| Size (bytes) | 542,062,080 | 63,936,000 |
| Size | 517.0 MB | 61.0 MB |
| Events in quadrant A | 4,515,776 | 368,741 |
| Events in quadrant B | 3,951,408 | 380,724 |
| Events in quadrant C | 3,090,467 | 378,208 |
| Events in quadrant D | 4,420,083 | 356,440 |
| Mode SS | |||
|---|---|---|---|
| Quadrant | BADHDUFLAG | Total packets | Discarded packets |
| A | 0 | 132 | 0 |
| B | 0 | 132 | 0 |
| C | 0 | 132 | 0 |
| D | 0 | 132 | 0 |
| Mode M9 | |||
|---|---|---|---|
| Quadrant | BADHDUFLAG | Total packets | Discarded packets |
| A | 0 | 18 | 0 |
| B | 0 | 18 | 0 |
| C | 0 | 18 | 0 |
| D | 0 | 19 | 0 |
| Mode M0 | |||
|---|---|---|---|
| Quadrant | BADHDUFLAG | Total packets | Discarded packets |
| A | 0 | 17546 | 3 |
| B | 0 | 15781 | 2 |
| C | 0 | 13378 | 2 |
| D | 0 | 17443 | 2 |
| Quadrant | Total seconds | Saturated seconds | Saturation percentage |
|---|---|---|---|
| A | 6469 | 357 | 5.518627% |
| B | 6469 | 210 | 3.246251% |
| C | 6469 | 47 | 0.726542% |
| D | 6469 | 285 | 4.405627% |
Noise dominated data is calculated using 1-second bins in cleaned event files. If a bin has >2000 counts, and if more than 50% of those come from <1% of pixels, then it is considered to be noise-dominated and hence unusable.
| Quadrant | # 1 sec bins | Bins with >0 counts | Bins with >2000 counts | High rate bins dominated by noise | Noise dominated (total time) | Noise dominated (detector-on time) | Marked lightcurve |
|---|---|---|---|---|---|---|---|
| A | 7629 | 6470 | 219 | 219 | 2.87% | 3.38% | 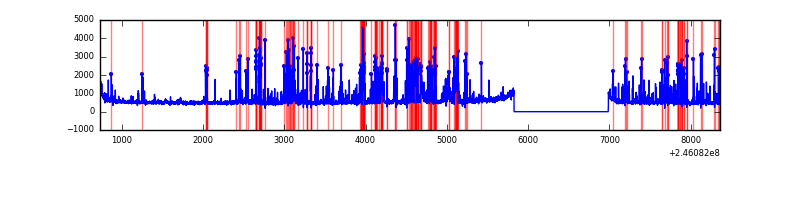 |
| B | 7629 | 6470 | 73 | 73 | 0.96% | 1.13% | 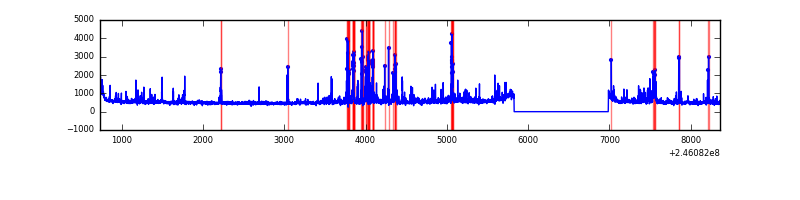 |
| C | 7629 | 6470 | 2 | 2 | 0.03% | 0.03% | 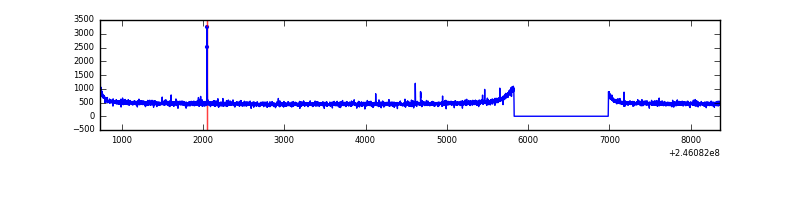 |
| D | 7629 | 6470 | 217 | 217 | 2.84% | 3.35% | 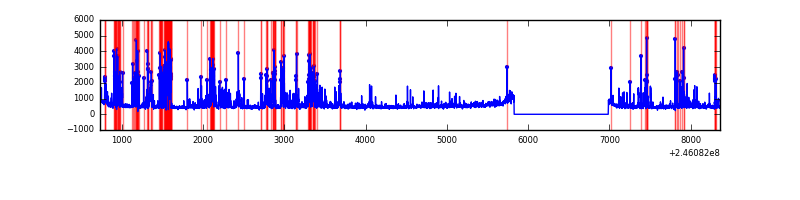 |
Top three noisy pixels from each quadrant. If the there are fewer than three noisy pixels in the level2.evt file, extra rows are filled as -1
| Pixel properties | Quadrant properties | ||||||
|---|---|---|---|---|---|---|---|
| Quadrant | DetID | PixID | Counts | Sigma | Mean | Median | Sigma |
| A | 8 | 5 | 1339378 | 8282.09 | 799 | 781 | 161.6 |
| A | 14 | 63 | 66484 | 406.51 | 799 | 781 | 161.6 |
| A | 8 | 15 | 26033 | 156.23 | 799 | 781 | 161.6 |
| B | 10 | 16 | 365764 | 2344.27 | 815 | 797 | 155.7 |
| B | 4 | 239 | 193917 | 1240.46 | 815 | 797 | 155.7 |
| B | 15 | 204 | 59967 | 380.06 | 815 | 797 | 155.7 |
| C | 9 | 54 | 11335 | 57.6 | 787 | 793 | 183.0 |
| C | 13 | 61 | 5950 | 28.18 | 787 | 793 | 183.0 |
| C | 14 | 234 | 5854 | 27.65 | 787 | 793 | 183.0 |
| D | 10 | 253 | 398721 | 2159.96 | 765 | 744 | 184.3 |
| D | 5 | 222 | 372561 | 2017.98 | 765 | 744 | 184.3 |
| D | 13 | 249 | 327422 | 1773.0 | 765 | 744 | 184.3 |
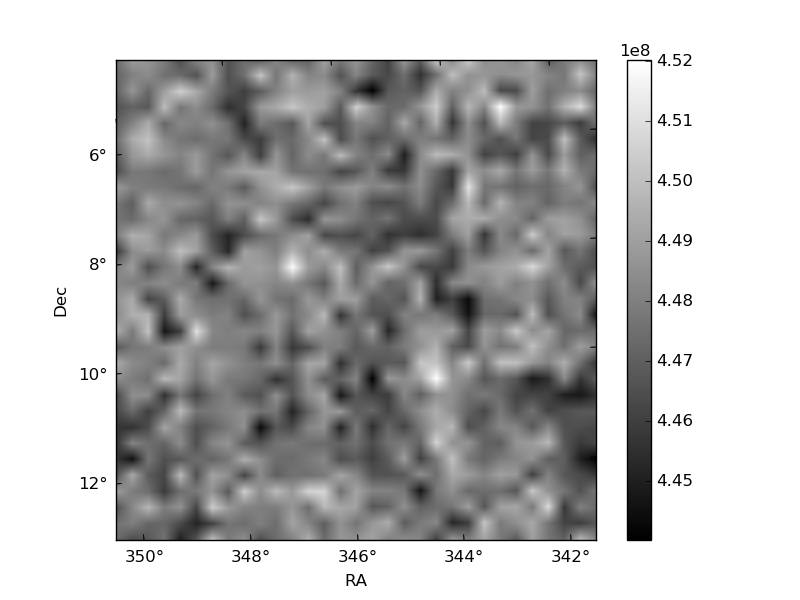
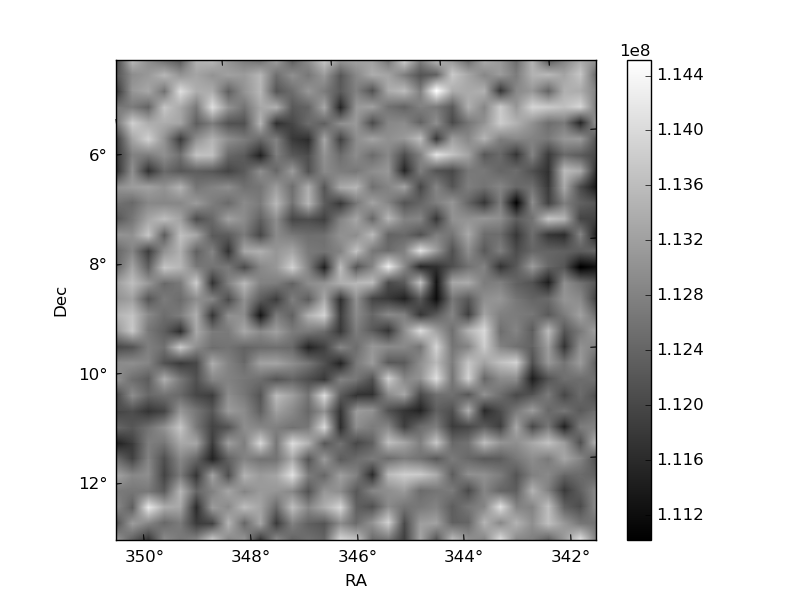
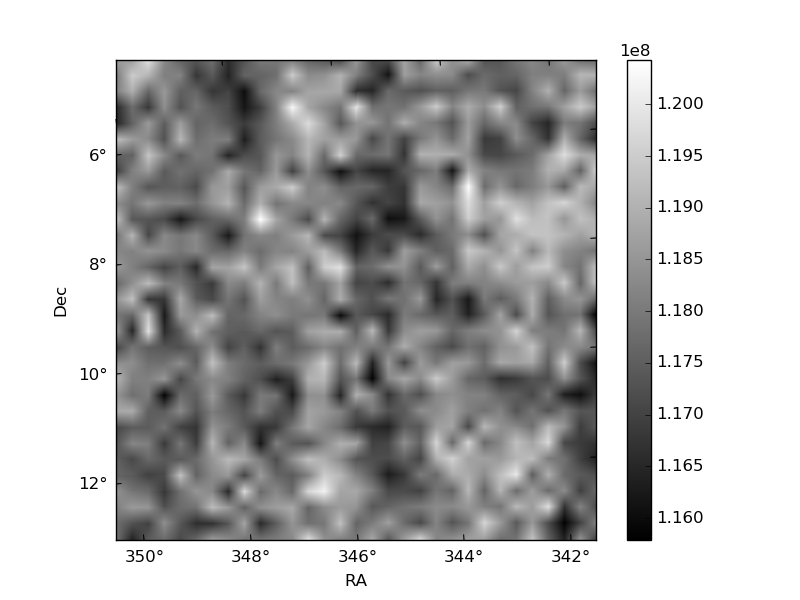
Histogram calculated using DETX and DETY for each event in the final _common_clean file
| Quadrant A | 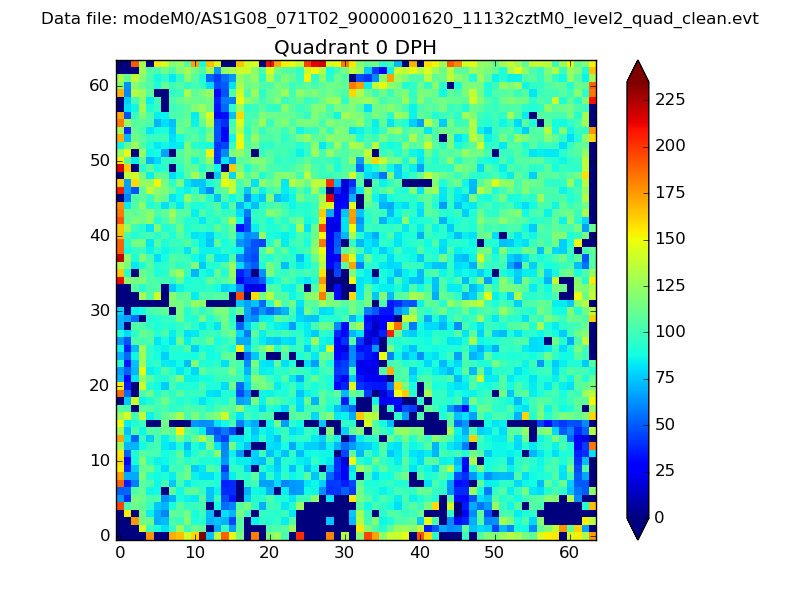 |
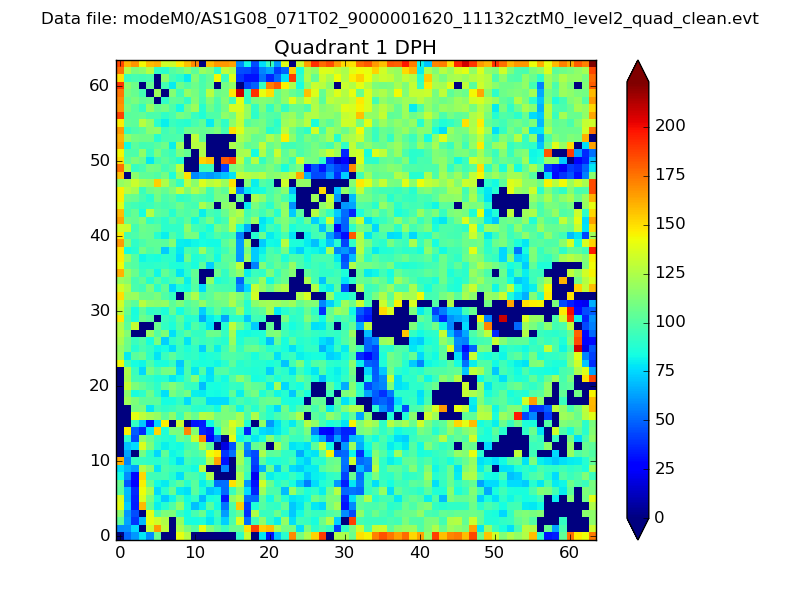 |
Quadrant B |
|---|---|---|---|
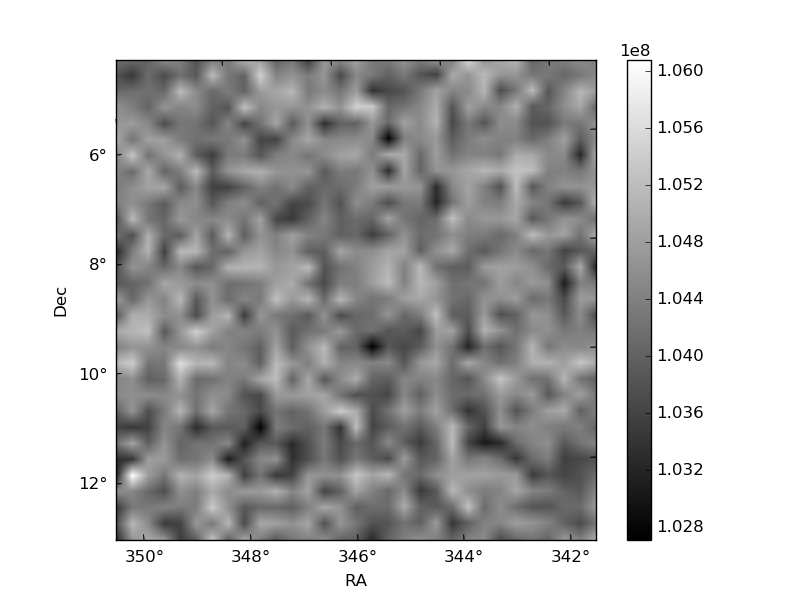
| Quadrant D | 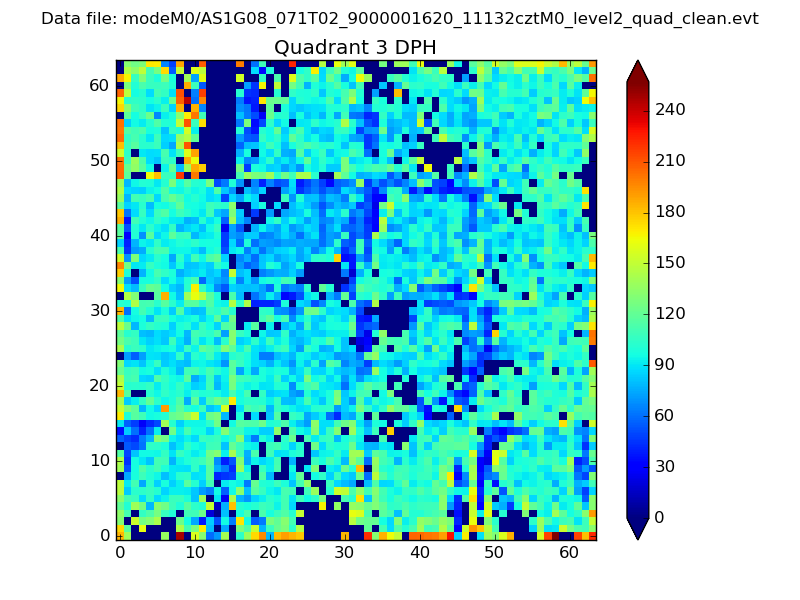 |
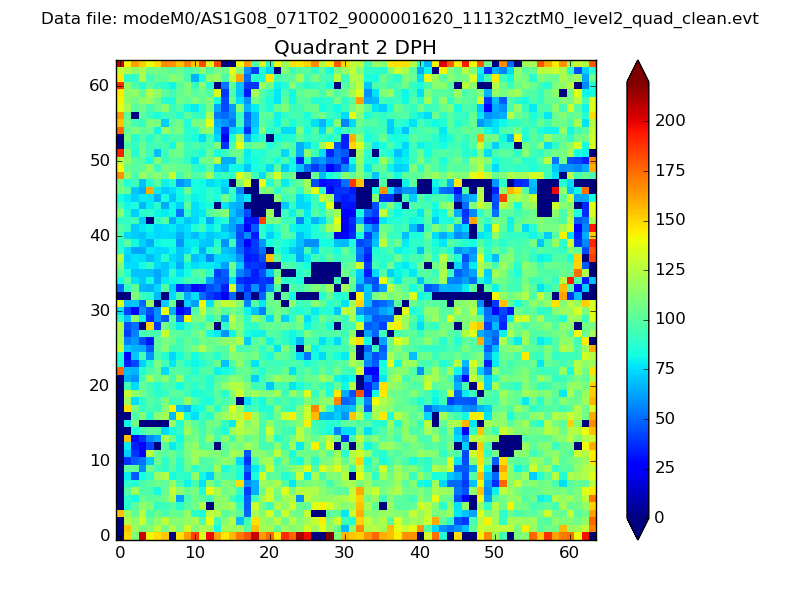 |
Quadrant C |
| Plot type | Count rate plots | Images |
|---|---|---|
| Comparison with Poisson distribution Blue bars denote a histogram of data divided into 1 sec bins. Red curve is a Poisson curve with rate = median count rate of data. |
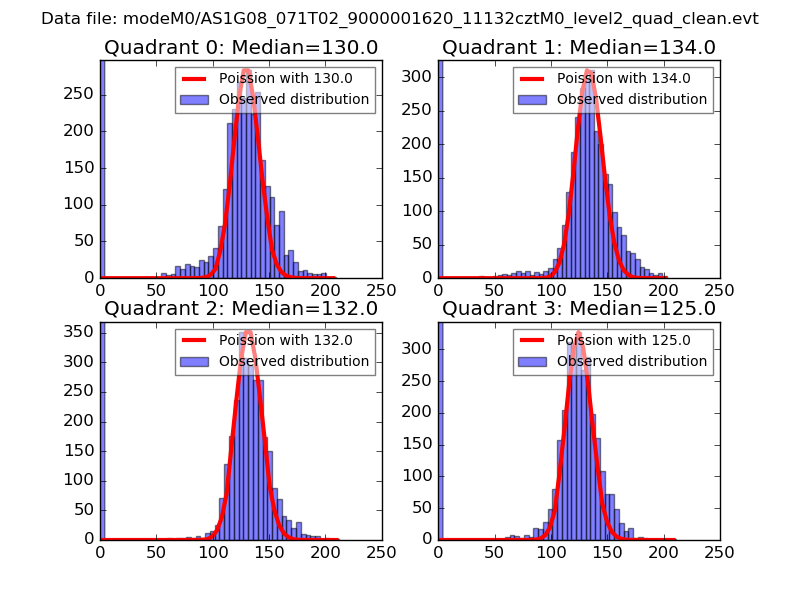 |
 |
| Quadrant-wise count rates Data is divided into 100 sec bins |
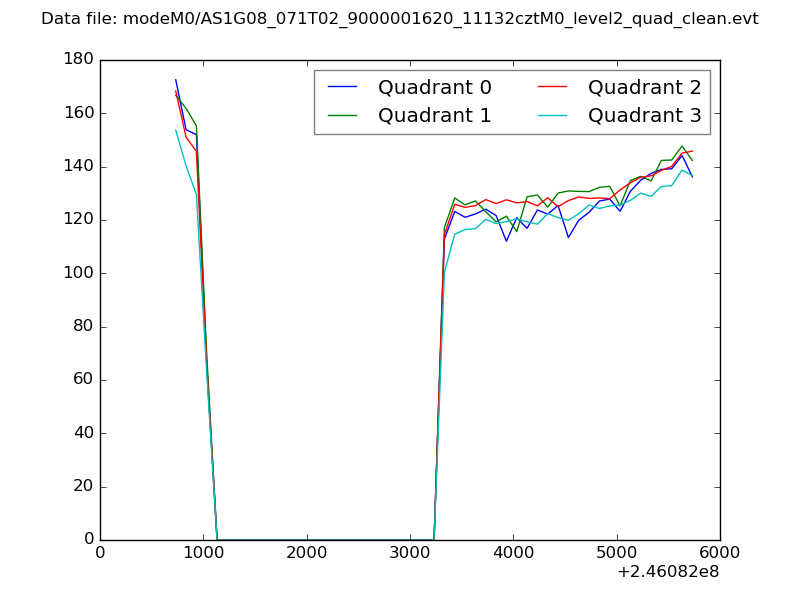 |
|
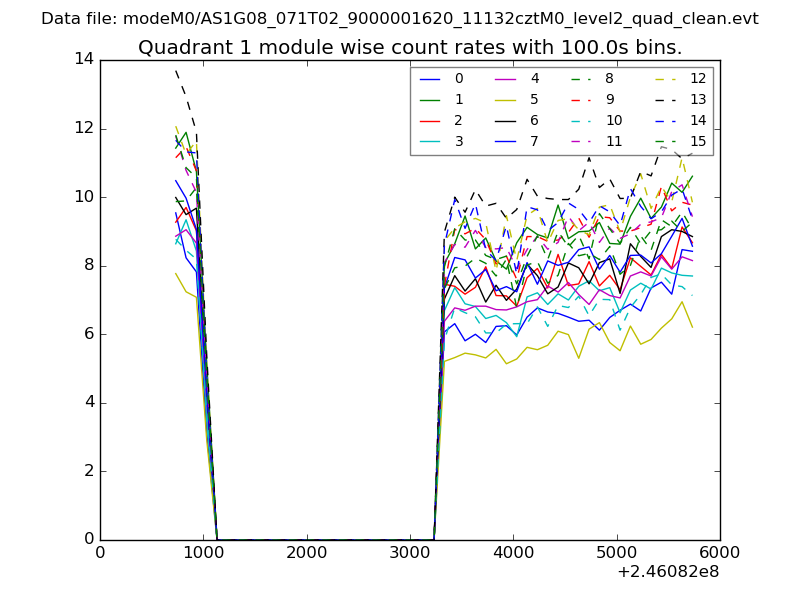
| Module-wise count rates for Quadrant A Data is divided into 100 sec bins |
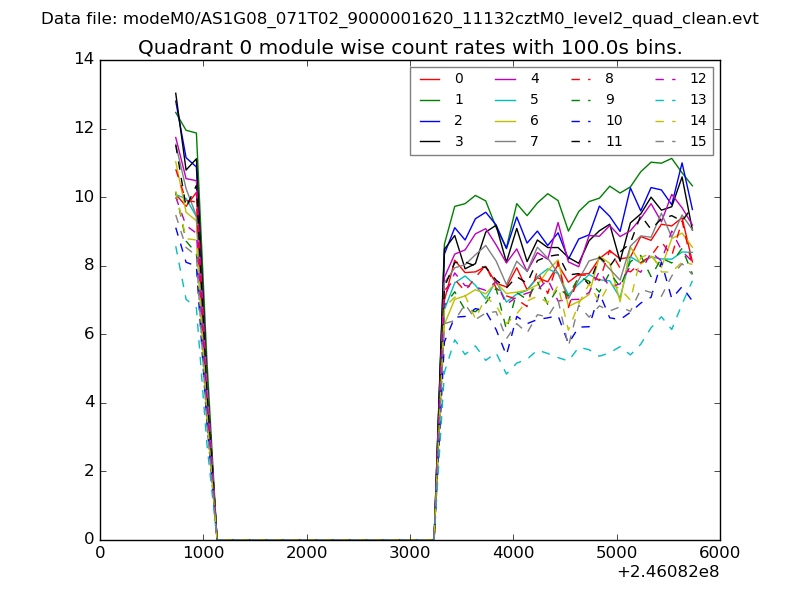 |
 |
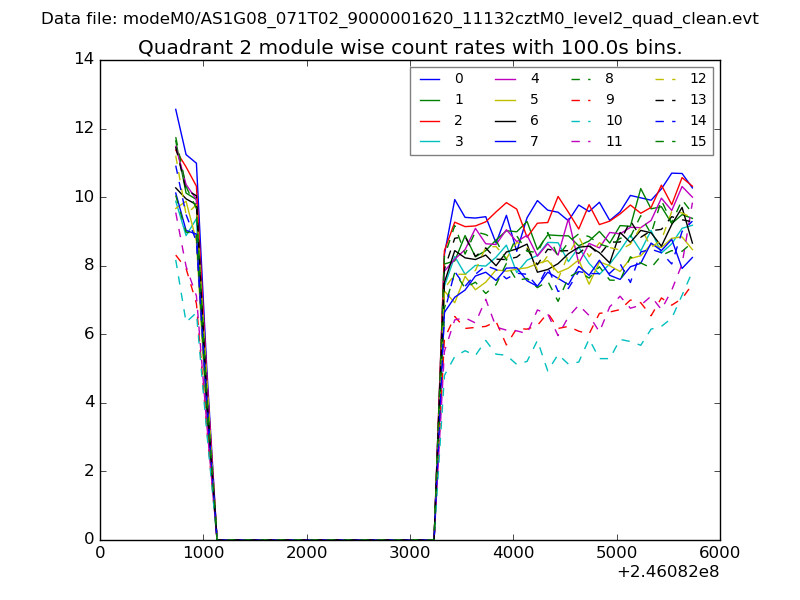
| Module-wise count rates for Quadrant B Data is divided into 100 sec bins |
 |
 |
| Module-wise count rates for Quadrant C Data is divided into 100 sec bins |
 |
 |
| Module-wise count rates for Quadrant D Data is divided into 100 sec bins |
 |
 |
| Parameter | Plot |
|---|---|
| CZT HV Monitor | 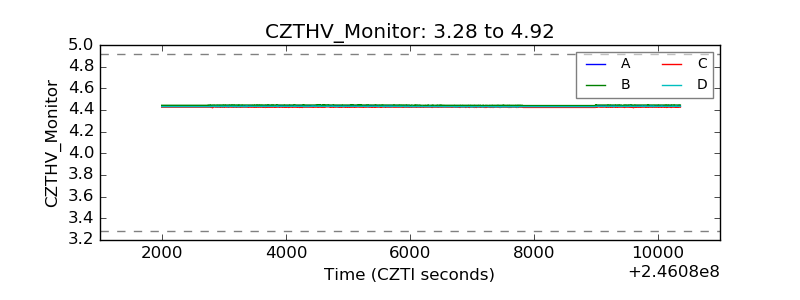 |
| D_VDD | 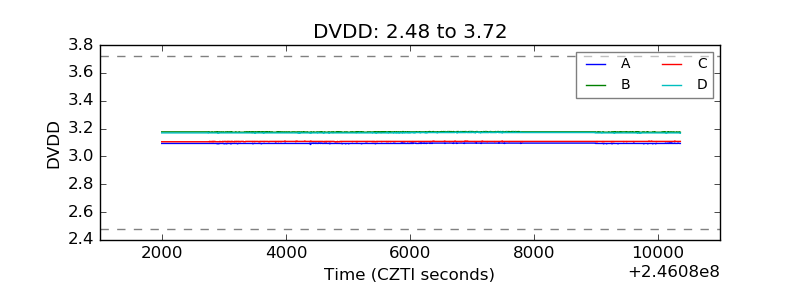 |
| Temperature 1 | 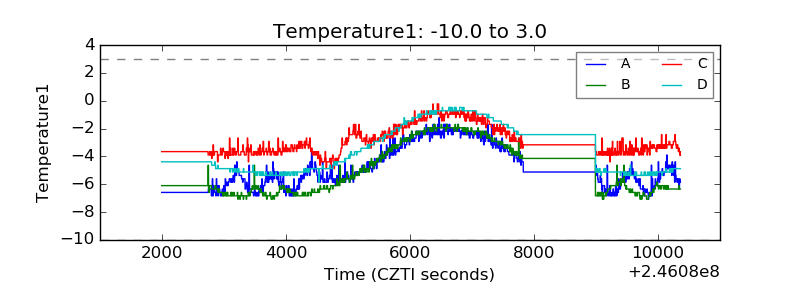 |
| Veto HV Monitor | 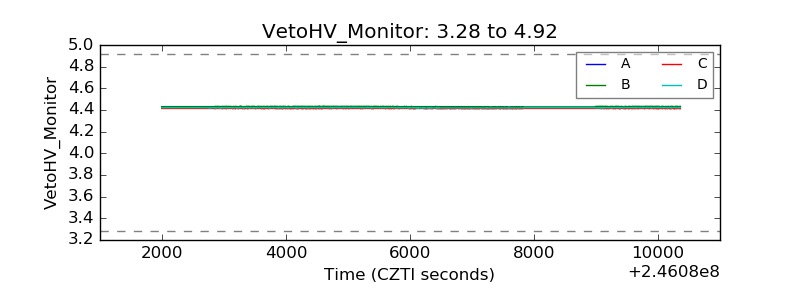 |
| Veto LLD | 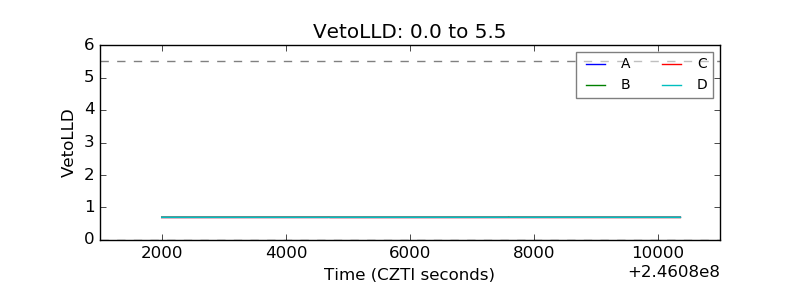 |
| Alpha Counter | 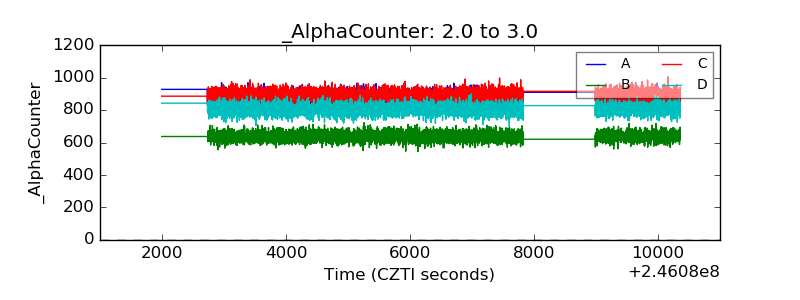 |
| _CPM_Rate | 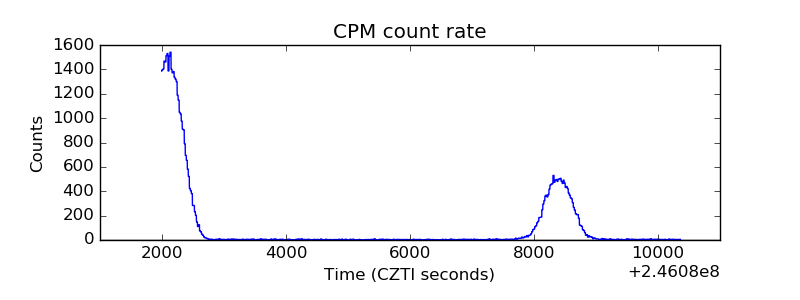 |
| CZT Counter | 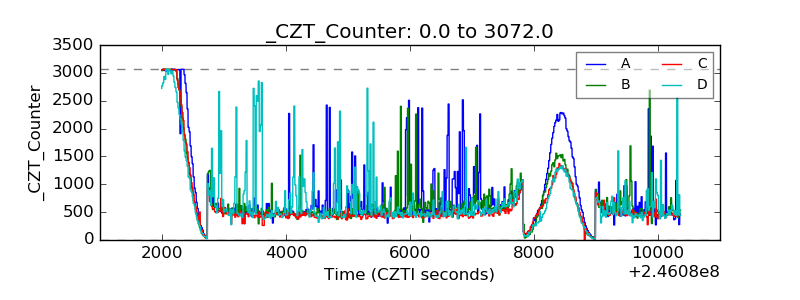 |
| +2.5 Volts monitor |  |
| +5 Volts monitor |  |
| _ROLL_ROT | 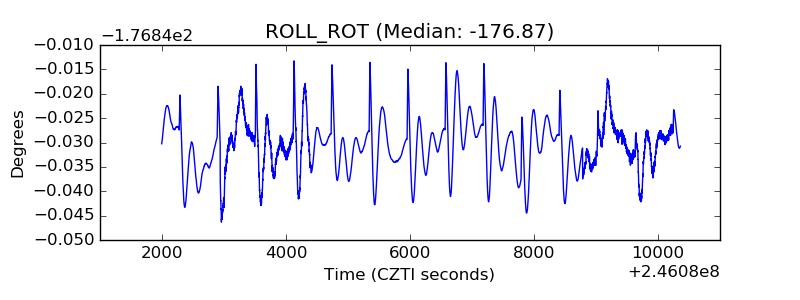 |
| _Roll_DEC | 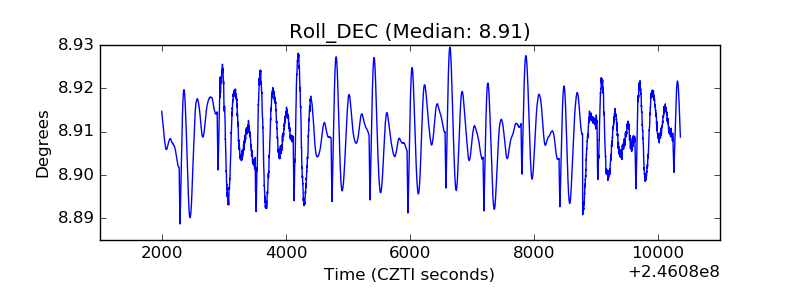 |
| _Roll_RA | 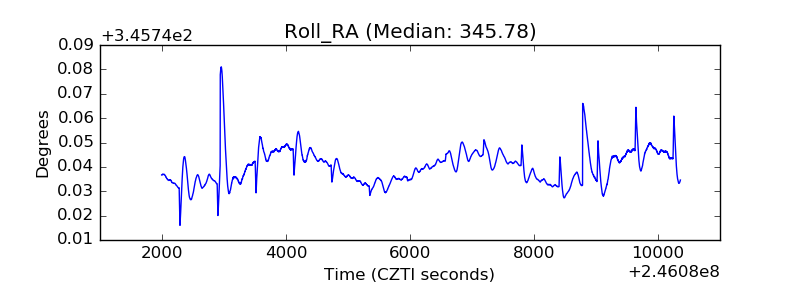 |
| Veto Counter | 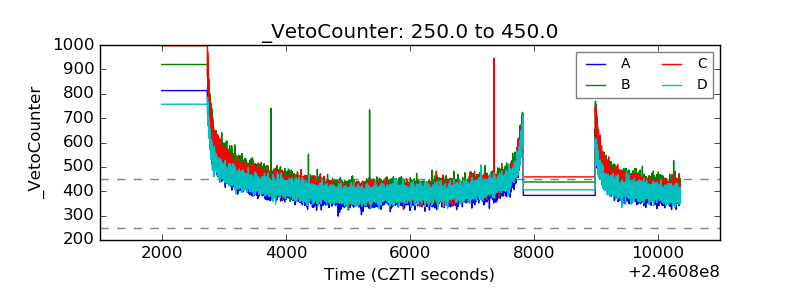 |