| Param | Original file | Final file |
|---|---|---|
| Filename | modeM0/AS1G08_071T02_9000001620_11135cztM0_level2.evt | modeM0/AS1G08_071T02_9000001620_11135cztM0_level2_quad_clean.evt |
| Size (bytes) | 759,438,720 | 80,608,320 |
| Size | 724.3 MB | 76.9 MB |
| Events in quadrant A | 6,823,021 | 469,207 |
| Events in quadrant B | 5,679,731 | 468,363 |
| Events in quadrant C | 3,951,821 | 484,060 |
| Events in quadrant D | 5,994,151 | 453,397 |
| Mode SS | |||
|---|---|---|---|
| Quadrant | BADHDUFLAG | Total packets | Discarded packets |
| A | 0 | 166 | 0 |
| B | 0 | 166 | 0 |
| C | 0 | 166 | 0 |
| D | 0 | 166 | 0 |
| Mode M9 | |||
|---|---|---|---|
| Quadrant | BADHDUFLAG | Total packets | Discarded packets |
| A | 0 | 4 | 0 |
| B | 0 | 4 | 0 |
| C | 0 | 4 | 0 |
| D | 0 | 4 | 0 |
| Mode M0 | |||
|---|---|---|---|
| Quadrant | BADHDUFLAG | Total packets | Discarded packets |
| A | 0 | 25585 | 2 |
| B | 0 | 22119 | 1 |
| C | 0 | 17306 | 1 |
| D | 0 | 23268 | 1 |
| Quadrant | Total seconds | Saturated seconds | Saturation percentage |
|---|---|---|---|
| A | 8139 | 1213 | 14.903551% |
| B | 8139 | 866 | 10.640128% |
| C | 8139 | 307 | 3.771962% |
| D | 8139 | 853 | 10.480403% |
Noise dominated data is calculated using 1-second bins in cleaned event files. If a bin has >2000 counts, and if more than 50% of those come from <1% of pixels, then it is considered to be noise-dominated and hence unusable.
| Quadrant | # 1 sec bins | Bins with >0 counts | Bins with >2000 counts | High rate bins dominated by noise | Noise dominated (total time) | Noise dominated (detector-on time) | Marked lightcurve |
|---|---|---|---|---|---|---|---|
| A | 8479 | 8141 | 573 | 573 | 6.76% | 7.04% | 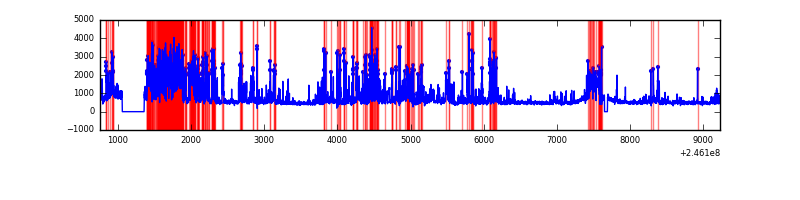 |
| B | 8479 | 8141 | 237 | 237 | 2.80% | 2.91% | 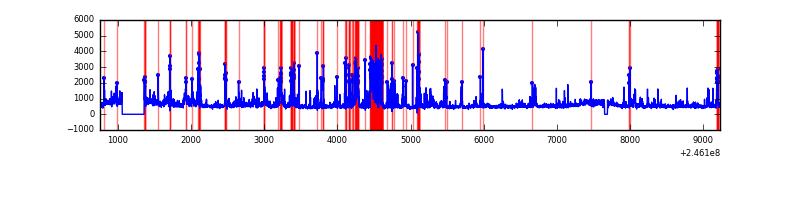 |
| C | 8479 | 8141 | 18 | 18 | 0.21% | 0.22% | 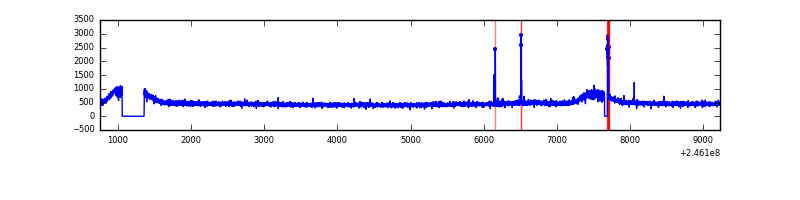 |
| D | 8479 | 8141 | 405 | 405 | 4.78% | 4.97% | 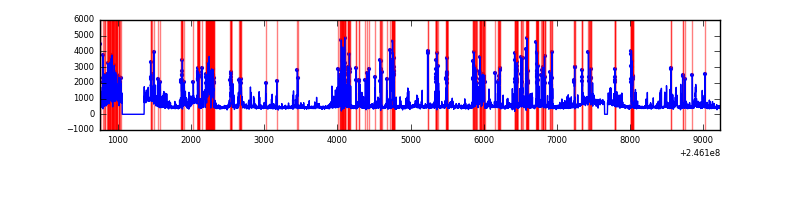 |
Top three noisy pixels from each quadrant. If the there are fewer than three noisy pixels in the level2.evt file, extra rows are filled as -1
| Pixel properties | Quadrant properties | ||||||
|---|---|---|---|---|---|---|---|
| Quadrant | DetID | PixID | Counts | Sigma | Mean | Median | Sigma |
| A | 8 | 5 | 2040039 | 10288.39 | 960 | 936 | 198.2 |
| A | 14 | 238 | 839357 | 4230.29 | 960 | 936 | 198.2 |
| A | 14 | 63 | 141678 | 710.12 | 960 | 936 | 198.2 |
| B | 10 | 16 | 1009527 | 5206.31 | 997 | 971 | 193.7 |
| B | 4 | 239 | 540544 | 2785.36 | 997 | 971 | 193.7 |
| B | 15 | 204 | 146733 | 752.44 | 997 | 971 | 193.7 |
| C | 9 | 54 | 38438 | 161.65 | 993 | 994 | 231.6 |
| C | 14 | 234 | 35837 | 150.42 | 993 | 994 | 231.6 |
| C | 13 | 61 | 7506 | 28.11 | 993 | 994 | 231.6 |
| D | 10 | 253 | 1290678 | 5531.92 | 958 | 929 | 233.1 |
| D | 1 | 52 | 525514 | 2250.02 | 958 | 929 | 233.1 |
| D | 13 | 152 | 142493 | 607.19 | 958 | 929 | 233.1 |
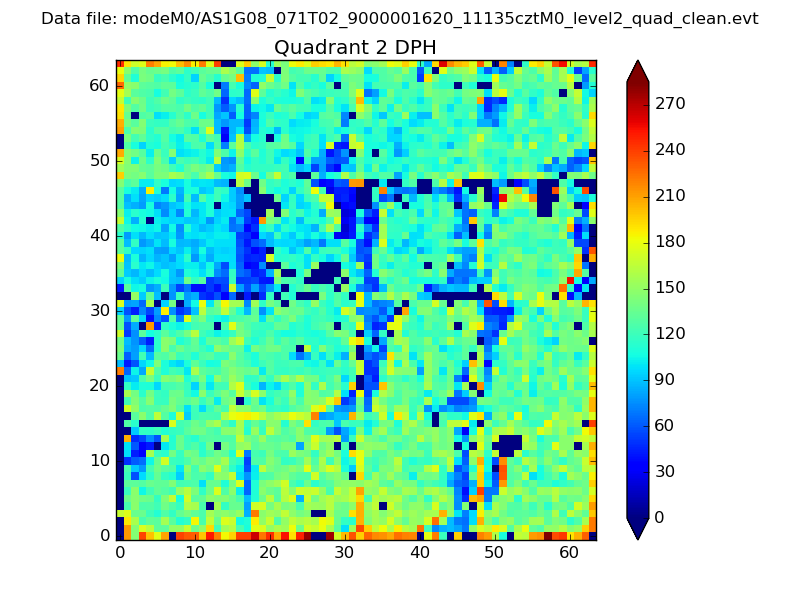
Histogram calculated using DETX and DETY for each event in the final _common_clean file
| Quadrant A | 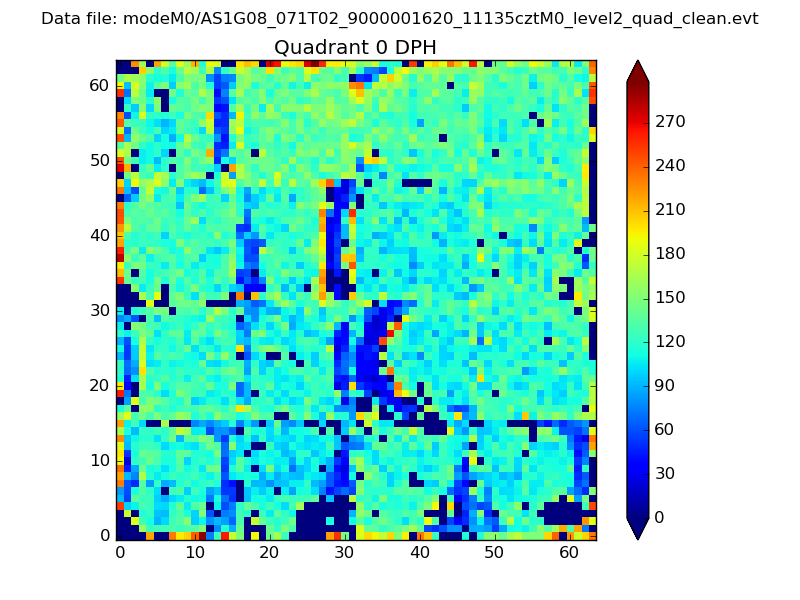 |
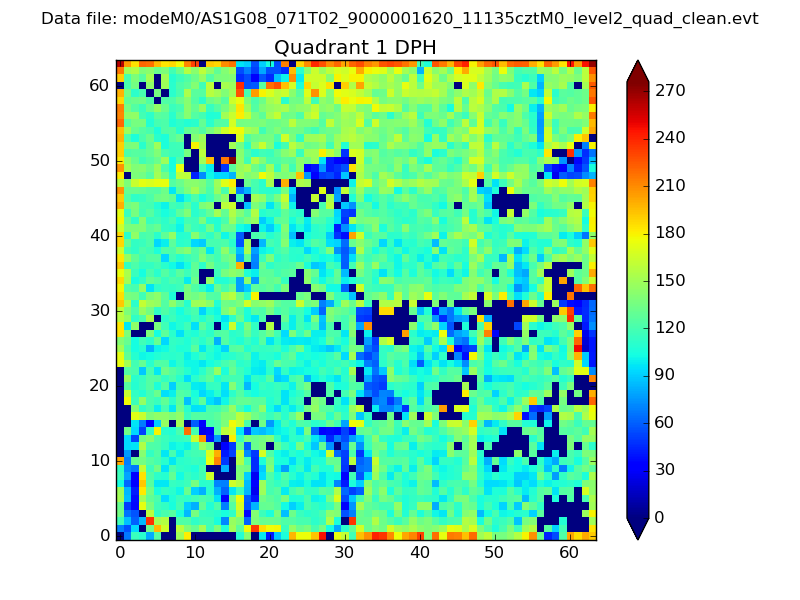 |
Quadrant B |
|---|---|---|---|
| Quadrant D | 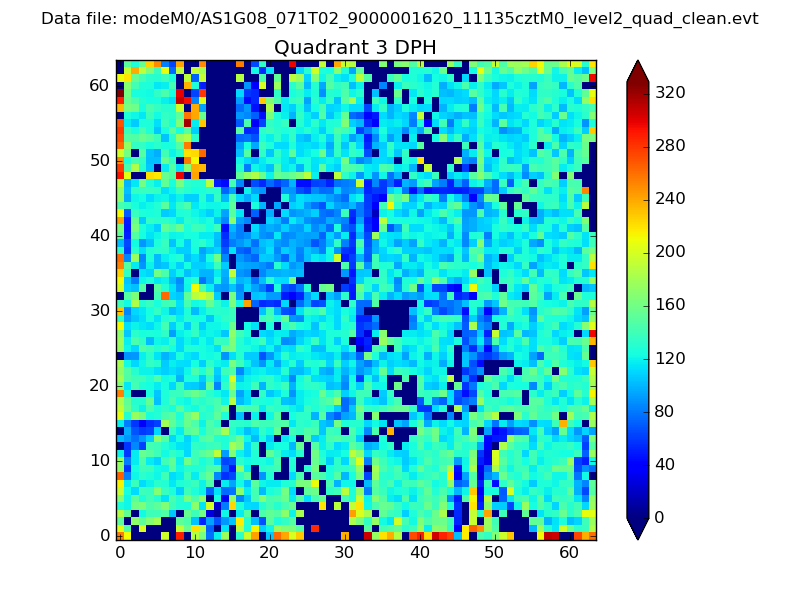 |
 |
Quadrant C |
| Plot type | Count rate plots | Images |
|---|---|---|
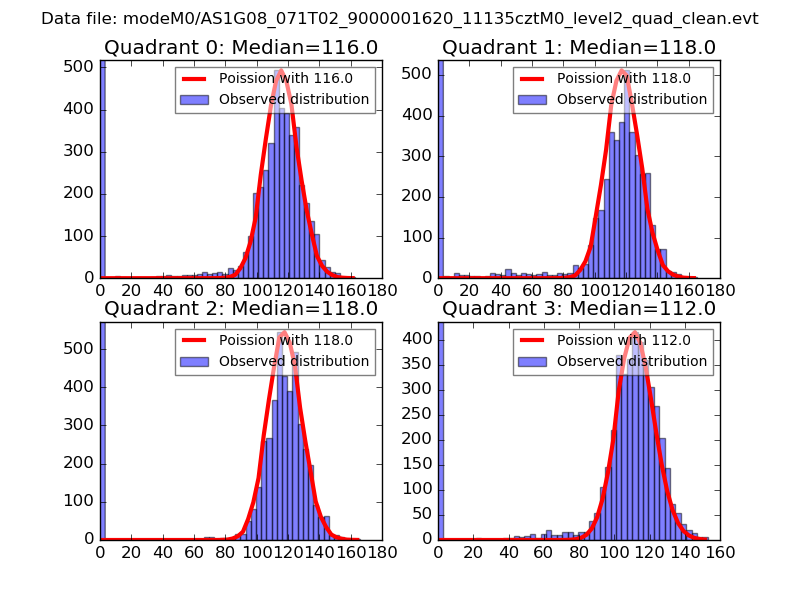
| Comparison with Poisson distribution Blue bars denote a histogram of data divided into 1 sec bins. Red curve is a Poisson curve with rate = median count rate of data. |
 |
 |
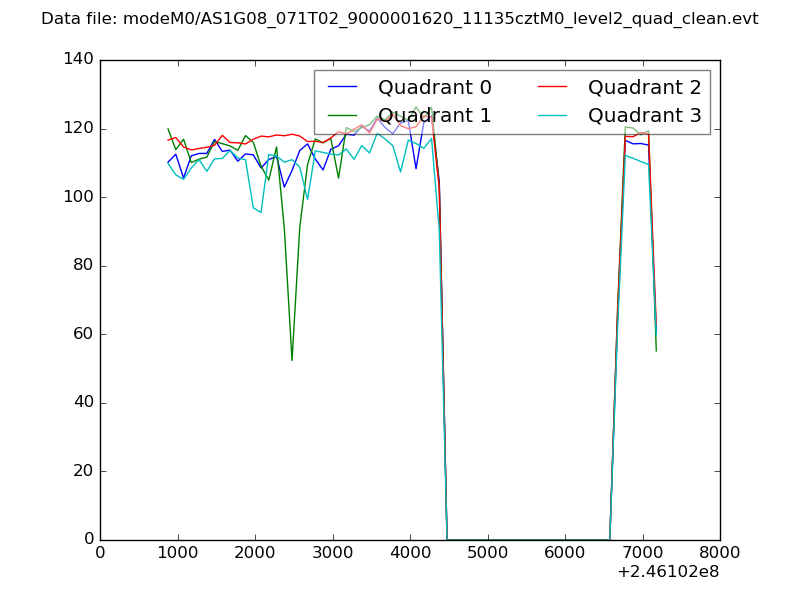
| Quadrant-wise count rates Data is divided into 100 sec bins |
 |
|
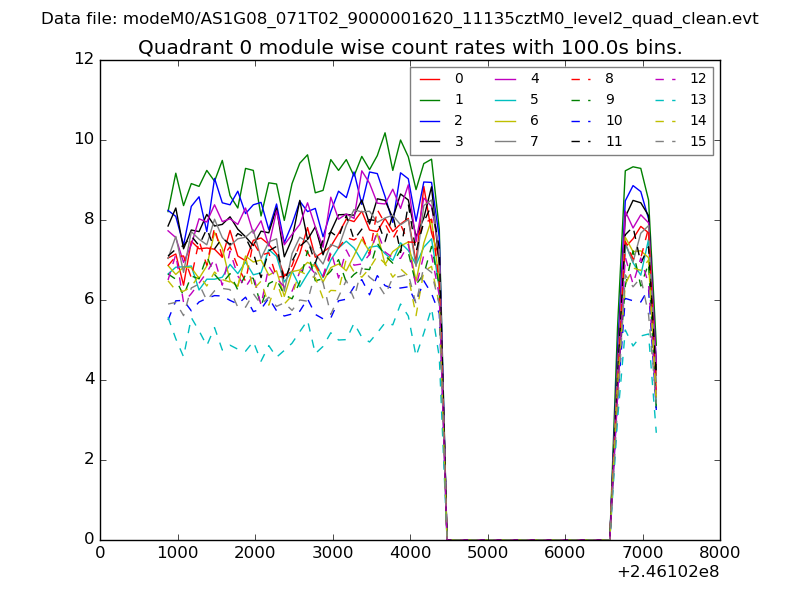
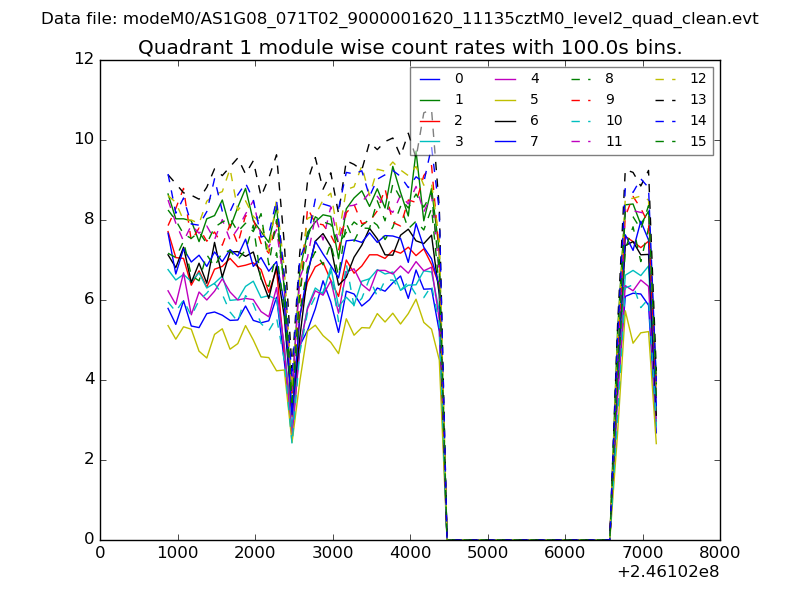
| Module-wise count rates for Quadrant A Data is divided into 100 sec bins |
 |
 |
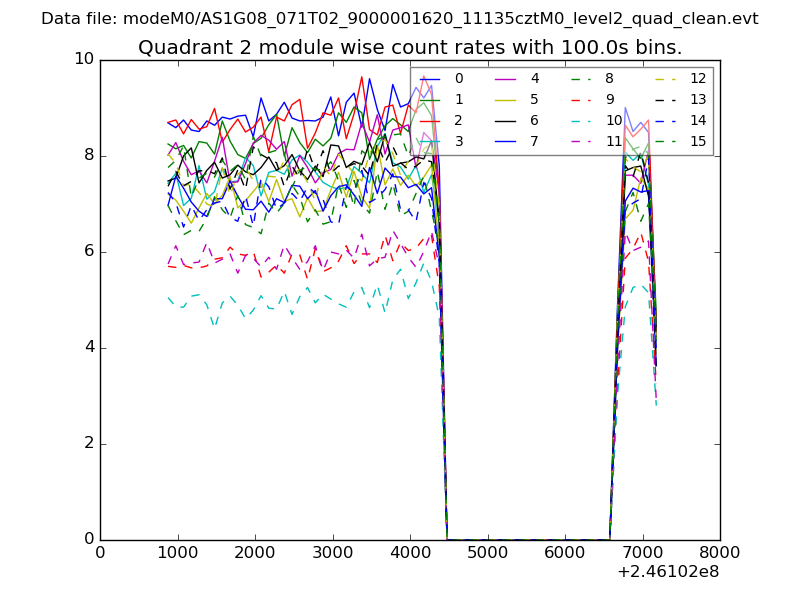
| Module-wise count rates for Quadrant B Data is divided into 100 sec bins |
 |
 |
| Module-wise count rates for Quadrant C Data is divided into 100 sec bins |
 |
 |
| Module-wise count rates for Quadrant D Data is divided into 100 sec bins |
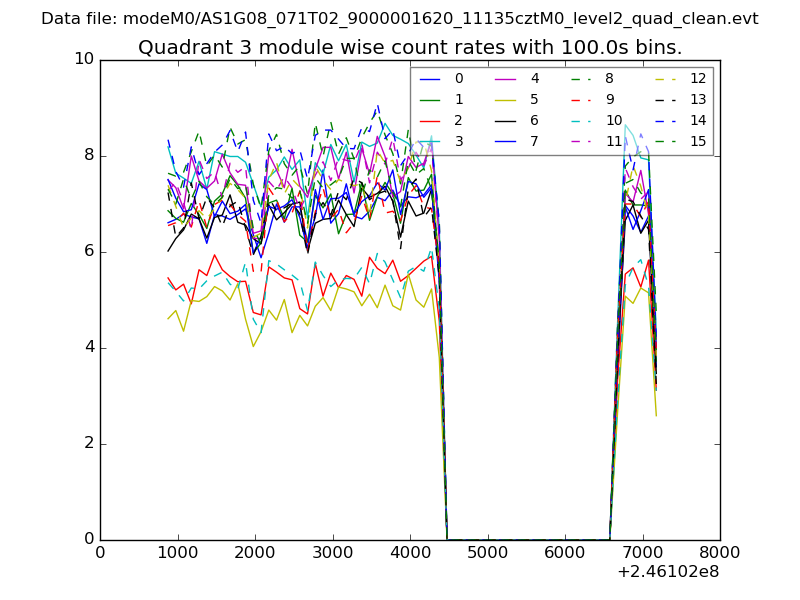 |
 |
| Parameter | Plot |
|---|---|
| CZT HV Monitor | 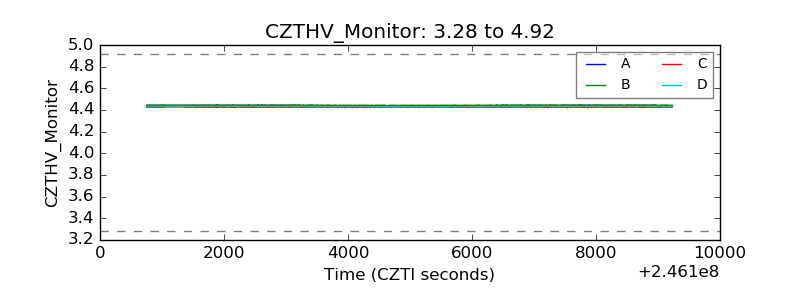 |
| D_VDD | 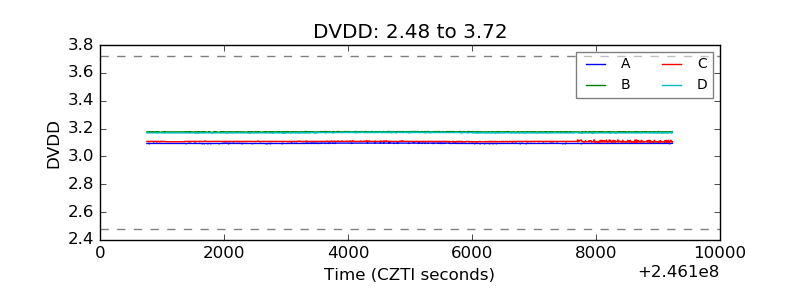 |
| Temperature 1 | 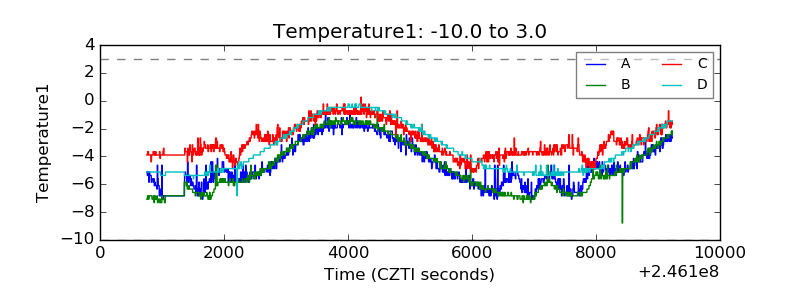 |
| Veto HV Monitor | 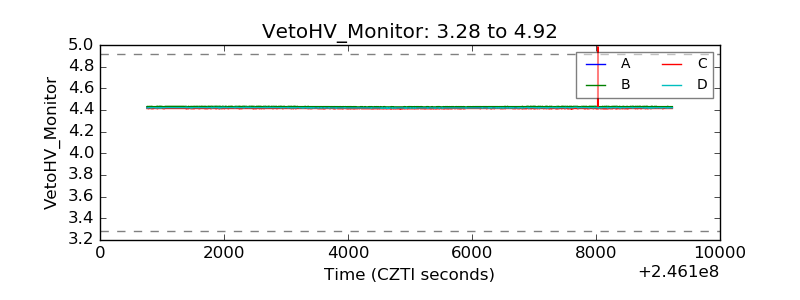 |
| Veto LLD | 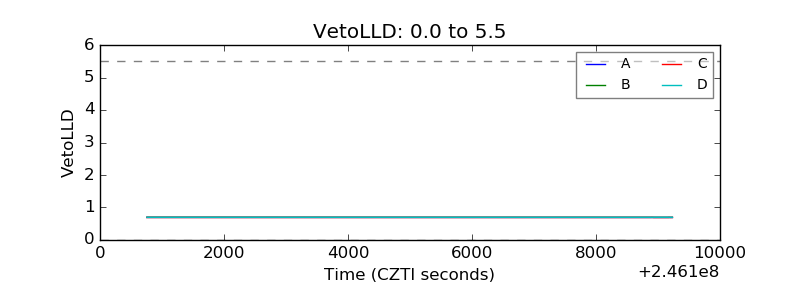 |
| Alpha Counter | 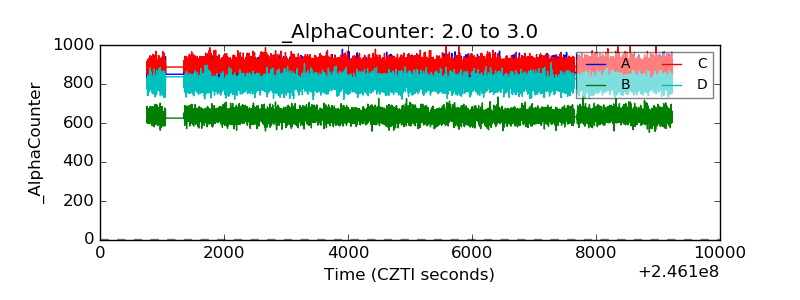 |
| _CPM_Rate | 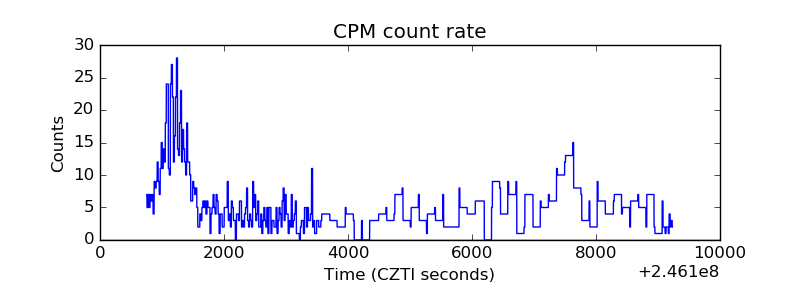 |
| CZT Counter | 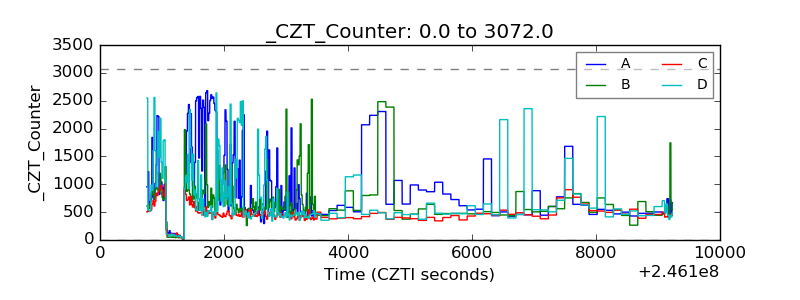 |
| +2.5 Volts monitor |  |
| +5 Volts monitor | 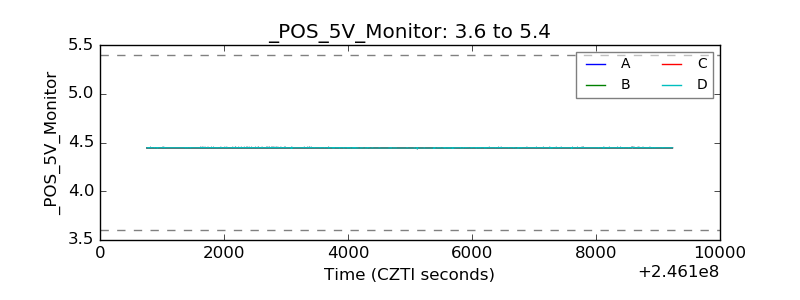 |
| _ROLL_ROT | 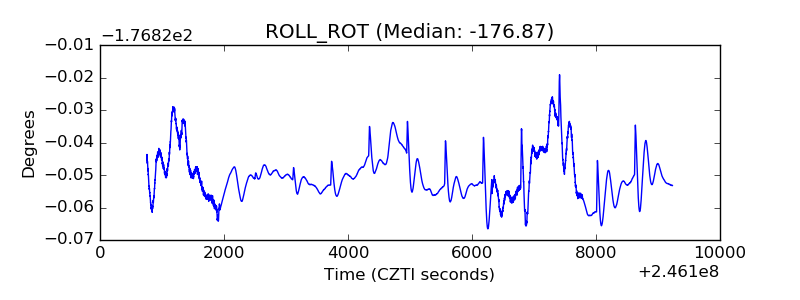 |
| _Roll_DEC | 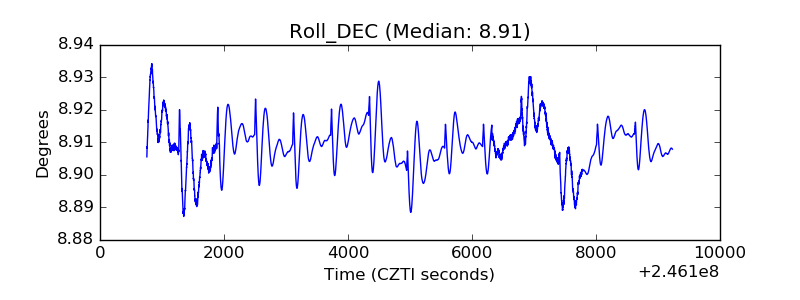 |
| _Roll_RA | 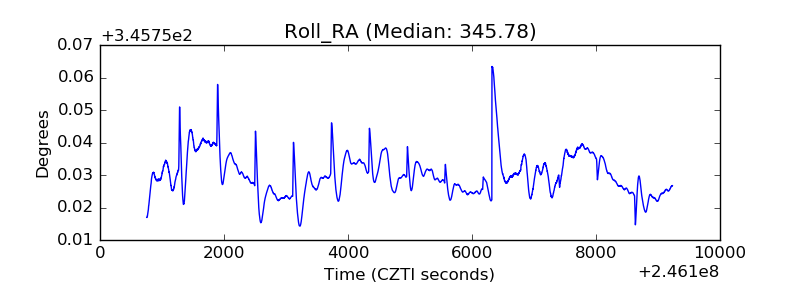 |
| Veto Counter | 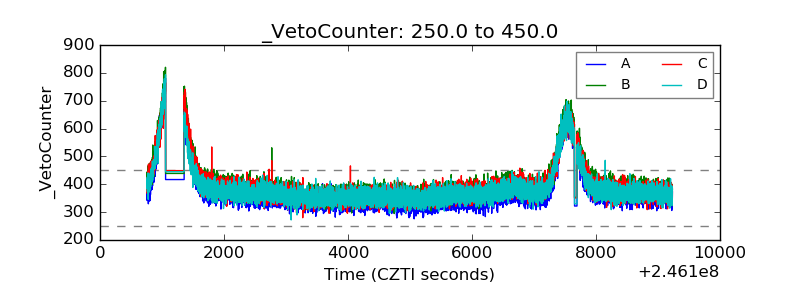 |