| Param | Original file | Final file |
|---|---|---|
| Filename | modeM0/AS1G08_071T02_9000001620_11136cztM0_level2.evt | modeM0/AS1G08_071T02_9000001620_11136cztM0_level2_quad_clean.evt |
| Size (bytes) | 719,559,360 | 87,099,840 |
| Size | 686.2 MB | 83.1 MB |
| Events in quadrant A | 6,405,738 | 512,608 |
| Events in quadrant B | 5,158,871 | 522,675 |
| Events in quadrant C | 4,265,611 | 530,363 |
| Events in quadrant D | 5,399,582 | 494,846 |
| Mode SS | |||
|---|---|---|---|
| Quadrant | BADHDUFLAG | Total packets | Discarded packets |
| A | 0 | 170 | 0 |
| B | 0 | 170 | 0 |
| C | 0 | 170 | 0 |
| D | 0 | 170 | 0 |
| Mode M9 | |||
|---|---|---|---|
| Quadrant | BADHDUFLAG | Total packets | Discarded packets |
| A | 0 | 3 | 0 |
| B | 0 | 3 | 0 |
| C | 0 | 3 | 0 |
| D | 0 | 3 | 0 |
| Mode M0 | |||
|---|---|---|---|
| Quadrant | BADHDUFLAG | Total packets | Discarded packets |
| A | 0 | 24689 | 2 |
| B | 0 | 20544 | 1 |
| C | 0 | 18335 | 1 |
| D | 0 | 21555 | 1 |
| Quadrant | Total seconds | Saturated seconds | Saturation percentage |
|---|---|---|---|
| A | 8302 | 572 | 6.889906% |
| B | 8302 | 629 | 7.576488% |
| C | 8302 | 365 | 4.396531% |
| D | 8302 | 650 | 7.829439% |
Noise dominated data is calculated using 1-second bins in cleaned event files. If a bin has >2000 counts, and if more than 50% of those come from <1% of pixels, then it is considered to be noise-dominated and hence unusable.
| Quadrant | # 1 sec bins | Bins with >0 counts | Bins with >2000 counts | High rate bins dominated by noise | Noise dominated (total time) | Noise dominated (detector-on time) | Marked lightcurve |
|---|---|---|---|---|---|---|---|
| A | 8602 | 8305 | 155 | 155 | 1.80% | 1.87% | 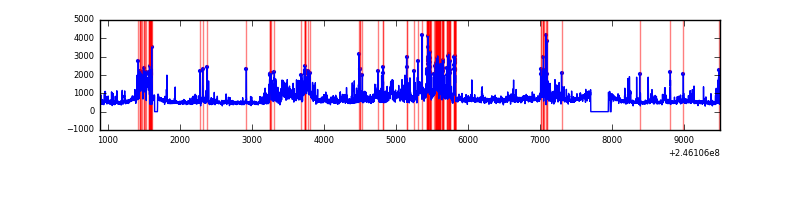 |
| B | 8602 | 8305 | 150 | 150 | 1.74% | 1.81% | 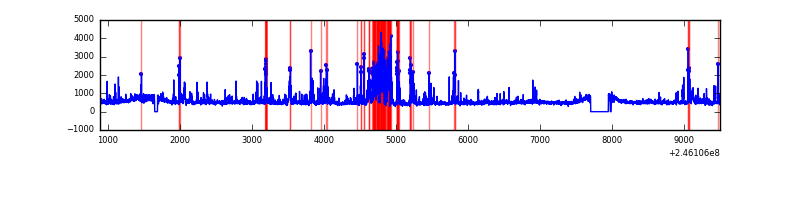 |
| C | 8602 | 8305 | 107 | 107 | 1.24% | 1.29% | 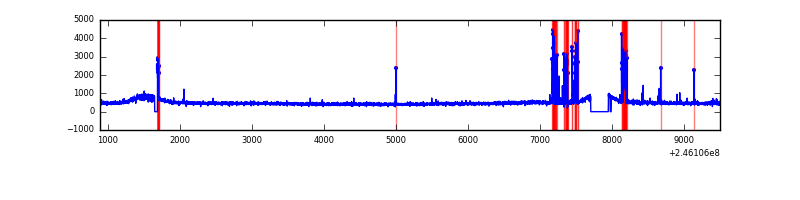 |
| D | 8602 | 8305 | 269 | 269 | 3.13% | 3.24% | 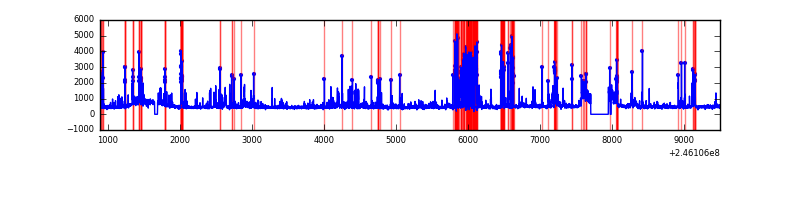 |
Top three noisy pixels from each quadrant. If the there are fewer than three noisy pixels in the level2.evt file, extra rows are filled as -1
| Pixel properties | Quadrant properties | ||||||
|---|---|---|---|---|---|---|---|
| Quadrant | DetID | PixID | Counts | Sigma | Mean | Median | Sigma |
| A | 8 | 5 | 1449564 | 7075.0 | 1000 | 975 | 204.7 |
| A | 8 | 15 | 802431 | 3914.36 | 1000 | 975 | 204.7 |
| A | 14 | 238 | 292295 | 1422.83 | 1000 | 975 | 204.7 |
| B | 4 | 239 | 883809 | 4489.1 | 1019 | 990 | 196.7 |
| B | 15 | 204 | 107171 | 539.93 | 1019 | 990 | 196.7 |
| B | 10 | 16 | 78244 | 392.83 | 1019 | 990 | 196.7 |
| C | 9 | 54 | 350657 | 1511.88 | 989 | 993 | 231.3 |
| C | 5 | 128 | 26315 | 109.49 | 989 | 993 | 231.3 |
| C | 14 | 234 | 12689 | 50.57 | 989 | 993 | 231.3 |
| D | 1 | 52 | 697096 | 2964.59 | 973 | 942 | 234.8 |
| D | 10 | 253 | 519082 | 2206.51 | 973 | 942 | 234.8 |
| D | 2 | 14 | 197596 | 837.46 | 973 | 942 | 234.8 |
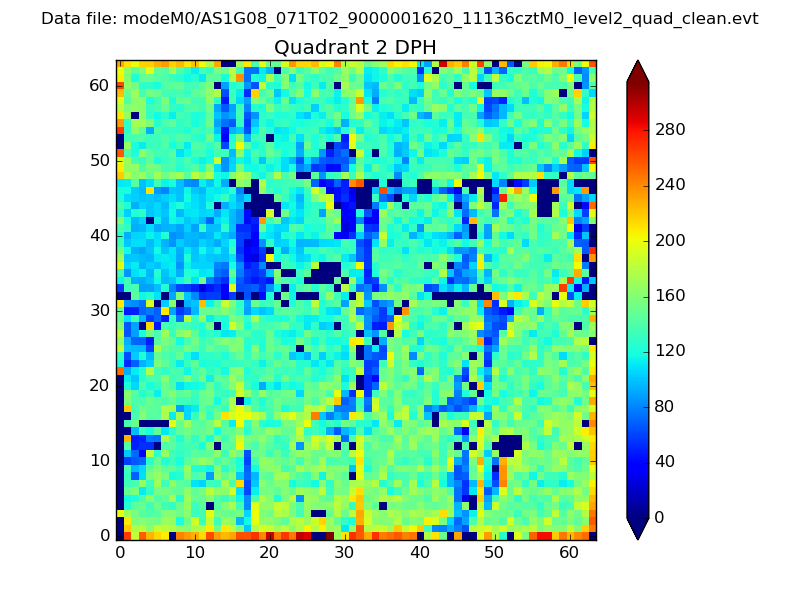
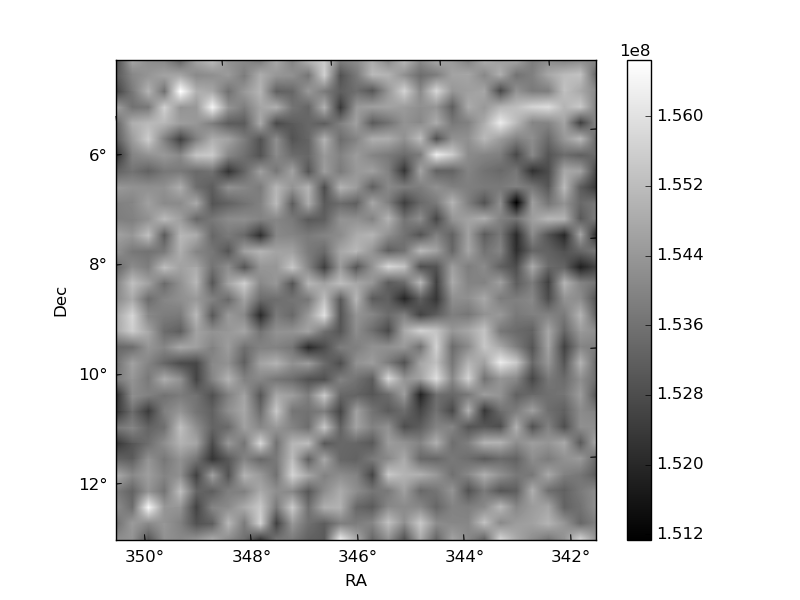
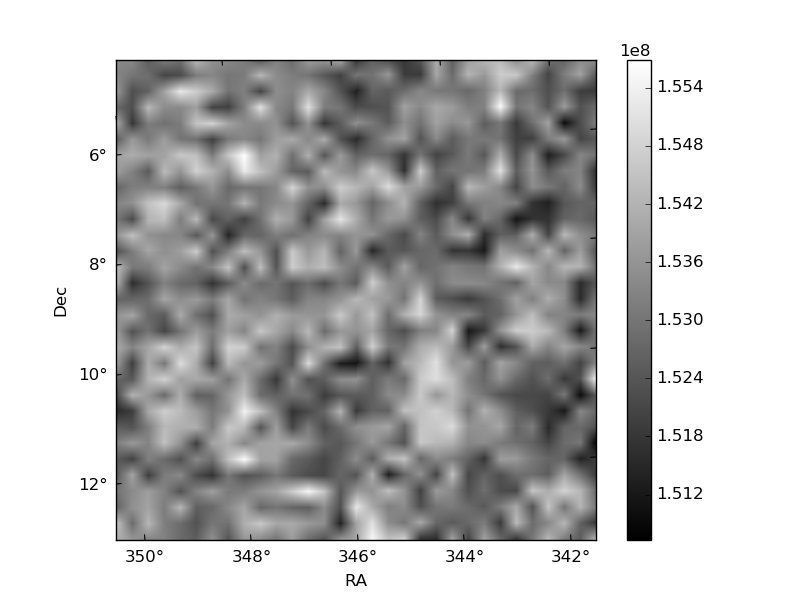
Histogram calculated using DETX and DETY for each event in the final _common_clean file
| Quadrant A | 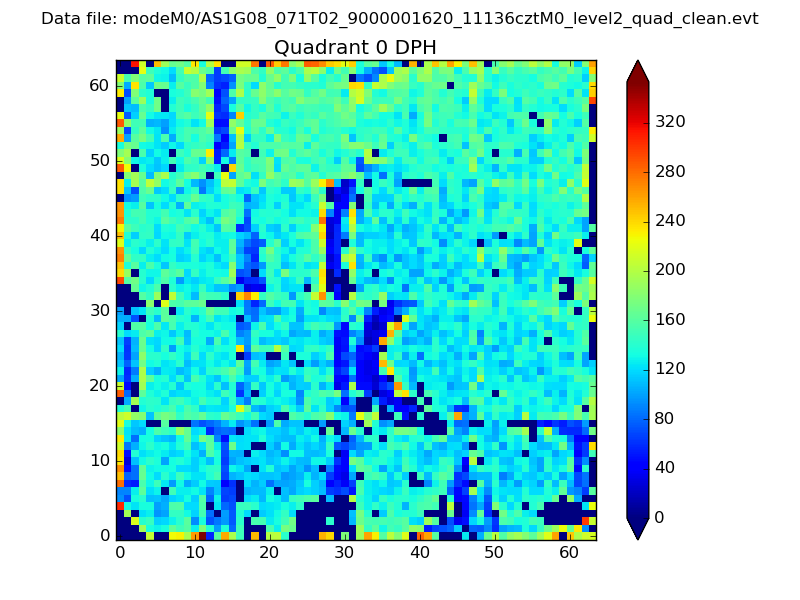 |
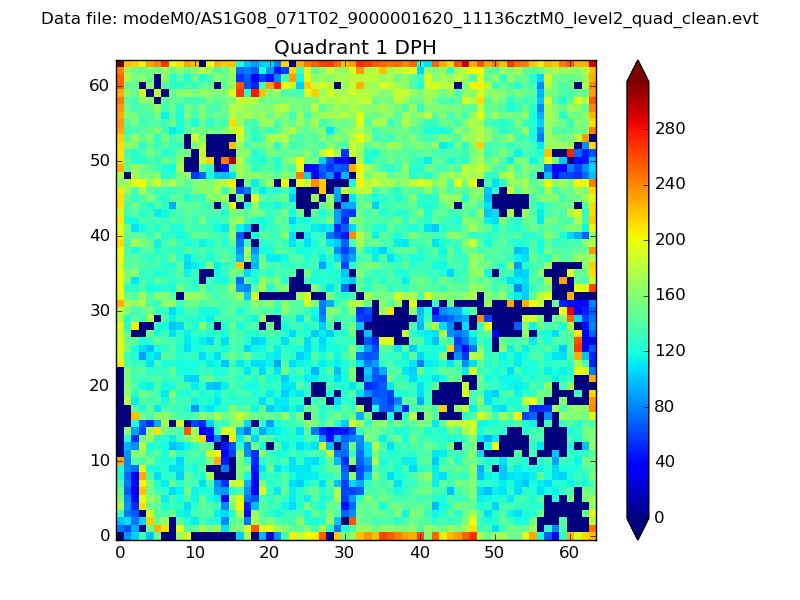 |
Quadrant B |
|---|---|---|---|
| Quadrant D | 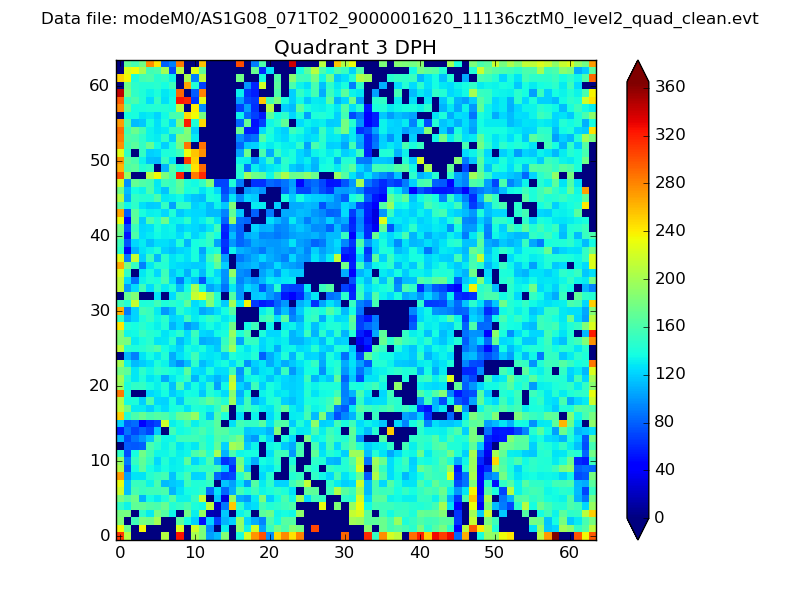 |
 |
Quadrant C |
| Plot type | Count rate plots | Images |
|---|---|---|
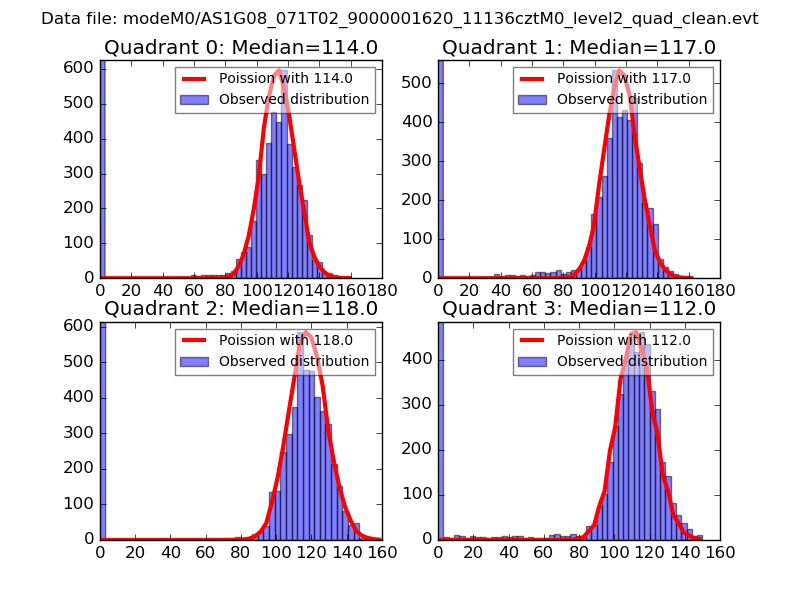
| Comparison with Poisson distribution Blue bars denote a histogram of data divided into 1 sec bins. Red curve is a Poisson curve with rate = median count rate of data. |
 |
 |
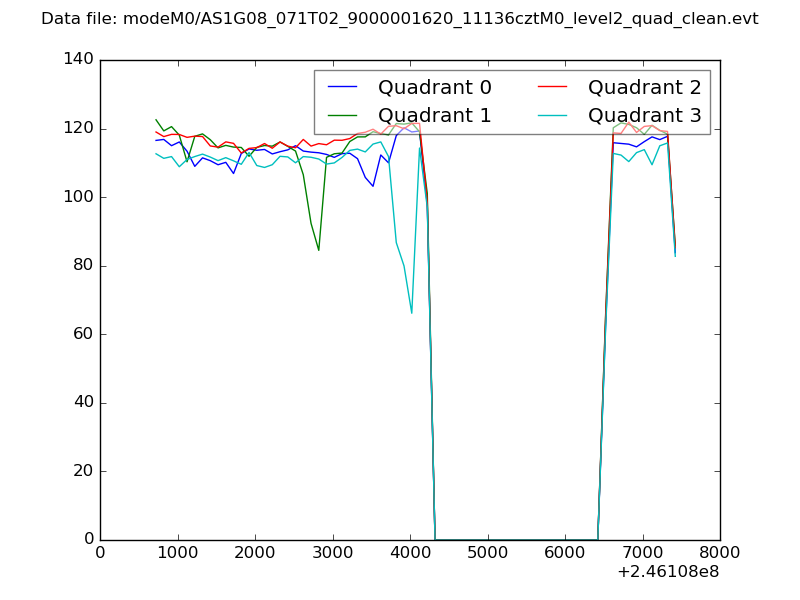
| Quadrant-wise count rates Data is divided into 100 sec bins |
 |
|
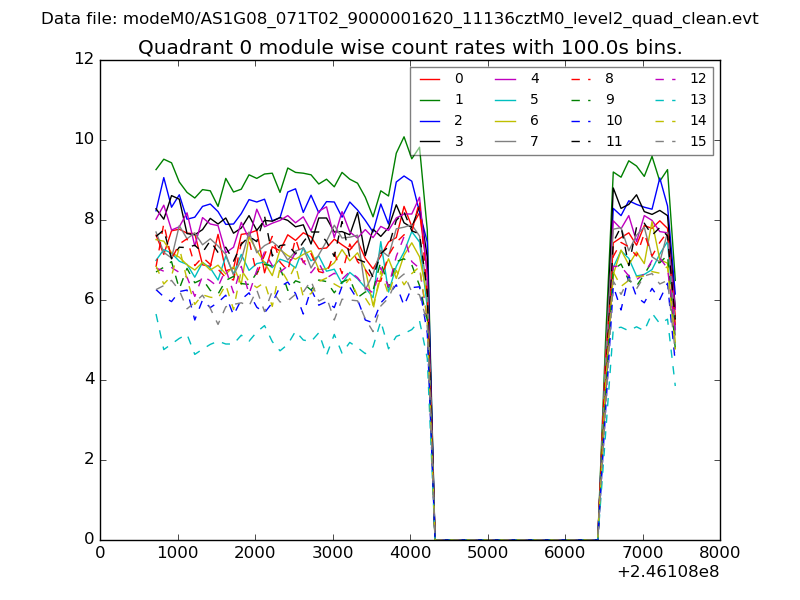
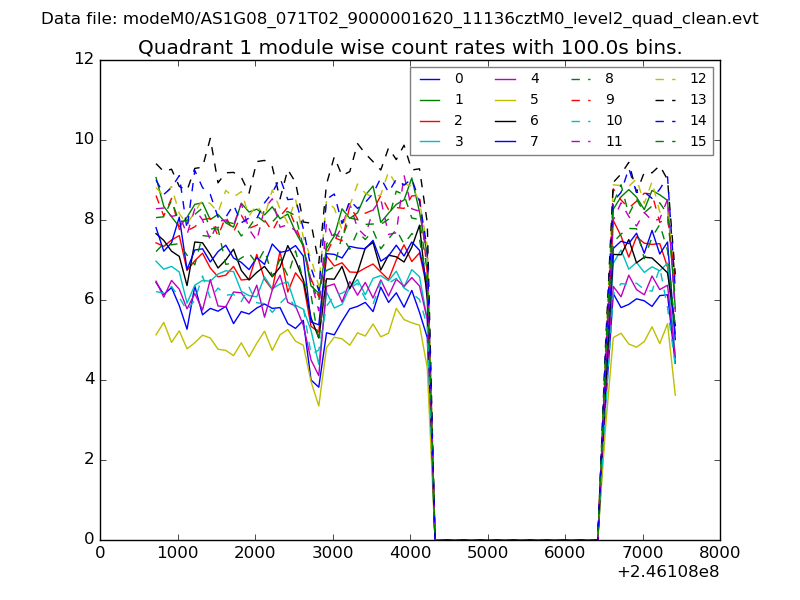
| Module-wise count rates for Quadrant A Data is divided into 100 sec bins |
 |
 |
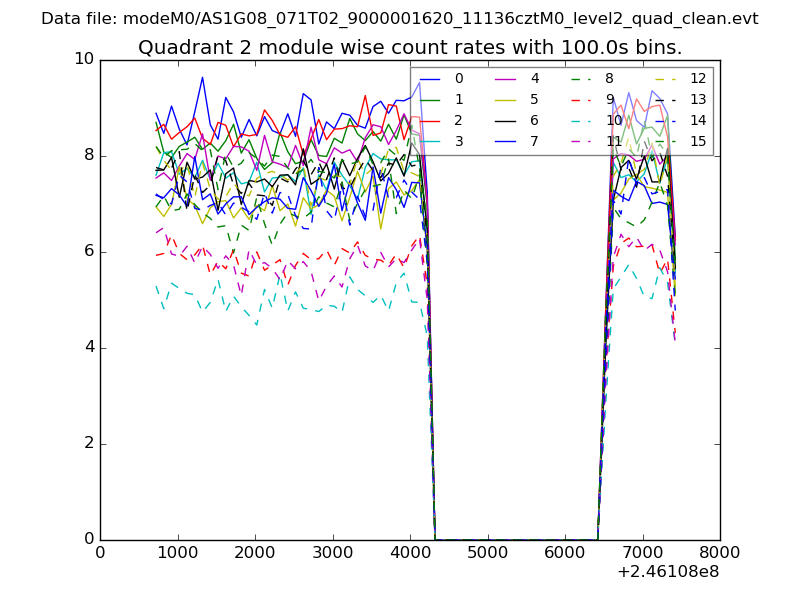
| Module-wise count rates for Quadrant B Data is divided into 100 sec bins |
 |
 |
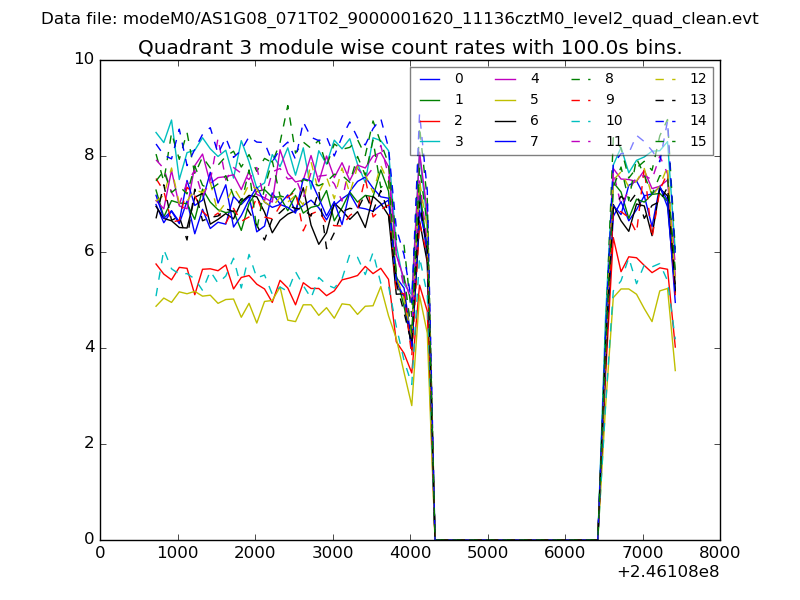
| Module-wise count rates for Quadrant C Data is divided into 100 sec bins |
 |
 |
| Module-wise count rates for Quadrant D Data is divided into 100 sec bins |
 |
 |
| Parameter | Plot |
|---|---|
| CZT HV Monitor | 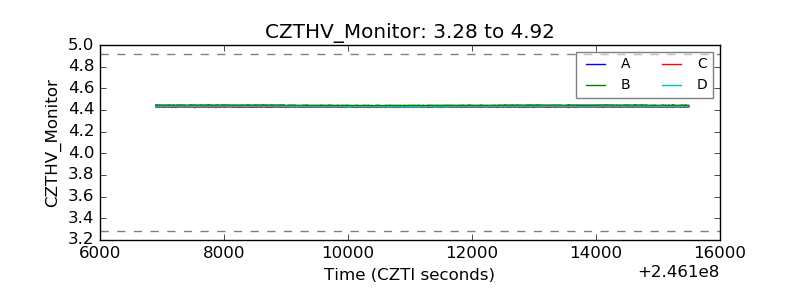 |
| D_VDD |  |
| Temperature 1 | 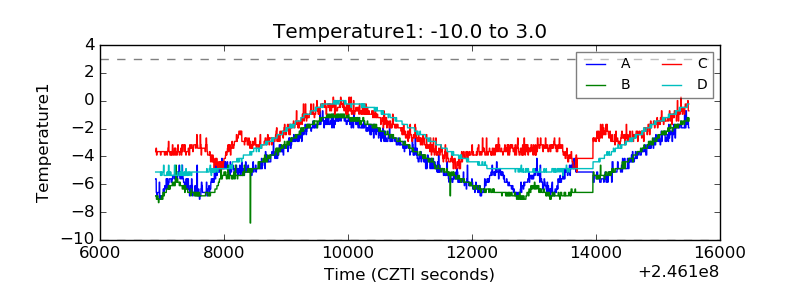 |
| Veto HV Monitor |  |
| Veto LLD | 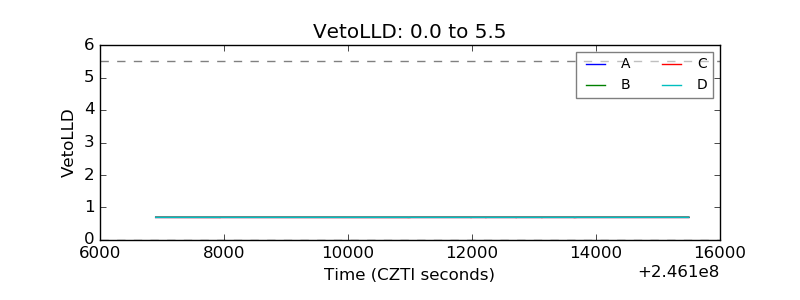 |
| Alpha Counter | 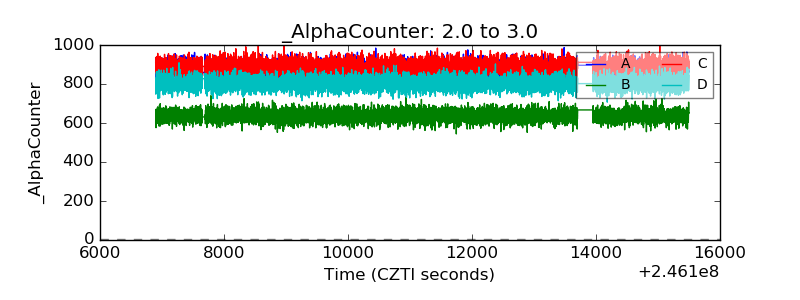 |
| _CPM_Rate | 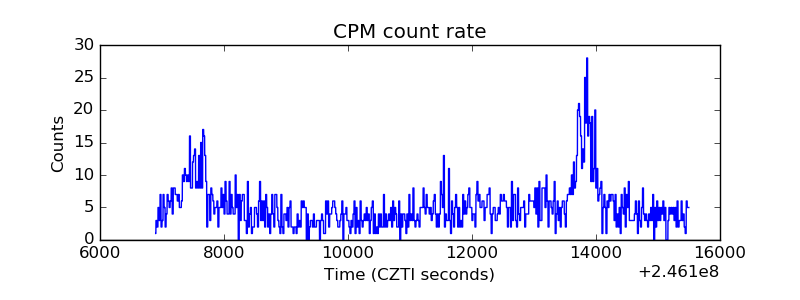 |
| CZT Counter | 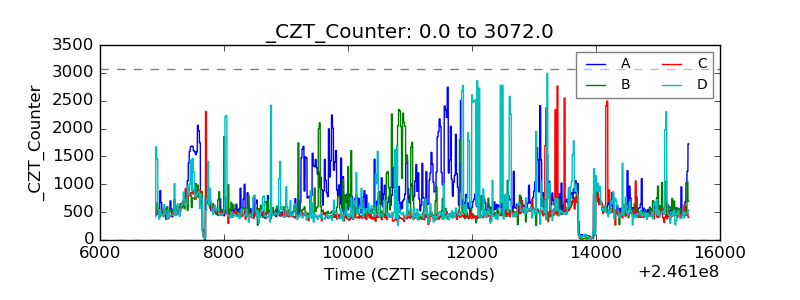 |
| +2.5 Volts monitor | 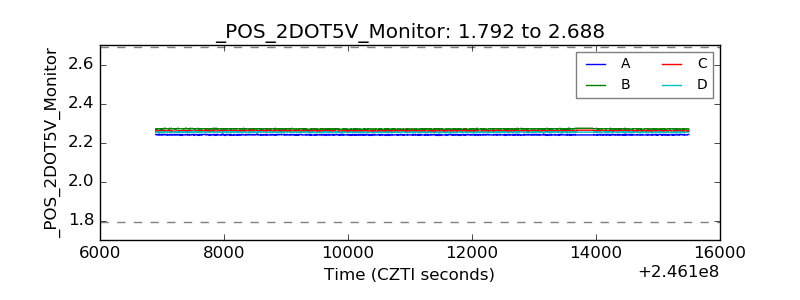 |
| +5 Volts monitor |  |
| _ROLL_ROT | 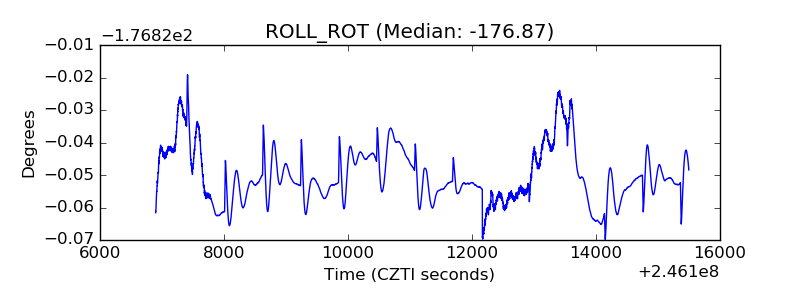 |
| _Roll_DEC | 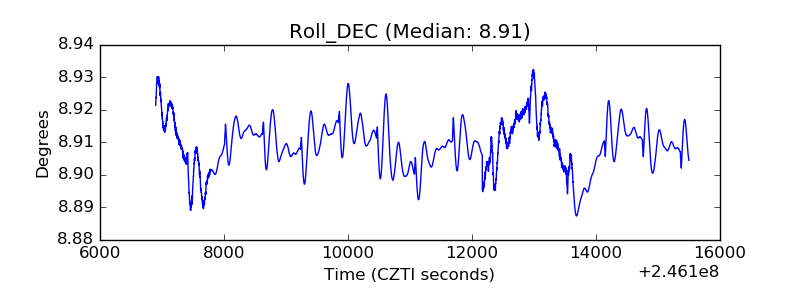 |
| _Roll_RA | 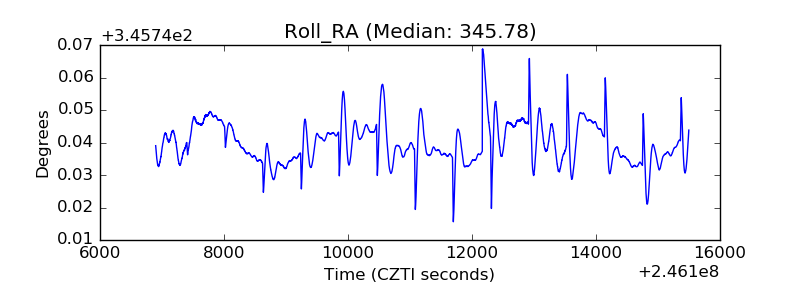 |
| Veto Counter | 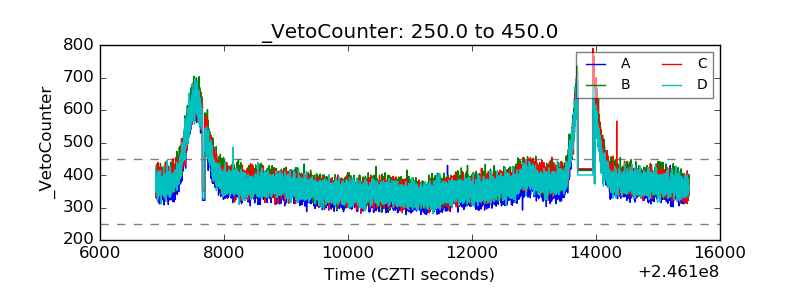 |