| Param | Original file | Final file |
|---|---|---|
| Filename | modeM0/AS1G08_071T02_9000001620_11139cztM0_level2.evt | modeM0/AS1G08_071T02_9000001620_11139cztM0_level2_quad_clean.evt |
| Size (bytes) | 886,392,000 | 130,466,880 |
| Size | 845.3 MB | 124.4 MB |
| Events in quadrant A | 8,967,154 | 805,583 |
| Events in quadrant B | 7,043,251 | 818,445 |
| Events in quadrant C | 4,227,865 | 851,454 |
| Events in quadrant D | 5,956,224 | 808,085 |
| Mode SS | |||
|---|---|---|---|
| Quadrant | BADHDUFLAG | Total packets | Discarded packets |
| A | 0 | 207 | 11 |
| B | 0 | 209 | 13 |
| C | 0 | 212 | 14 |
| D | 0 | 213 | 17 |
| Mode M9 | |||
|---|---|---|---|
| Quadrant | BADHDUFLAG | Total packets | Discarded packets |
| A | 0 | 9 | 5 |
| B | 0 | 4 | 0 |
| C | 0 | 4 | 0 |
| D | 0 | 6 | 2 |
| Mode M0 | |||
|---|---|---|---|
| Quadrant | BADHDUFLAG | Total packets | Discarded packets |
| A | 0 | 35715 | 2593 |
| B | 0 | 28840 | 1491 |
| C | 0 | 20931 | 1394 |
| D | 0 | 26182 | 1974 |
| Quadrant | Total seconds | Saturated seconds | Saturation percentage |
|---|---|---|---|
| A | 9588 | 955 | 9.960367% |
| B | 9635 | 733 | 7.607680% |
| C | 9618 | 41 | 0.426284% |
| D | 9613 | 433 | 4.504317% |
Noise dominated data is calculated using 1-second bins in cleaned event files. If a bin has >2000 counts, and if more than 50% of those come from <1% of pixels, then it is considered to be noise-dominated and hence unusable.
| Quadrant | # 1 sec bins | Bins with >0 counts | Bins with >2000 counts | High rate bins dominated by noise | Noise dominated (total time) | Noise dominated (detector-on time) | Marked lightcurve |
|---|---|---|---|---|---|---|---|
| A | 12283 | 9649 | 710 | 710 | 5.78% | 7.36% | 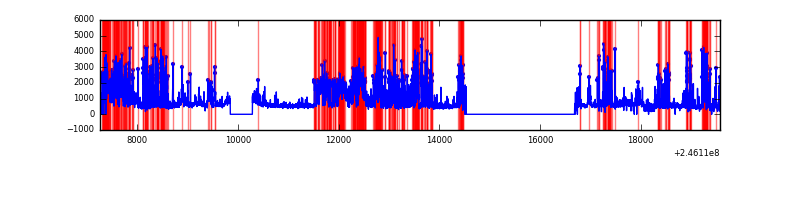 |
| B | 12314 | 9691 | 452 | 452 | 3.67% | 4.66% | 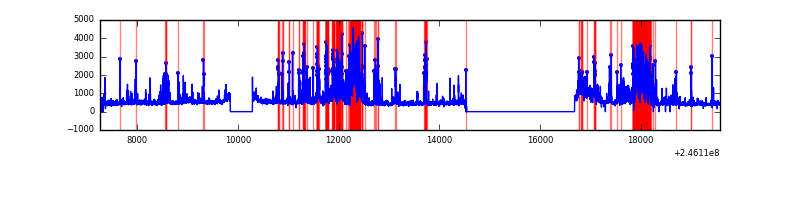 |
| C | 12283 | 9665 | 1 | 1 | 0.01% | 0.01% | 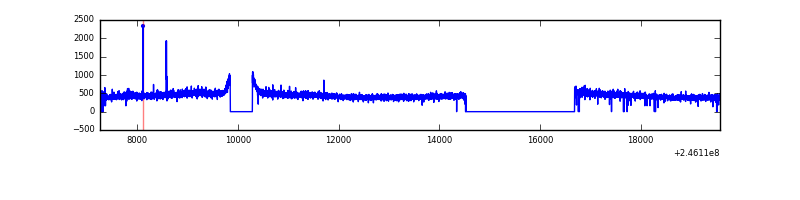 |
| D | 12313 | 9679 | 356 | 356 | 2.89% | 3.68% | 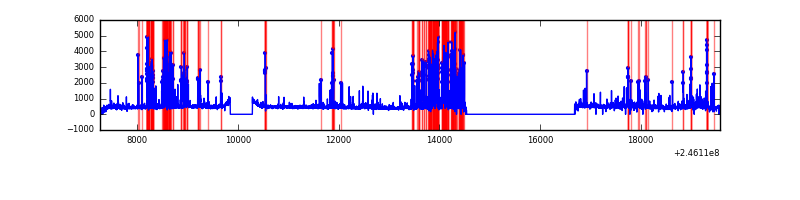 |
Top three noisy pixels from each quadrant. If the there are fewer than three noisy pixels in the level2.evt file, extra rows are filled as -1
| Pixel properties | Quadrant properties | ||||||
|---|---|---|---|---|---|---|---|
| Quadrant | DetID | PixID | Counts | Sigma | Mean | Median | Sigma |
| A | 8 | 5 | 2534144 | 11545.42 | 1073 | 1047 | 219.4 |
| A | 14 | 238 | 1781099 | 8113.17 | 1073 | 1047 | 219.4 |
| A | 8 | 15 | 424464 | 1929.86 | 1073 | 1047 | 219.4 |
| B | 4 | 239 | 1636838 | 7811.86 | 1086 | 1059 | 209.4 |
| B | 10 | 16 | 638054 | 3042.05 | 1086 | 1059 | 209.4 |
| B | 10 | 244 | 229058 | 1088.84 | 1086 | 1059 | 209.4 |
| C | 5 | 128 | 12170 | 44.24 | 1077 | 1083 | 250.6 |
| C | 14 | 234 | 9945 | 35.36 | 1077 | 1083 | 250.6 |
| C | 13 | 61 | 7950 | 27.4 | 1077 | 1083 | 250.6 |
| D | 10 | 253 | 1192943 | 4671.1 | 1055 | 1024 | 255.2 |
| D | 2 | 14 | 193486 | 754.25 | 1055 | 1024 | 255.2 |
| D | 1 | 52 | 114703 | 445.51 | 1055 | 1024 | 255.2 |
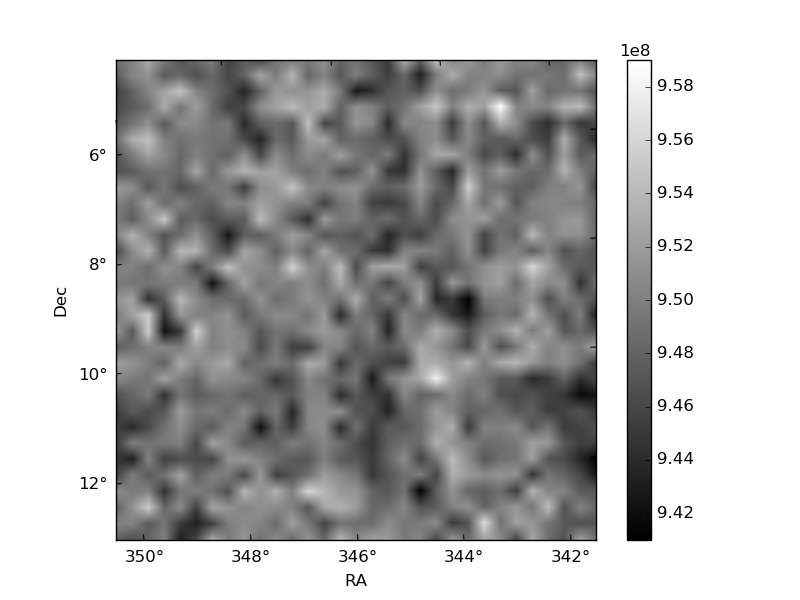
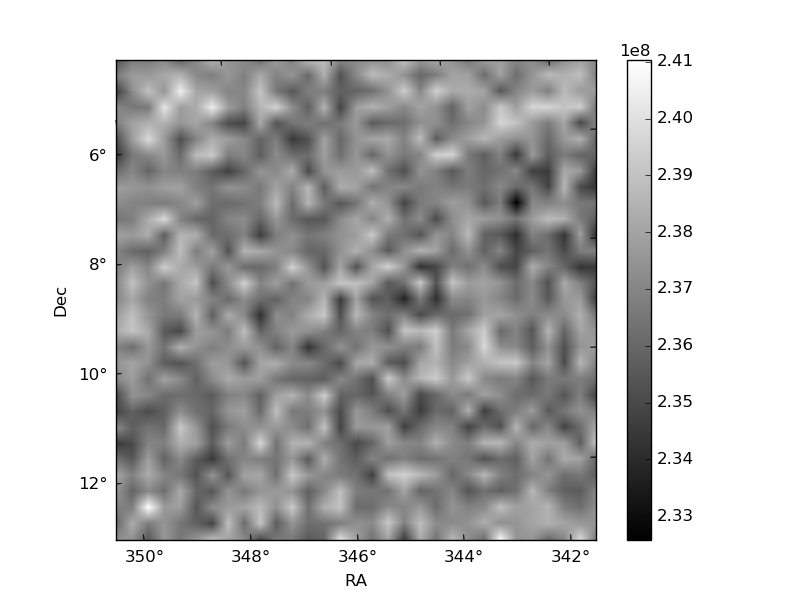
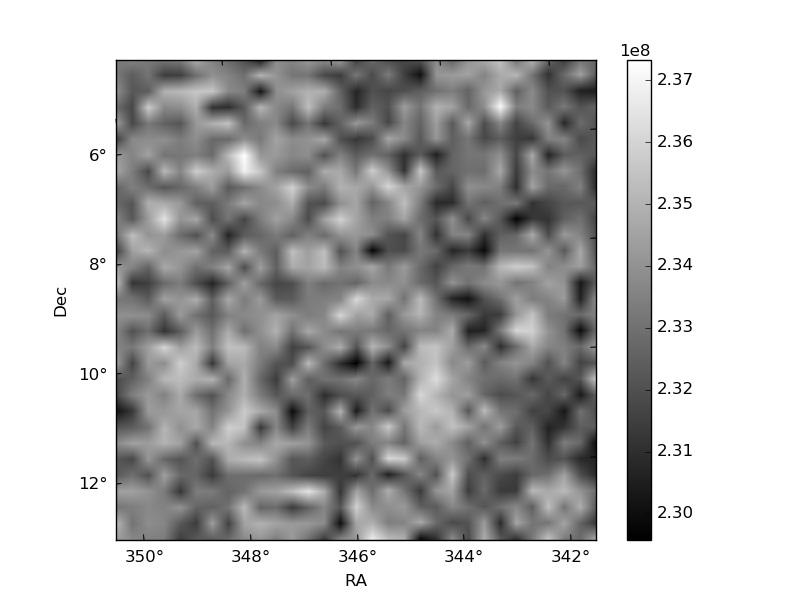
Histogram calculated using DETX and DETY for each event in the final _common_clean file
| Quadrant A | 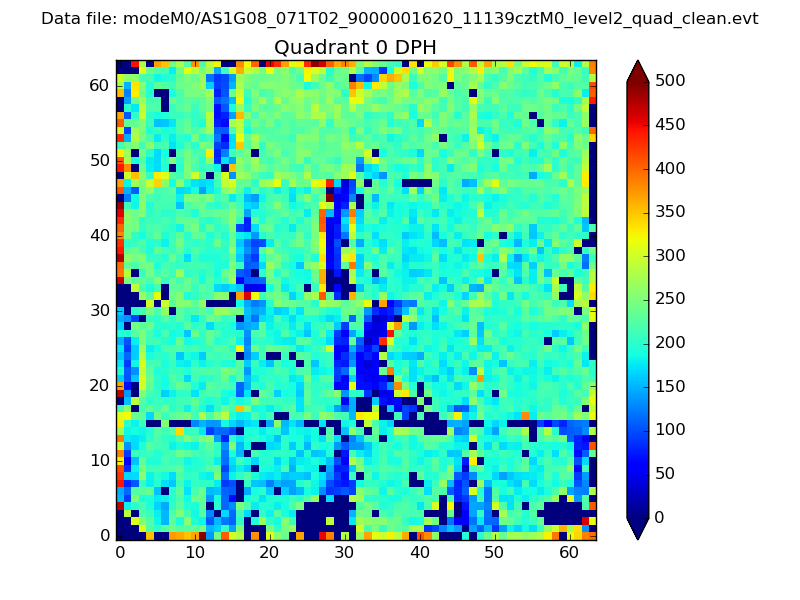 |
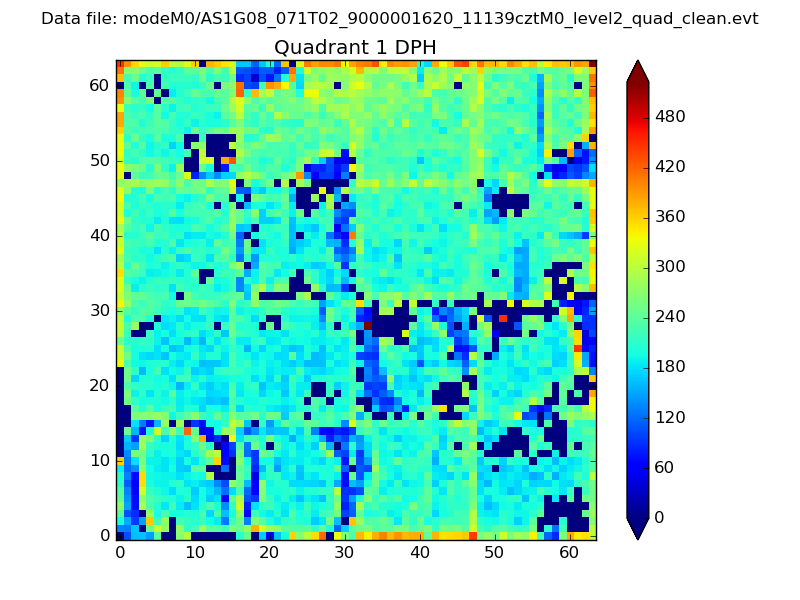 |
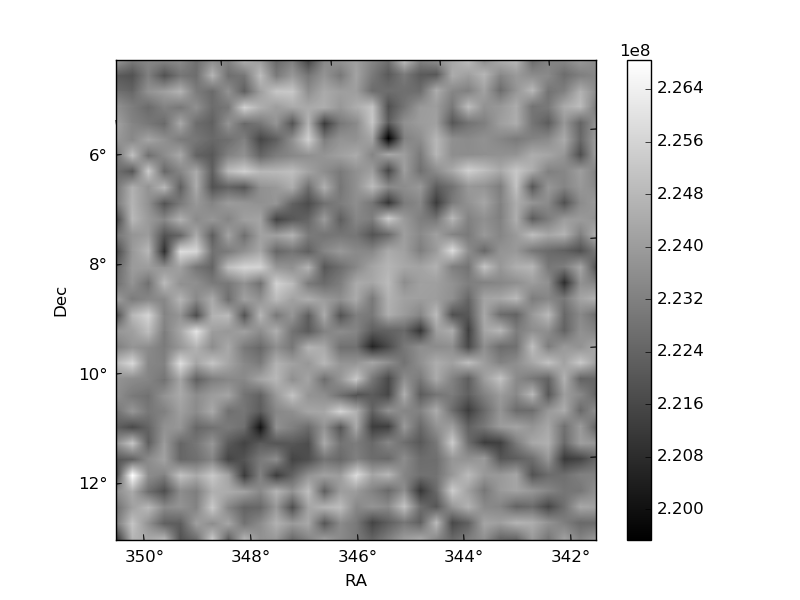
Quadrant B |
|---|---|---|---|
| Quadrant D | 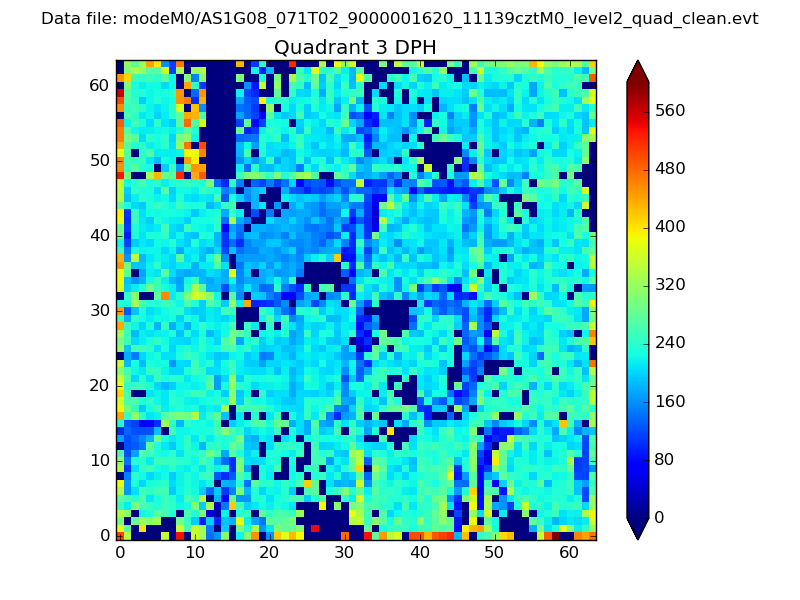 |
 |
Quadrant C |
| Plot type | Count rate plots | Images |
|---|---|---|
| Comparison with Poisson distribution Blue bars denote a histogram of data divided into 1 sec bins. Red curve is a Poisson curve with rate = median count rate of data. |
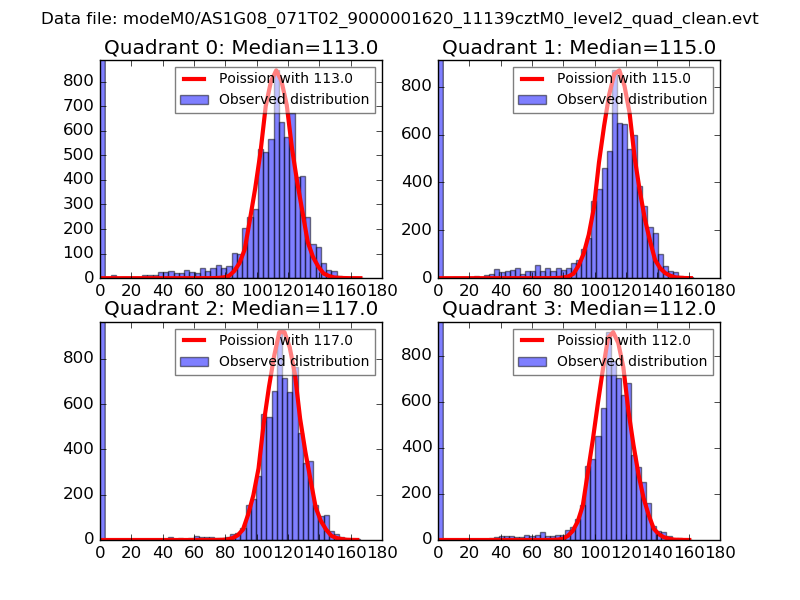 |
 |
| Quadrant-wise count rates Data is divided into 100 sec bins |
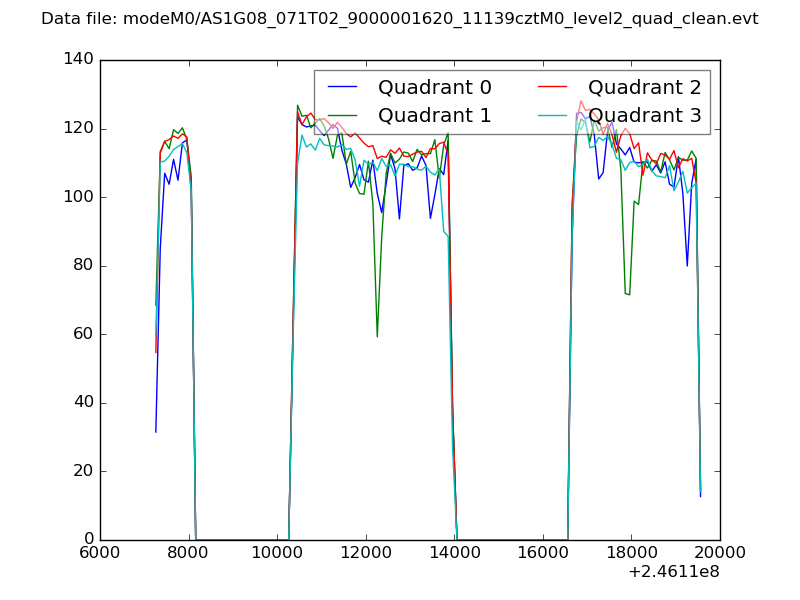 |
|
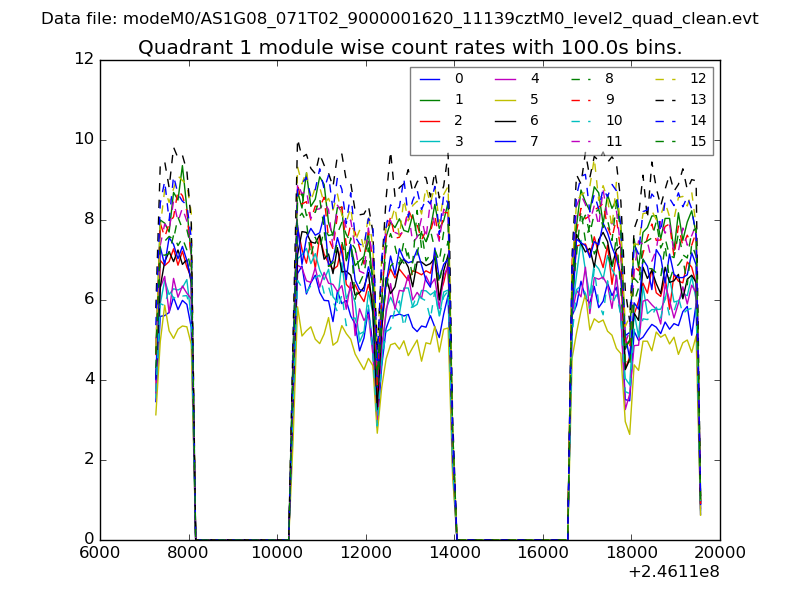
| Module-wise count rates for Quadrant A Data is divided into 100 sec bins |
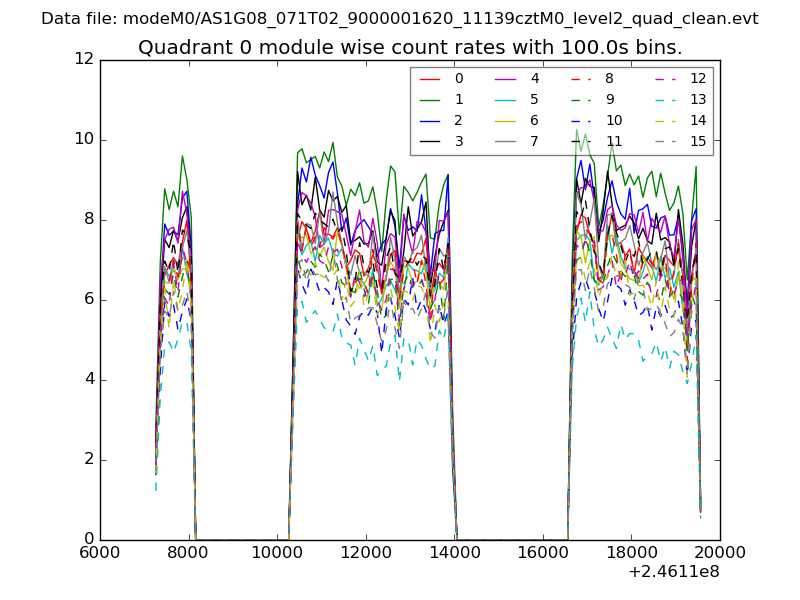 |
 |
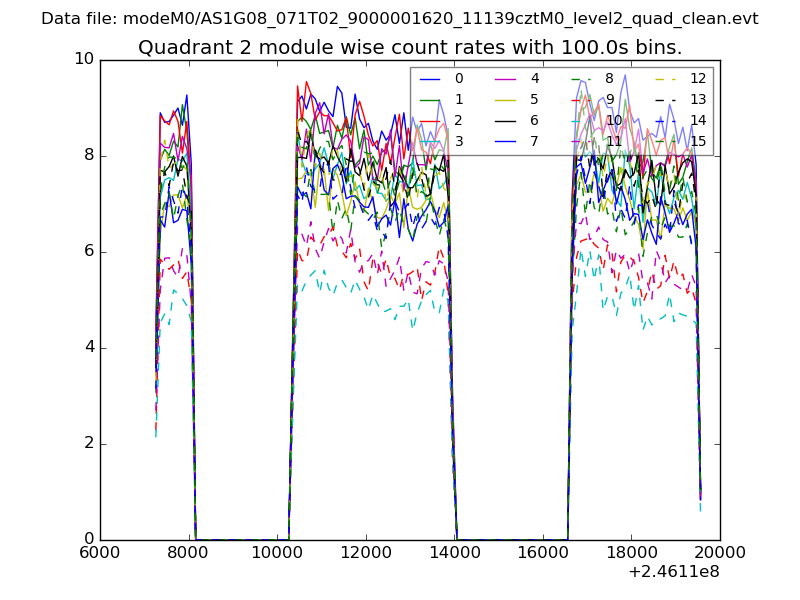
| Module-wise count rates for Quadrant B Data is divided into 100 sec bins |
 |
 |
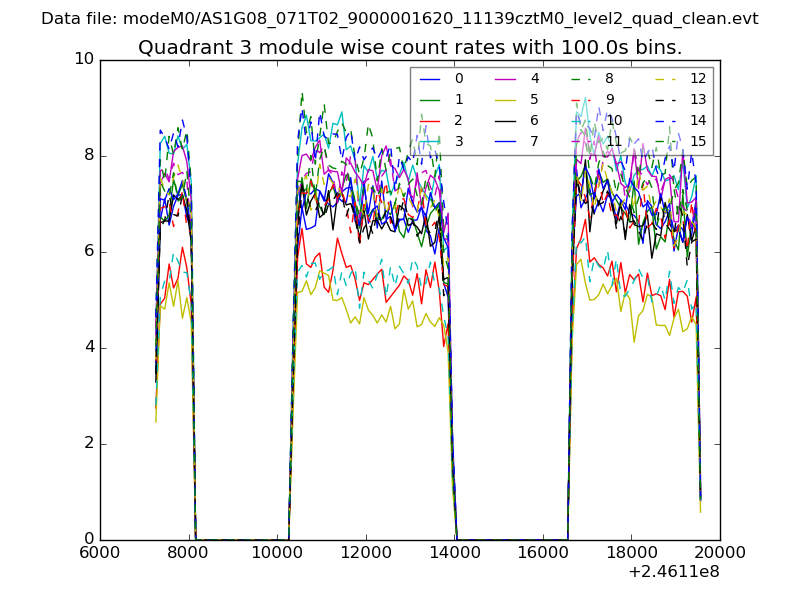
| Module-wise count rates for Quadrant C Data is divided into 100 sec bins |
 |
 |
| Module-wise count rates for Quadrant D Data is divided into 100 sec bins |
 |
 |
| Parameter | Plot |
|---|---|
| CZT HV Monitor | 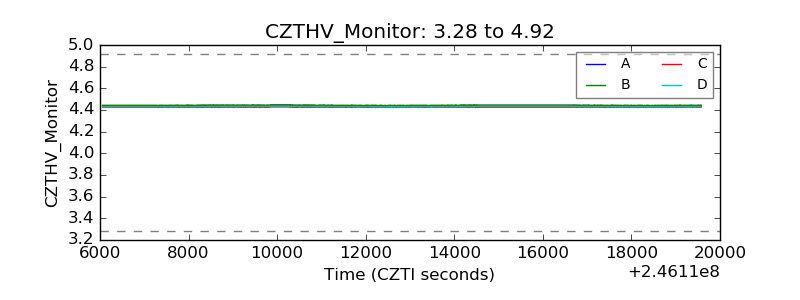 |
| D_VDD | 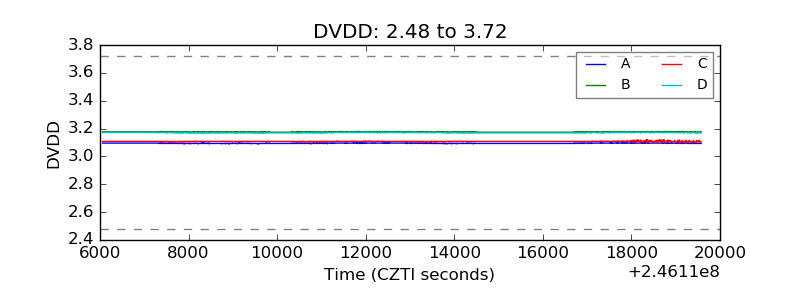 |
| Temperature 1 | 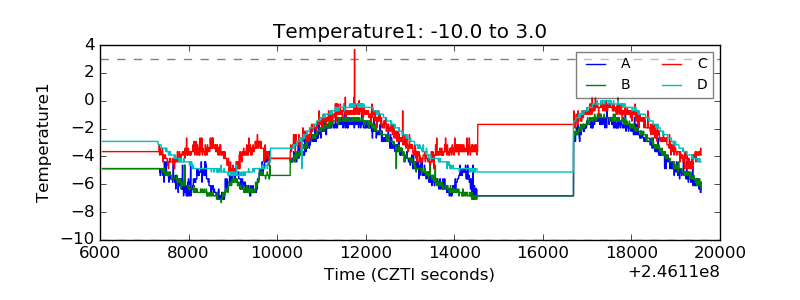 |
| Veto HV Monitor | 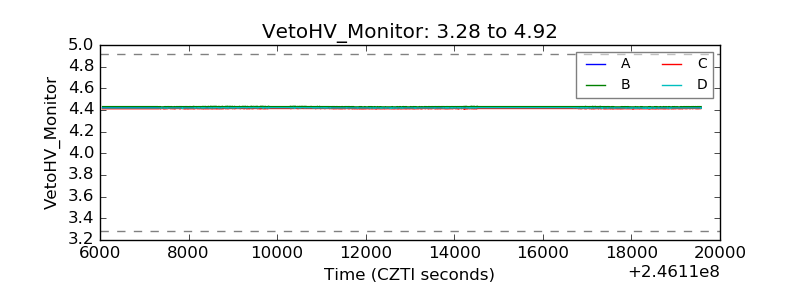 |
| Veto LLD | 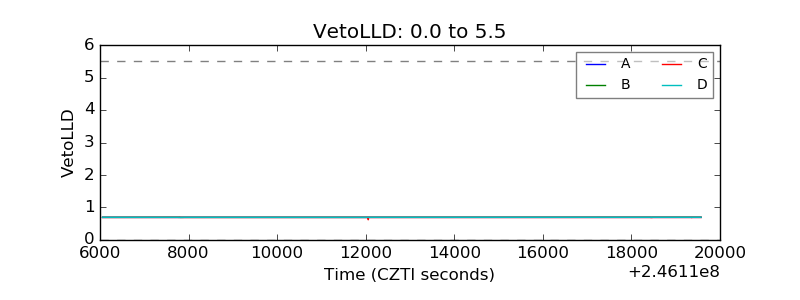 |
| Alpha Counter | 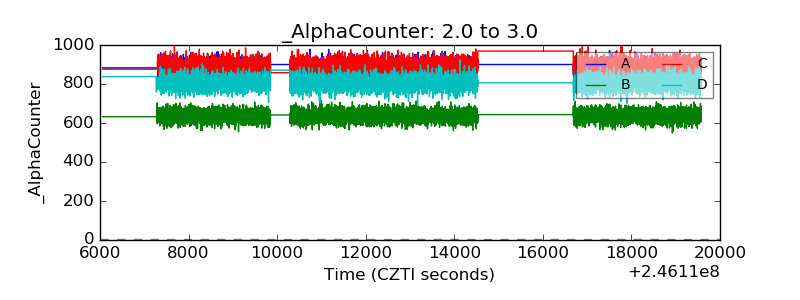 |
| _CPM_Rate | 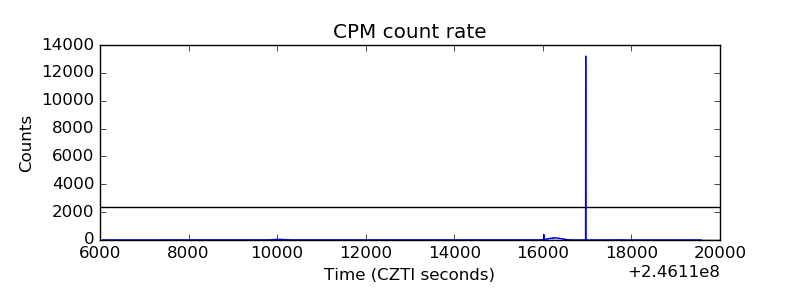 |
| CZT Counter |  |
| +2.5 Volts monitor |  |
| +5 Volts monitor |  |
| _ROLL_ROT | 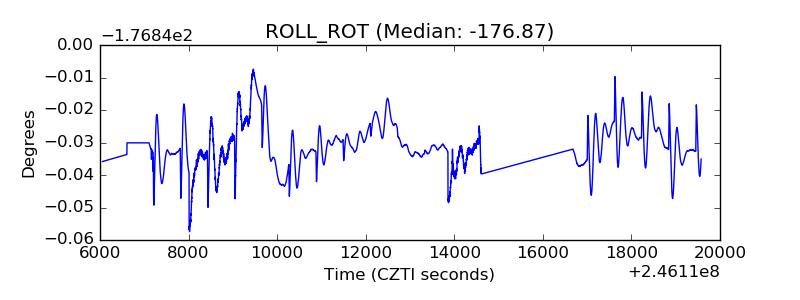 |
| _Roll_DEC | 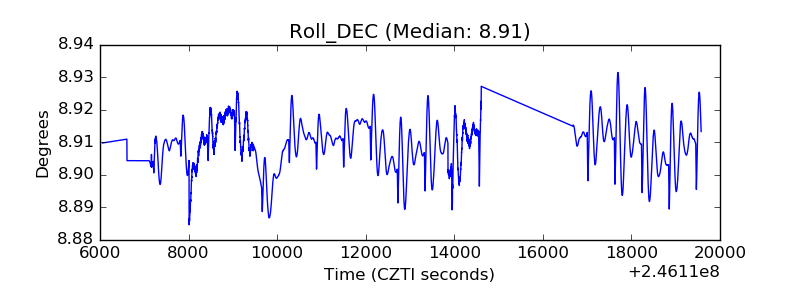 |
| _Roll_RA | 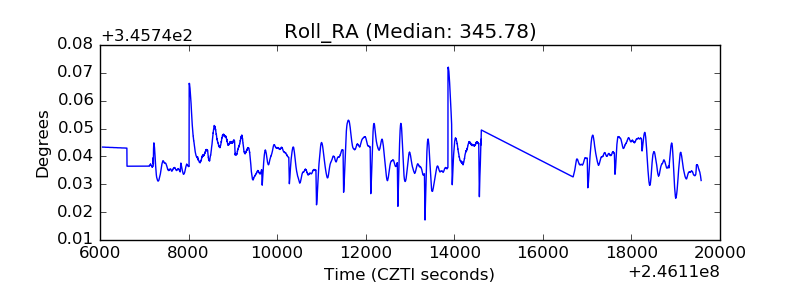 |
| Veto Counter | 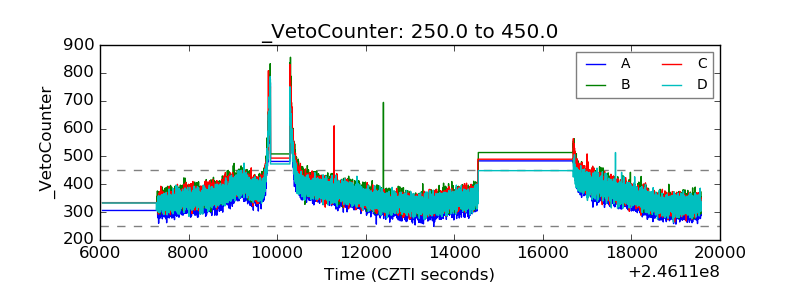 |