| Param | Original file | Final file |
|---|---|---|
| Filename | modeM0/AS1G08_071T02_9000001620_11140cztM0_level2.evt | modeM0/AS1G08_071T02_9000001620_11140cztM0_level2_quad_clean.evt |
| Size (bytes) | 1,065,594,240 | 133,931,520 |
| Size | 1016.2 MB | 127.7 MB |
| Events in quadrant A | 11,334,588 | 793,180 |
| Events in quadrant B | 7,542,636 | 820,090 |
| Events in quadrant C | 5,155,376 | 844,998 |
| Events in quadrant D | 7,464,087 | 803,294 |
| Mode SS | |||
|---|---|---|---|
| Quadrant | BADHDUFLAG | Total packets | Discarded packets |
| A | 0 | 243 | 13 |
| B | 0 | 242 | 10 |
| C | 0 | 242 | 8 |
| D | 0 | 240 | 9 |
| Mode M9 | |||
|---|---|---|---|
| Quadrant | BADHDUFLAG | Total packets | Discarded packets |
| A | 0 | 13 | 2 |
| B | 0 | 18 | 7 |
| C | 0 | 13 | 2 |
| D | 0 | 14 | 4 |
| Mode M0 | |||
|---|---|---|---|
| Quadrant | BADHDUFLAG | Total packets | Discarded packets |
| A | 0 | 42763 | 1530 |
| B | 0 | 30837 | 900 |
| C | 0 | 24427 | 821 |
| D | 0 | 30885 | 955 |
| Quadrant | Total seconds | Saturated seconds | Saturation percentage |
|---|---|---|---|
| A | 11458 | 1865 | 16.276837% |
| B | 11488 | 598 | 5.205432% |
| C | 11495 | 70 | 0.608960% |
| D | 11490 | 683 | 5.944299% |
Noise dominated data is calculated using 1-second bins in cleaned event files. If a bin has >2000 counts, and if more than 50% of those come from <1% of pixels, then it is considered to be noise-dominated and hence unusable.
| Quadrant | # 1 sec bins | Bins with >0 counts | Bins with >2000 counts | High rate bins dominated by noise | Noise dominated (total time) | Noise dominated (detector-on time) | Marked lightcurve |
|---|---|---|---|---|---|---|---|
| A | 17210 | 11500 | 1467 | 1467 | 8.52% | 12.76% | 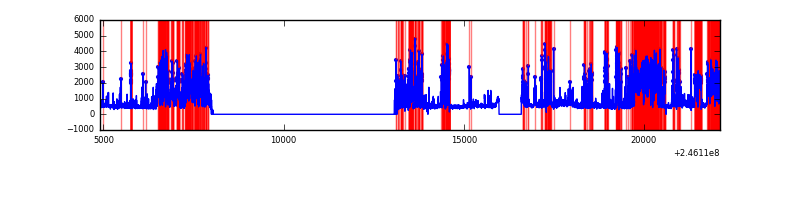 |
| B | 17210 | 11522 | 328 | 328 | 1.91% | 2.85% | 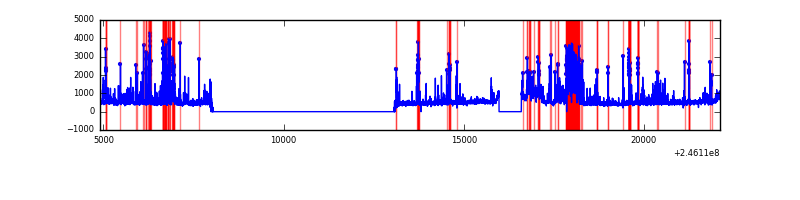 |
| C | 17210 | 11525 | 15 | 15 | 0.09% | 0.13% | 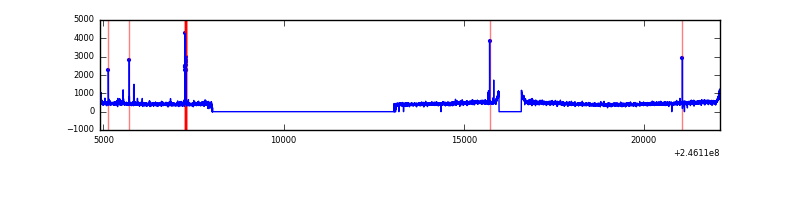 |
| D | 17210 | 11515 | 553 | 553 | 3.21% | 4.80% | 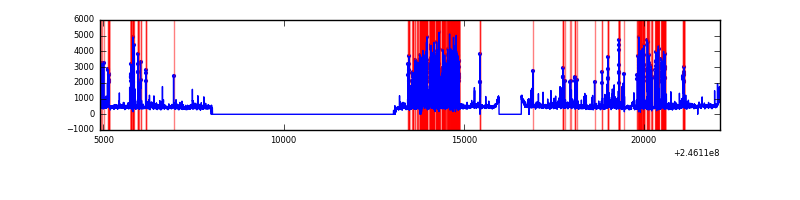 |
Top three noisy pixels from each quadrant. If the there are fewer than three noisy pixels in the level2.evt file, extra rows are filled as -1
| Pixel properties | Quadrant properties | ||||||
|---|---|---|---|---|---|---|---|
| Quadrant | DetID | PixID | Counts | Sigma | Mean | Median | Sigma |
| A | 8 | 5 | 3316462 | 13036.62 | 1249 | 1221 | 254.3 |
| A | 14 | 238 | 2183620 | 8581.91 | 1249 | 1221 | 254.3 |
| A | 14 | 63 | 650609 | 2553.61 | 1249 | 1221 | 254.3 |
| B | 4 | 239 | 1614633 | 6405.11 | 1312 | 1279 | 251.9 |
| B | 10 | 244 | 247598 | 977.9 | 1312 | 1279 | 251.9 |
| B | 10 | 16 | 147734 | 581.43 | 1312 | 1279 | 251.9 |
| C | 5 | 128 | 84749 | 275.63 | 1293 | 1300 | 302.8 |
| C | 9 | 54 | 17173 | 52.43 | 1293 | 1300 | 302.8 |
| C | 13 | 61 | 9697 | 27.73 | 1293 | 1300 | 302.8 |
| D | 10 | 253 | 1792851 | 5838.86 | 1256 | 1219 | 306.8 |
| D | 1 | 52 | 226964 | 735.69 | 1256 | 1219 | 306.8 |
| D | 2 | 14 | 178087 | 576.41 | 1256 | 1219 | 306.8 |
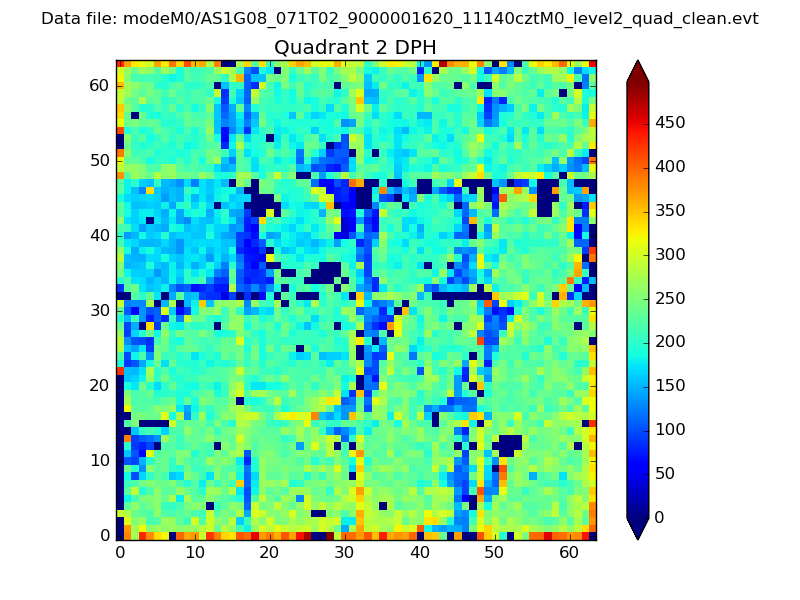
Histogram calculated using DETX and DETY for each event in the final _common_clean file
| Quadrant A | 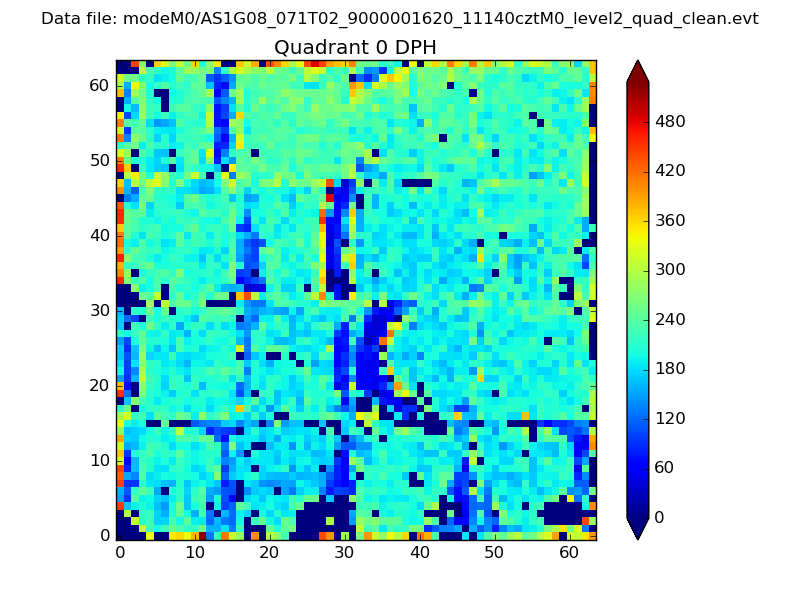 |
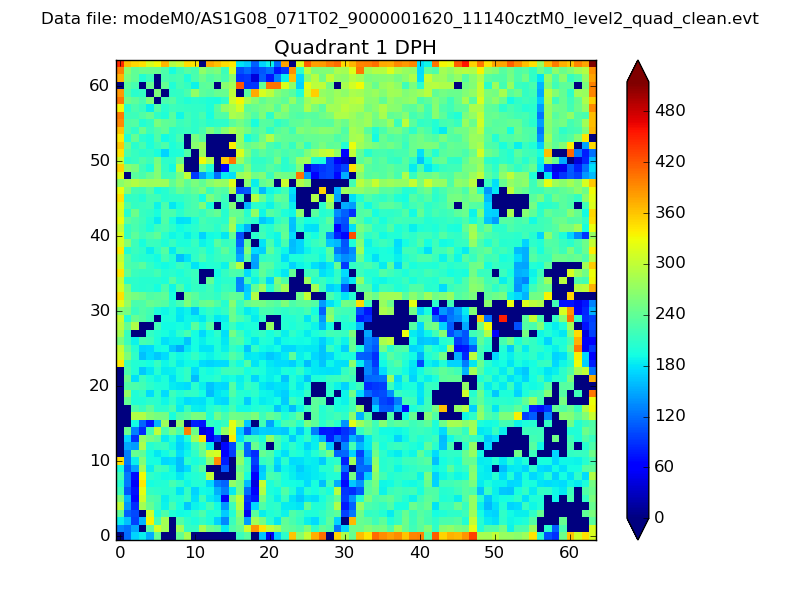 |
Quadrant B |
|---|---|---|---|
| Quadrant D | 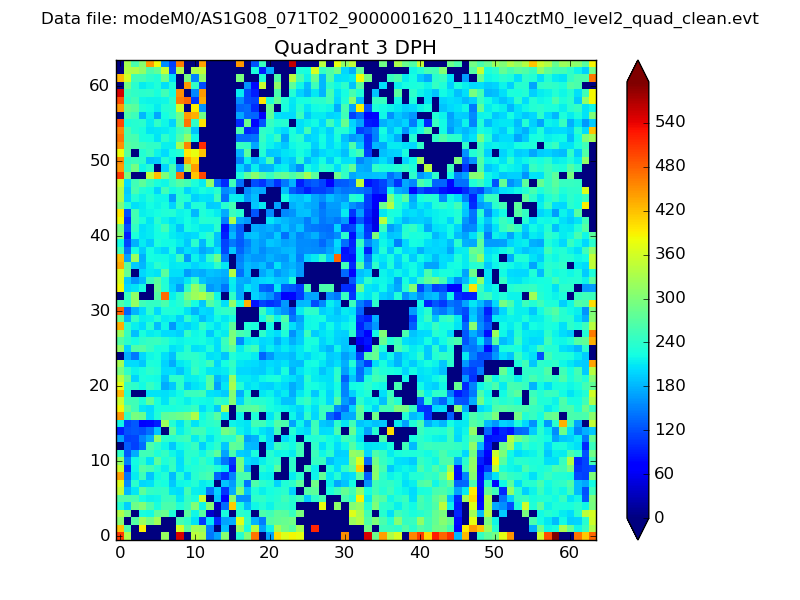 |
 |
Quadrant C |
| Plot type | Count rate plots | Images |
|---|---|---|
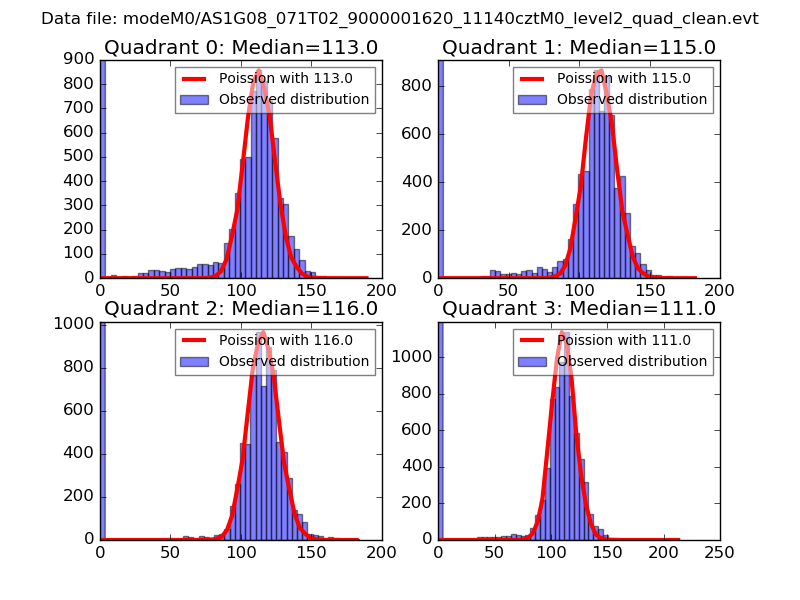
| Comparison with Poisson distribution Blue bars denote a histogram of data divided into 1 sec bins. Red curve is a Poisson curve with rate = median count rate of data. |
 |
 |
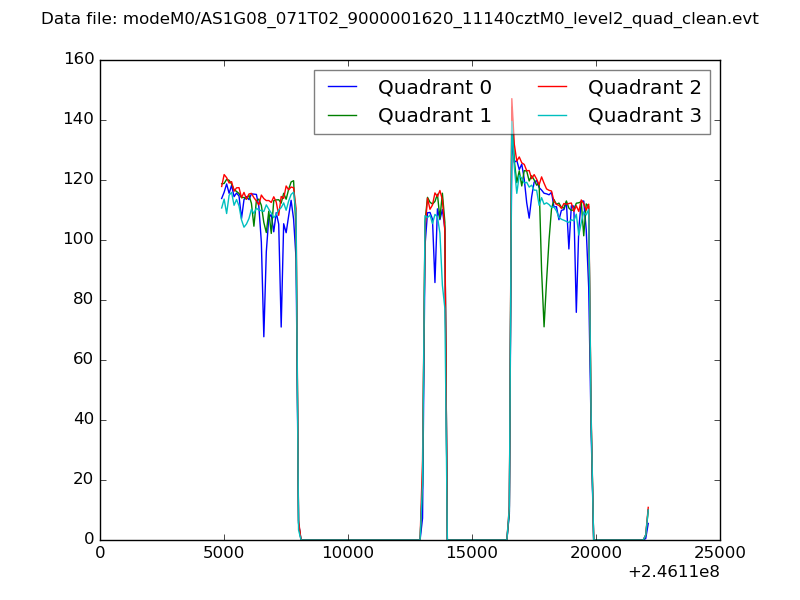
| Quadrant-wise count rates Data is divided into 100 sec bins |
 |
|
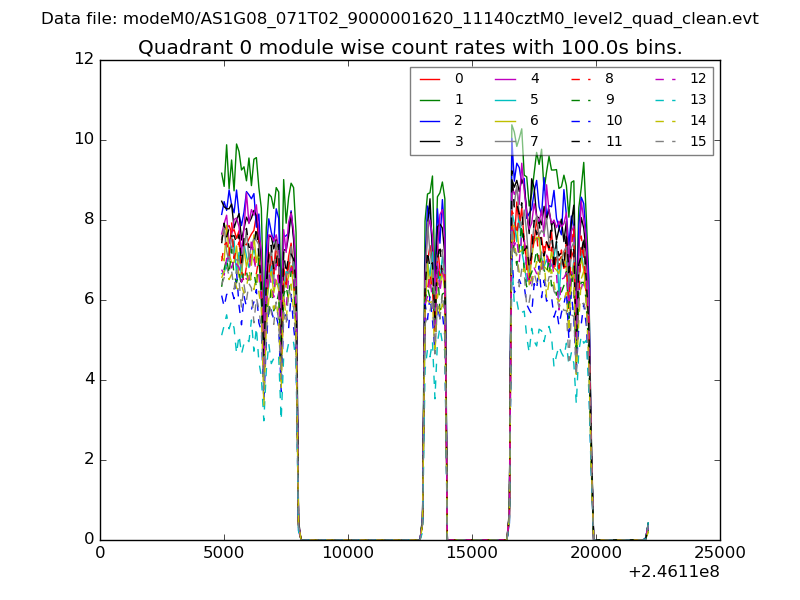
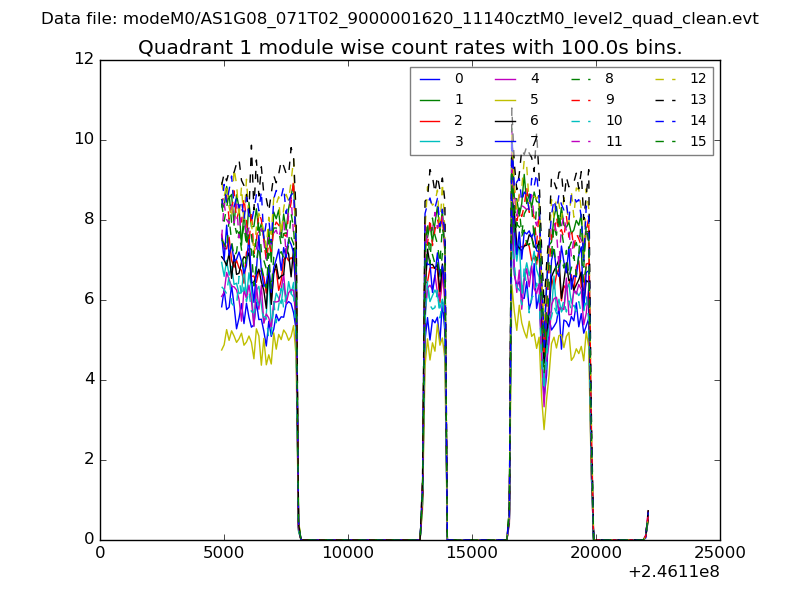
| Module-wise count rates for Quadrant A Data is divided into 100 sec bins |
 |
 |
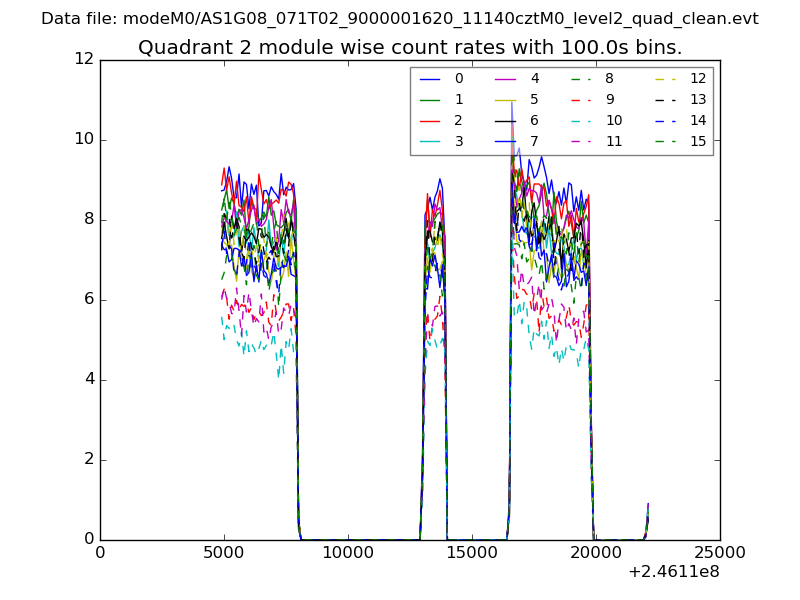
| Module-wise count rates for Quadrant B Data is divided into 100 sec bins |
 |
 |
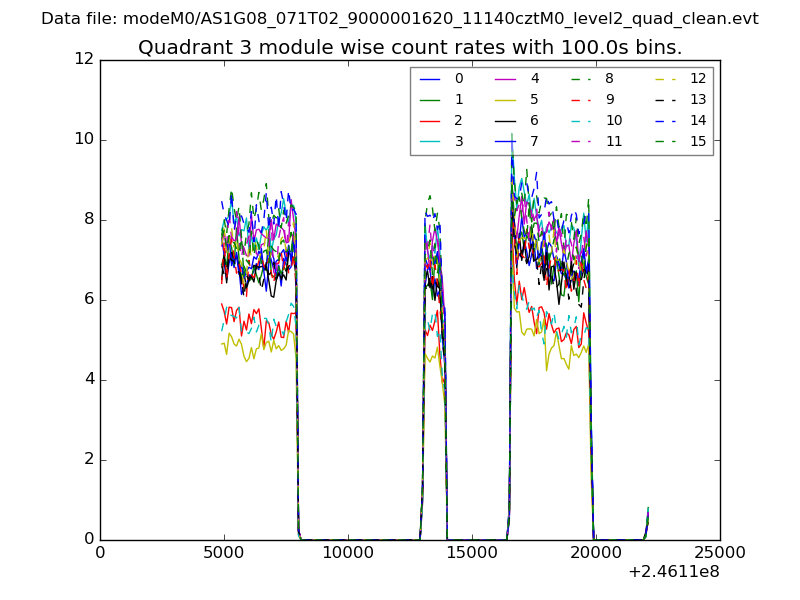
| Module-wise count rates for Quadrant C Data is divided into 100 sec bins |
 |
 |
| Module-wise count rates for Quadrant D Data is divided into 100 sec bins |
 |
 |
| Parameter | Plot |
|---|---|
| CZT HV Monitor | 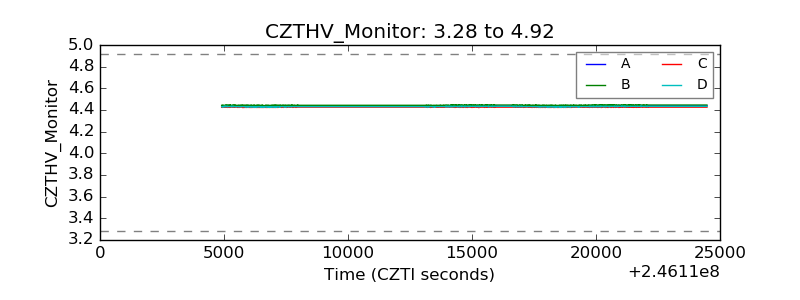 |
| D_VDD | 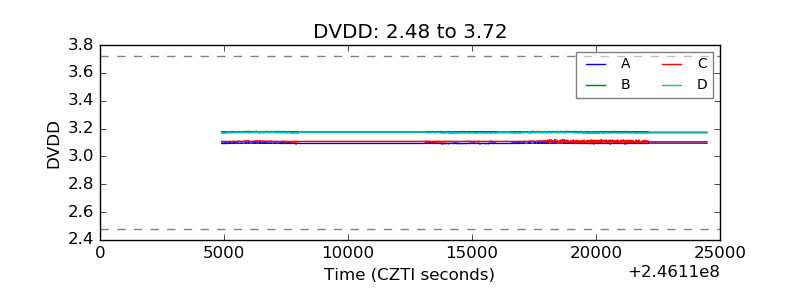 |
| Temperature 1 | 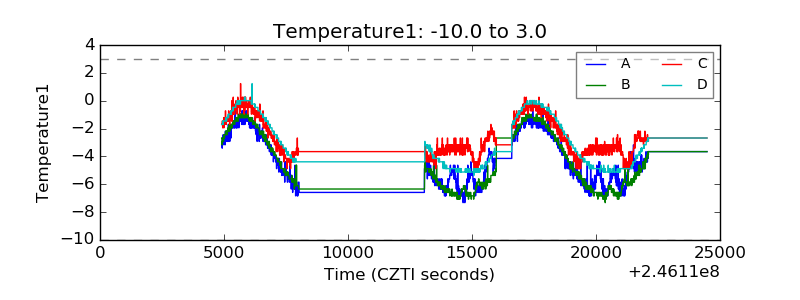 |
| Veto HV Monitor |  |
| Veto LLD | 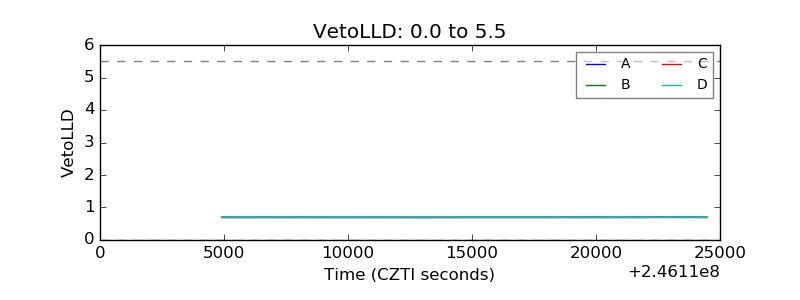 |
| Alpha Counter | 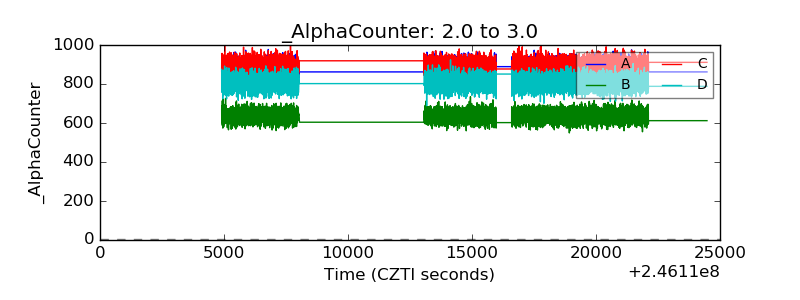 |
| _CPM_Rate | 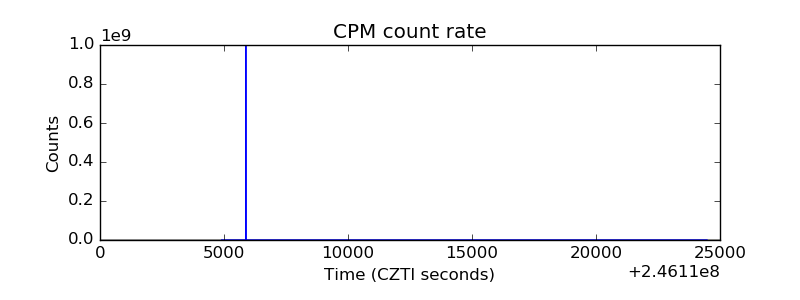 |
| CZT Counter | 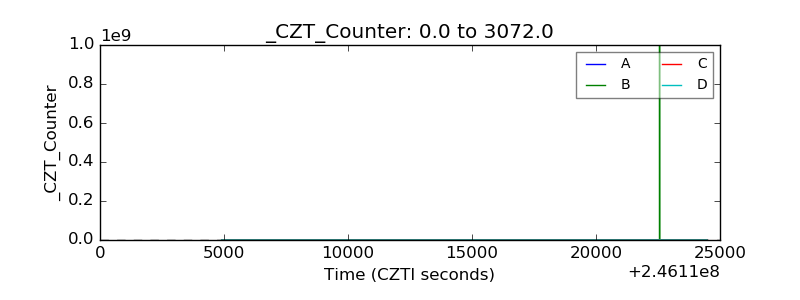 |
| +2.5 Volts monitor |  |
| +5 Volts monitor |  |
| _ROLL_ROT | 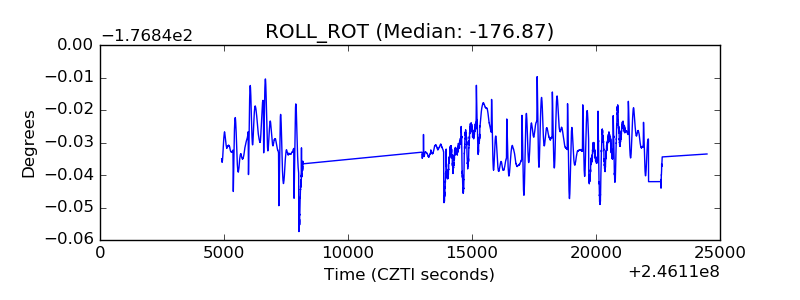 |
| _Roll_DEC |  |
| _Roll_RA | 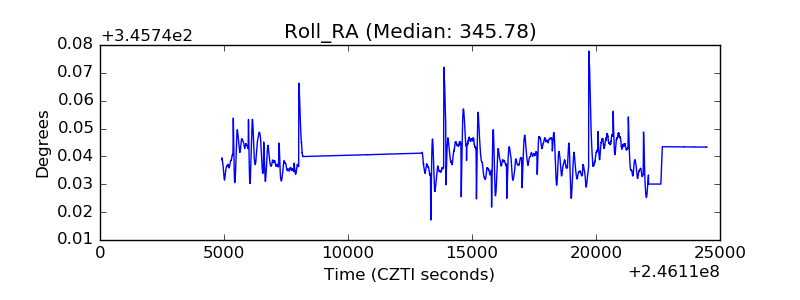 |
| Veto Counter | 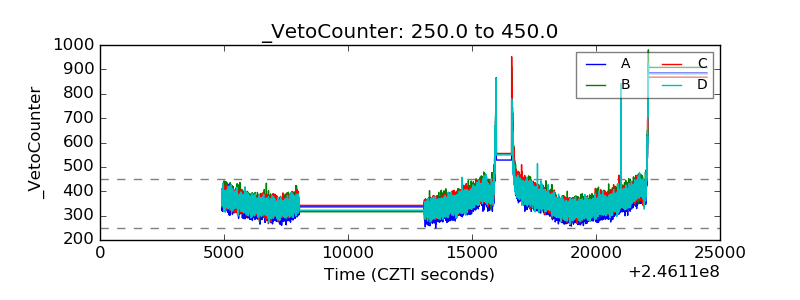 |