| Param | Original file | Final file |
|---|---|---|
| Filename | modeM0/AS1G08_071T02_9000001620_11143cztM0_level2.evt | modeM0/AS1G08_071T02_9000001620_11143cztM0_level2_quad_clean.evt |
| Size (bytes) | 1,963,186,560 | 242,824,320 |
| Size | 1.8 GB | 231.6 MB |
| Events in quadrant A | 19,477,547 | 1,443,069 |
| Events in quadrant B | 14,686,530 | 1,466,983 |
| Events in quadrant C | 9,903,795 | 1,510,152 |
| Events in quadrant D | 13,921,858 | 1,435,394 |
| Mode SS | |||
|---|---|---|---|
| Quadrant | BADHDUFLAG | Total packets | Discarded packets |
| A | 0 | 482 | 40 |
| B | 0 | 475 | 35 |
| C | 0 | 474 | 32 |
| D | 0 | 477 | 35 |
| Mode M9 | |||
|---|---|---|---|
| Quadrant | BADHDUFLAG | Total packets | Discarded packets |
| A | 0 | 38 | 3 |
| B | 0 | 40 | 5 |
| C | 0 | 39 | 5 |
| D | 0 | 39 | 4 |
| Mode M0 | |||
|---|---|---|---|
| Quadrant | BADHDUFLAG | Total packets | Discarded packets |
| A | 0 | 77577 | 5061 |
| B | 0 | 61793 | 3905 |
| C | 0 | 48087 | 3314 |
| D | 0 | 61512 | 5427 |
| Quadrant | Total seconds | Saturated seconds | Saturation percentage |
|---|---|---|---|
| A | 21749 | 2480 | 11.402823% |
| B | 21770 | 1209 | 5.553514% |
| C | 21770 | 125 | 0.574185% |
| D | 21726 | 951 | 4.377244% |
Noise dominated data is calculated using 1-second bins in cleaned event files. If a bin has >2000 counts, and if more than 50% of those come from <1% of pixels, then it is considered to be noise-dominated and hence unusable.
| Quadrant | # 1 sec bins | Bins with >0 counts | Bins with >2000 counts | High rate bins dominated by noise | Noise dominated (total time) | Noise dominated (detector-on time) | Marked lightcurve |
|---|---|---|---|---|---|---|---|
| A | 32044 | 21827 | 1831 | 1831 | 5.71% | 8.39% | 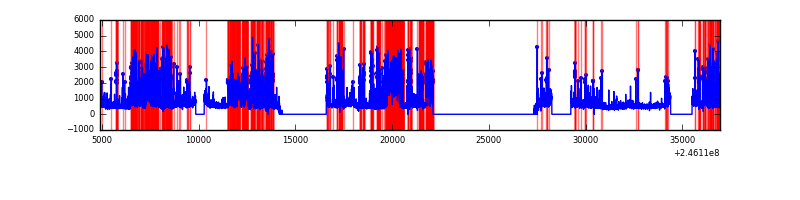 |
| B | 32045 | 21848 | 670 | 670 | 2.09% | 3.07% | 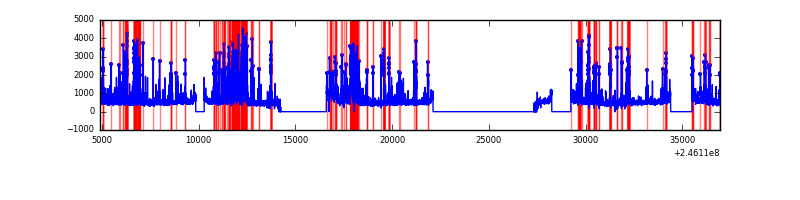 |
| C | 32045 | 21836 | 16 | 16 | 0.05% | 0.07% |  |
| D | 32045 | 21791 | 710 | 710 | 2.22% | 3.26% | 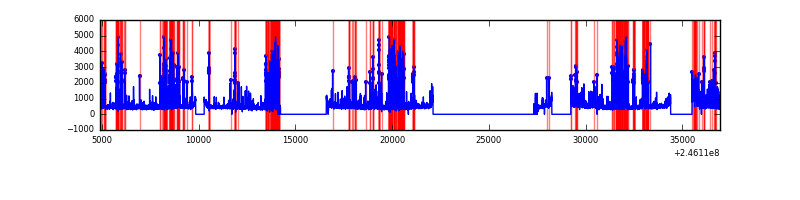 |
Top three noisy pixels from each quadrant. If the there are fewer than three noisy pixels in the level2.evt file, extra rows are filled as -1
| Pixel properties | Quadrant properties | ||||||
|---|---|---|---|---|---|---|---|
| Quadrant | DetID | PixID | Counts | Sigma | Mean | Median | Sigma |
| A | 8 | 5 | 5663934 | 11270.97 | 2483 | 2430 | 502.3 |
| A | 14 | 238 | 2726453 | 5423.01 | 2483 | 2430 | 502.3 |
| A | 8 | 15 | 781868 | 1551.71 | 2483 | 2430 | 502.3 |
| B | 4 | 239 | 2667517 | 5494.59 | 2544 | 2478 | 485.0 |
| B | 10 | 16 | 1012691 | 2082.79 | 2544 | 2478 | 485.0 |
| B | 15 | 204 | 398649 | 816.8 | 2544 | 2478 | 485.0 |
| C | 5 | 128 | 89024 | 148.67 | 2500 | 2518 | 581.9 |
| C | 9 | 204 | 28528 | 44.7 | 2500 | 2518 | 581.9 |
| C | 9 | 54 | 19838 | 29.77 | 2500 | 2518 | 581.9 |
| D | 10 | 253 | 2096564 | 3515.63 | 2458 | 2387 | 595.7 |
| D | 2 | 14 | 636738 | 1064.93 | 2458 | 2387 | 595.7 |
| D | 10 | 157 | 438521 | 732.17 | 2458 | 2387 | 595.7 |
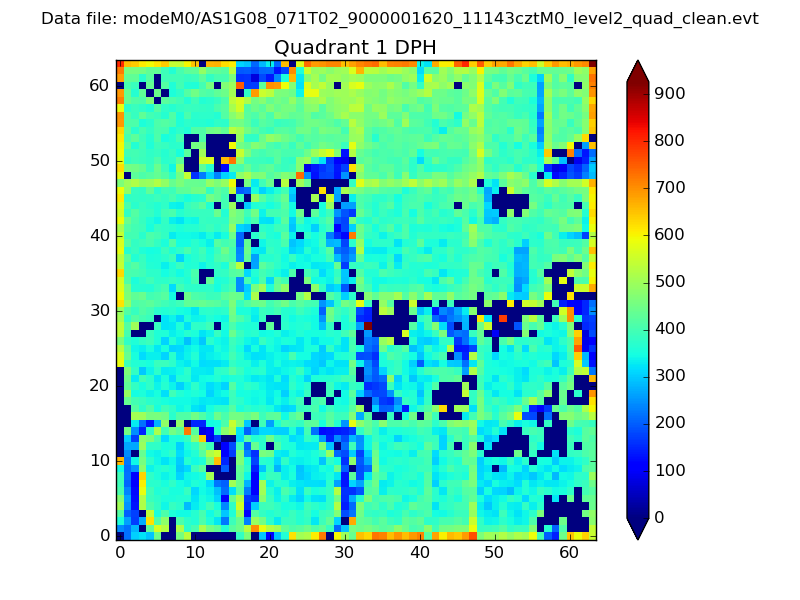
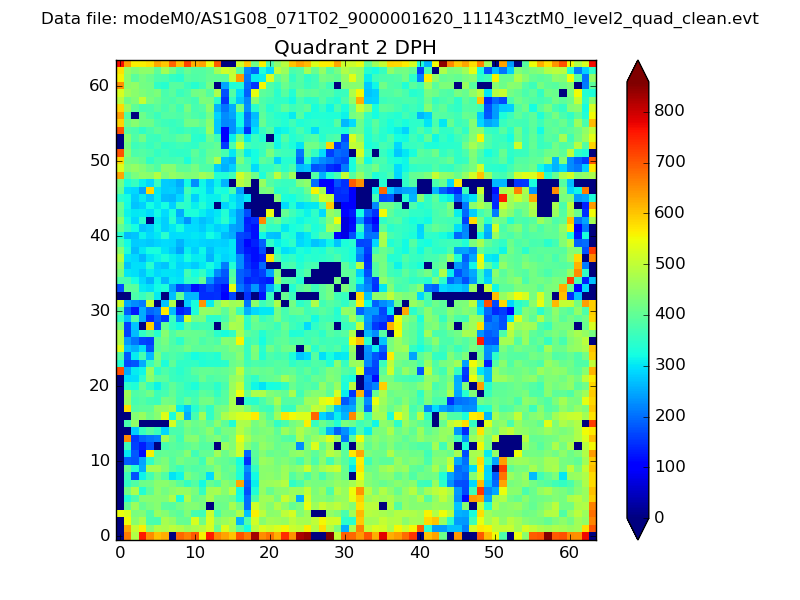
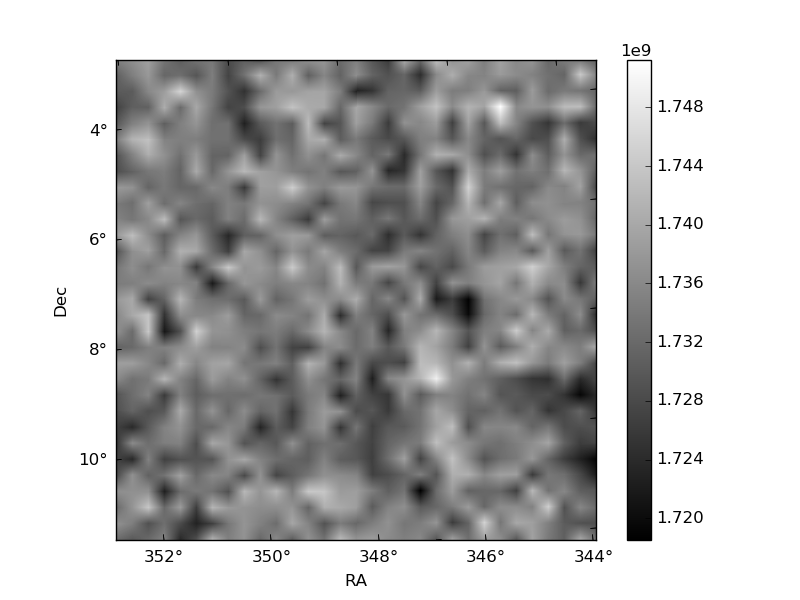
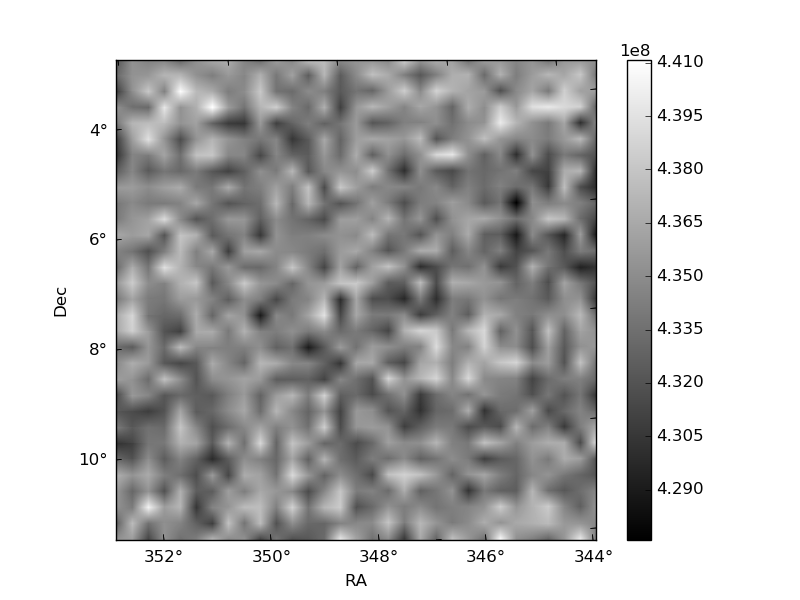
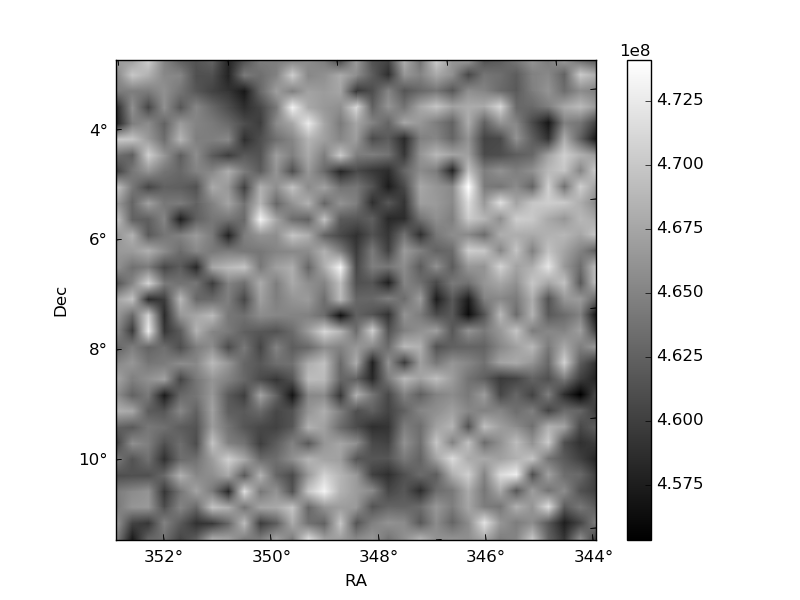
Histogram calculated using DETX and DETY for each event in the final _common_clean file
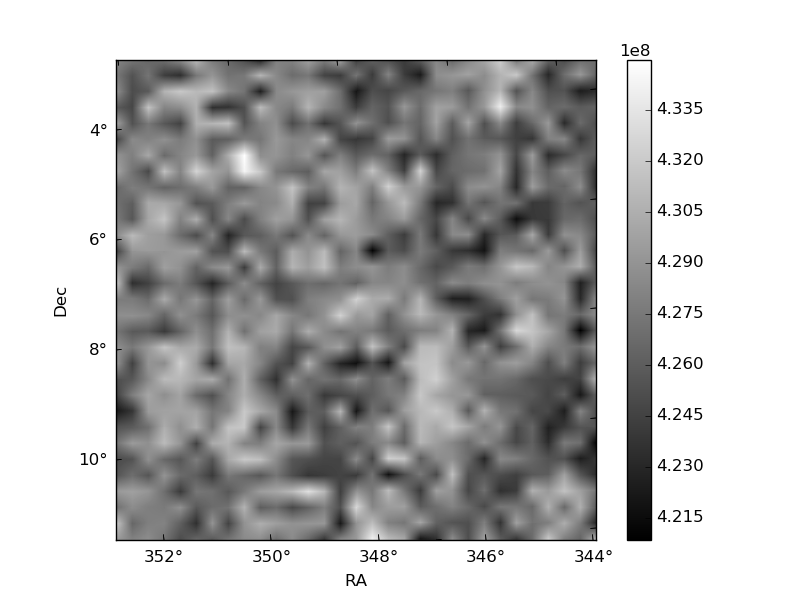
| Quadrant A | 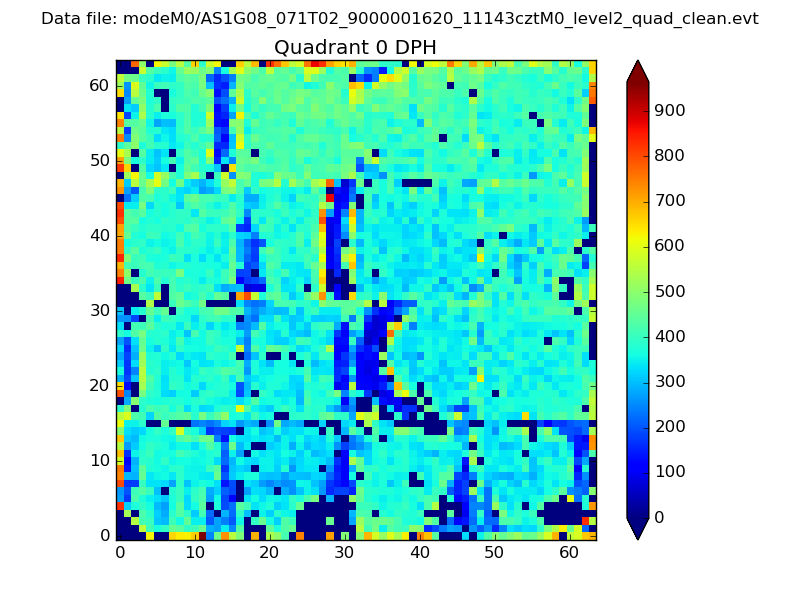 |
 |
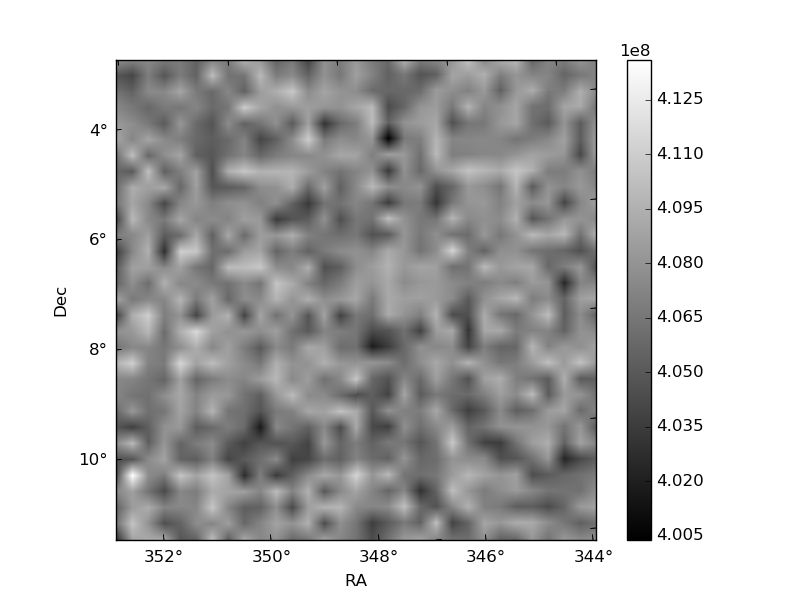
Quadrant B |
|---|---|---|---|
| Quadrant D | 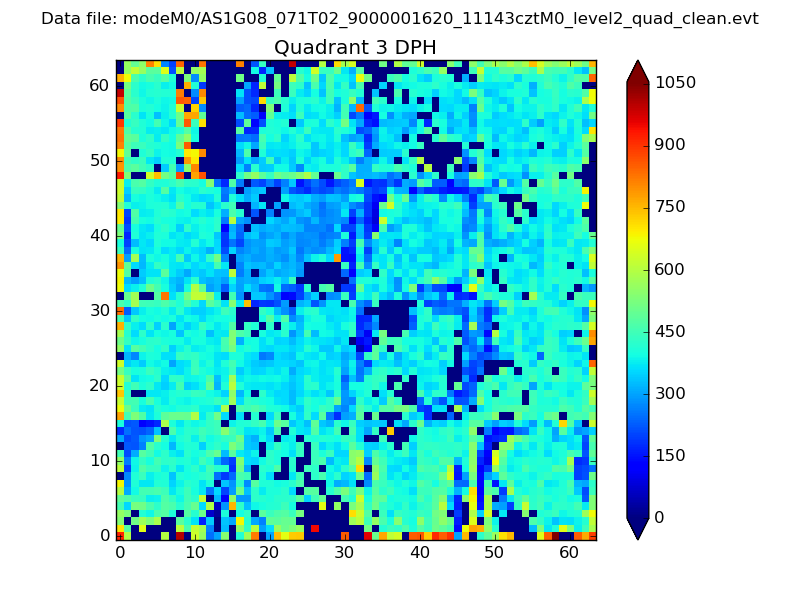 |
 |
Quadrant C |
| Plot type | Count rate plots | Images |
|---|---|---|
| Comparison with Poisson distribution Blue bars denote a histogram of data divided into 1 sec bins. Red curve is a Poisson curve with rate = median count rate of data. |
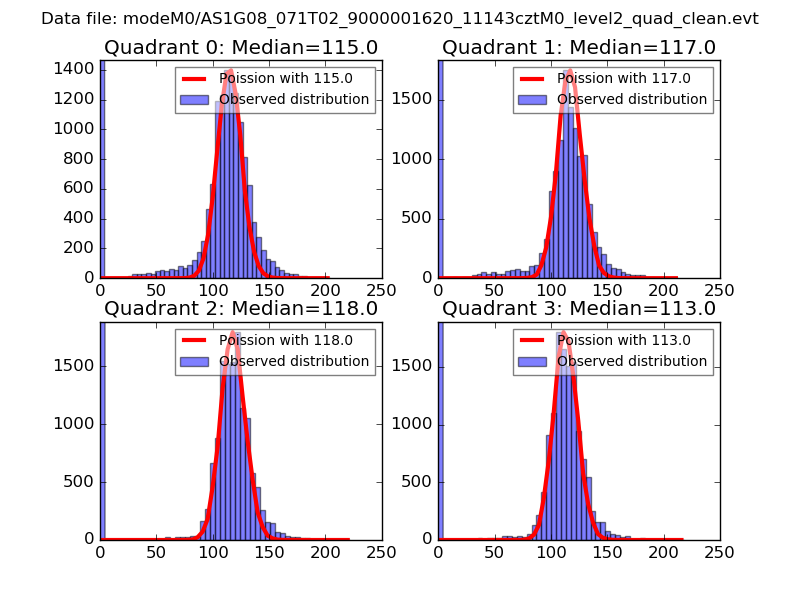 |
 |
| Quadrant-wise count rates Data is divided into 100 sec bins |
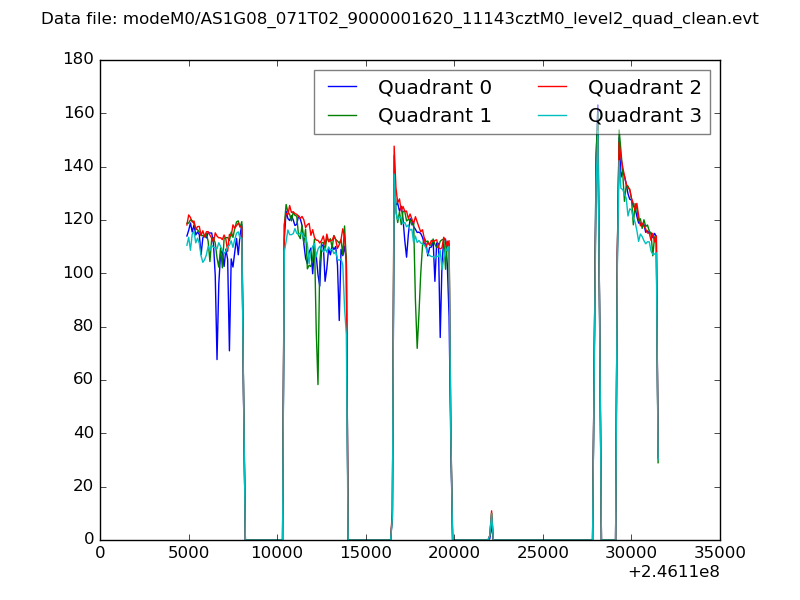 |
|
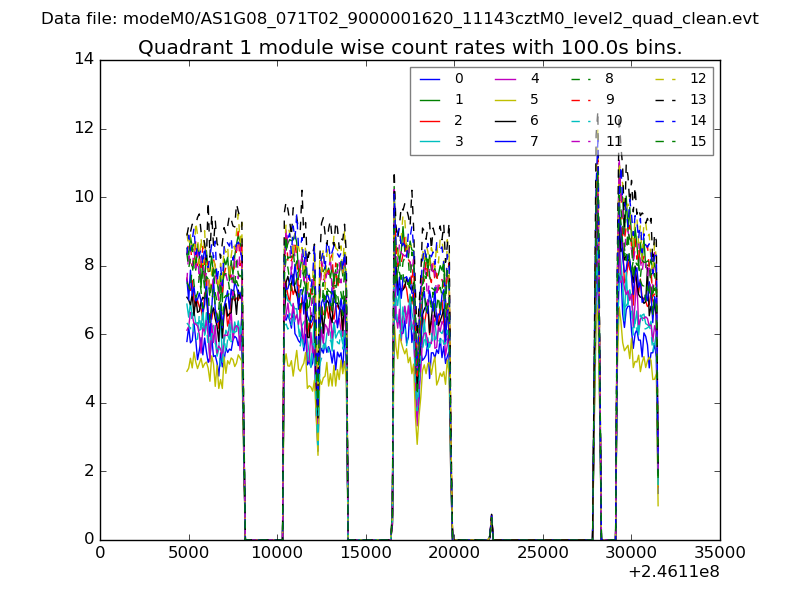
| Module-wise count rates for Quadrant A Data is divided into 100 sec bins |
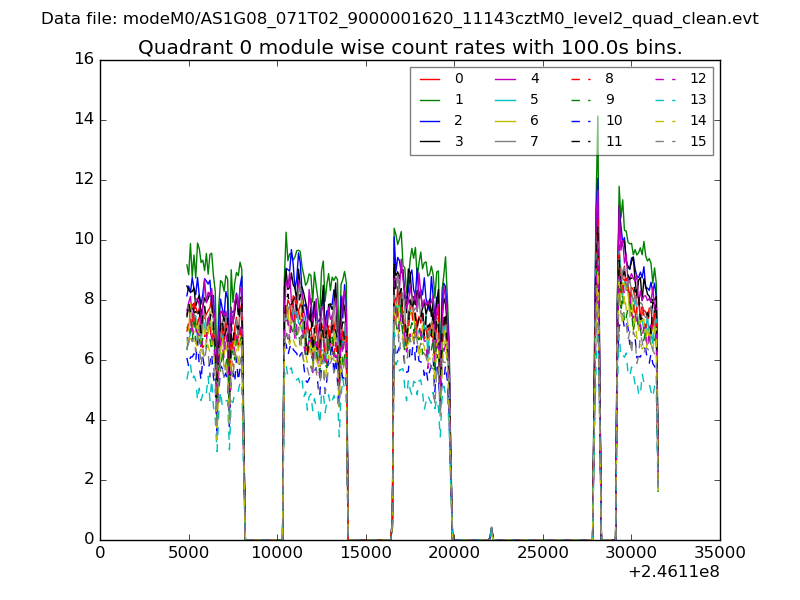 |
 |
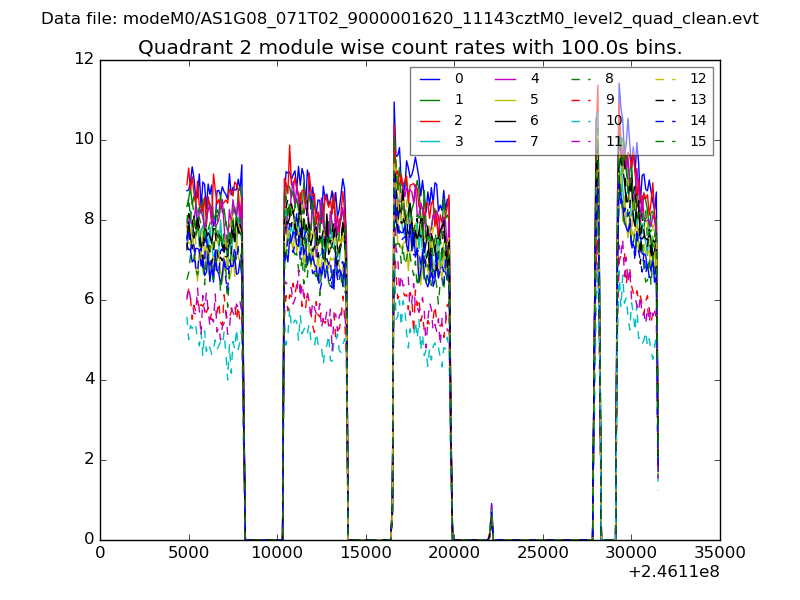
| Module-wise count rates for Quadrant B Data is divided into 100 sec bins |
 |
 |
| Module-wise count rates for Quadrant C Data is divided into 100 sec bins |
 |
 |
| Module-wise count rates for Quadrant D Data is divided into 100 sec bins |
 |
 |
| Parameter | Plot |
|---|---|
| CZT HV Monitor | 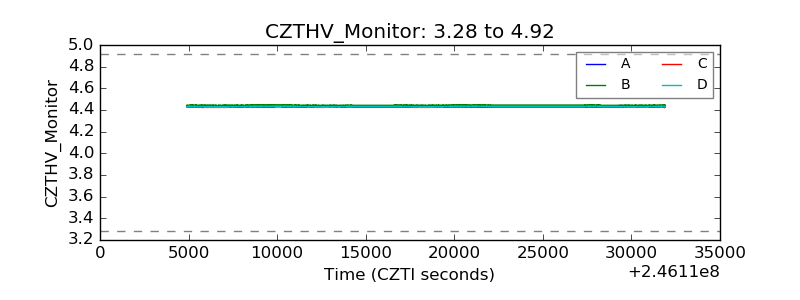 |
| D_VDD | 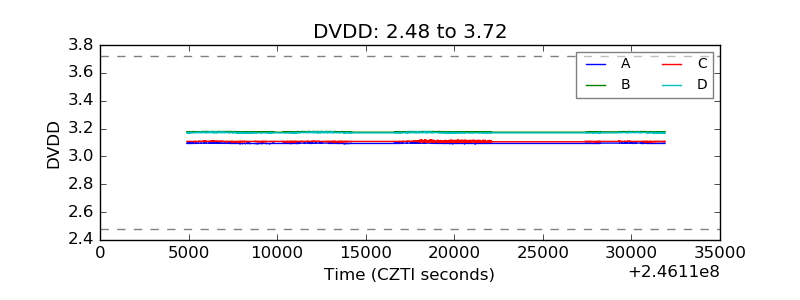 |
| Temperature 1 | 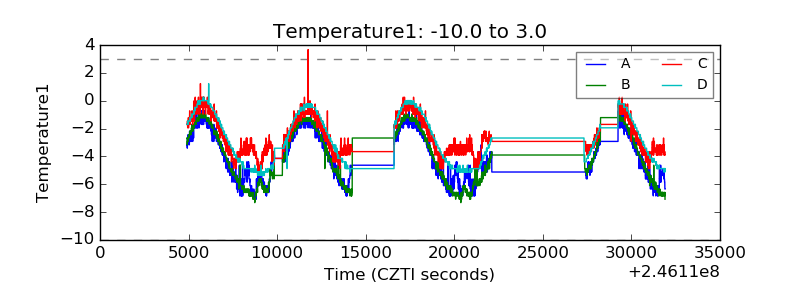 |
| Veto HV Monitor | 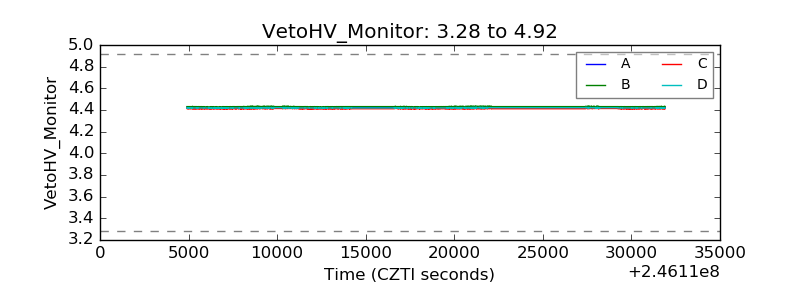 |
| Veto LLD | 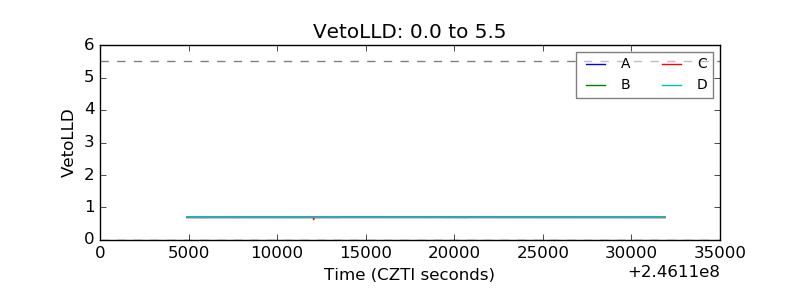 |
| Alpha Counter | 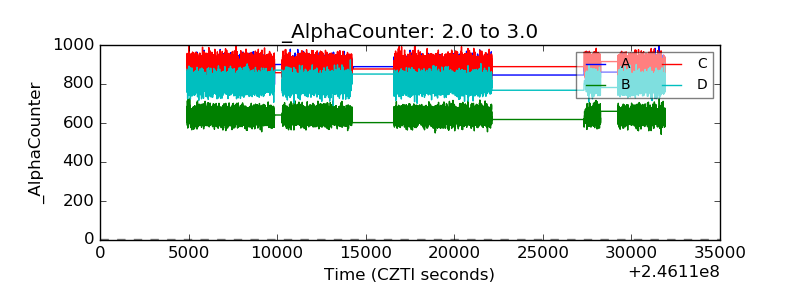 |
| _CPM_Rate | 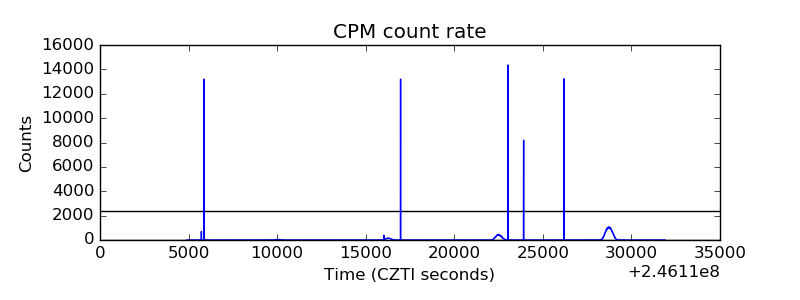 |
| CZT Counter |  |
| +2.5 Volts monitor | 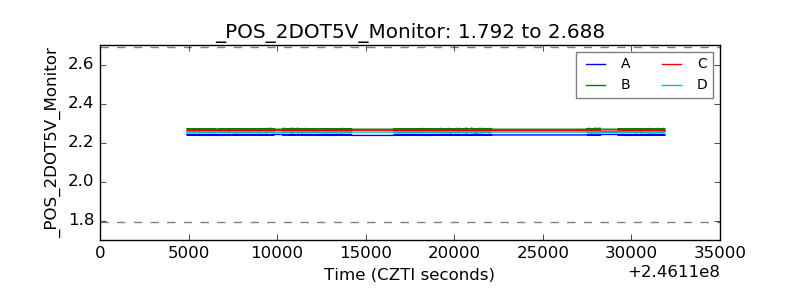 |
| +5 Volts monitor |  |
| _ROLL_ROT | 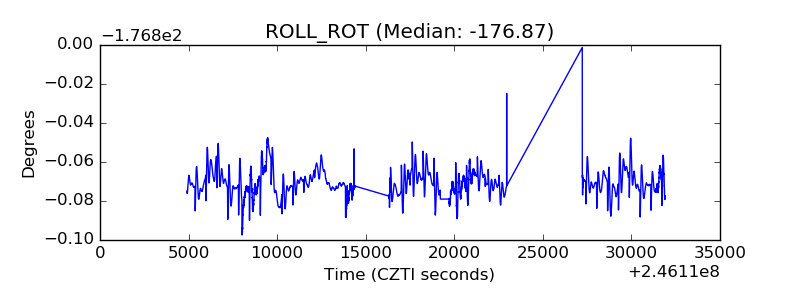 |
| _Roll_DEC | 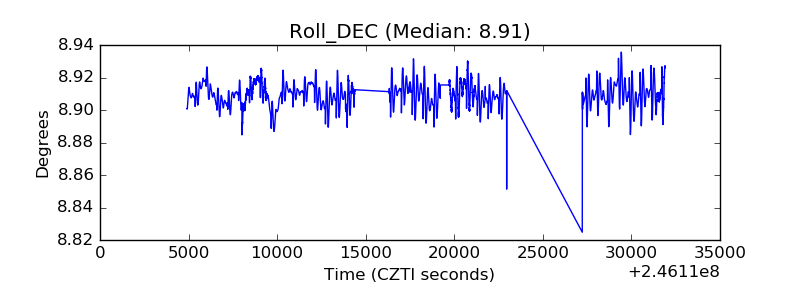 |
| _Roll_RA | 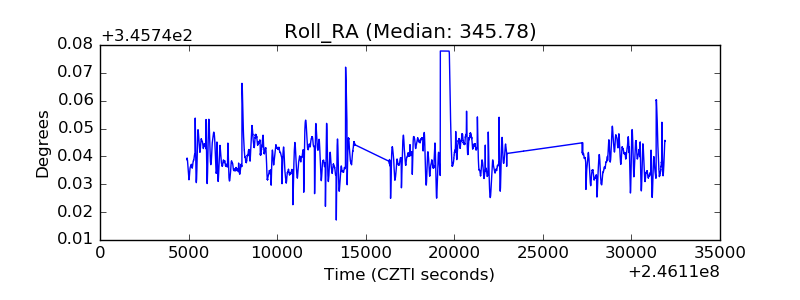 |
| Veto Counter | 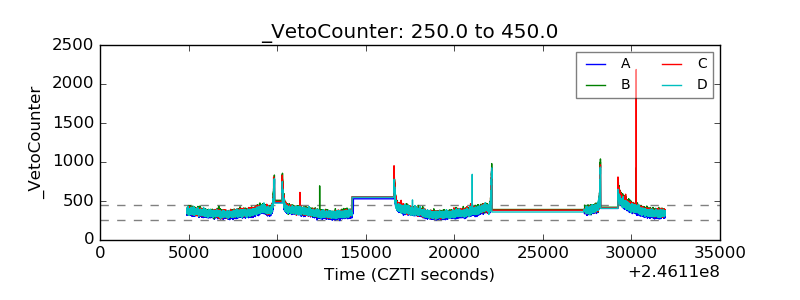 |