| Param | Original file | Final file |
|---|---|---|
| Filename | modeM0/AS1G08_071T02_9000001620_11144cztM0_level2.evt | modeM0/AS1G08_071T02_9000001620_11144cztM0_level2_quad_clean.evt |
| Size (bytes) | 63,397,440 | 12,605,760 |
| Size | 60.5 MB | 12.0 MB |
| Events in quadrant A | 679,486 | 77,719 |
| Events in quadrant B | 400,559 | 85,424 |
| Events in quadrant C | 313,132 | 83,463 |
| Events in quadrant D | 477,352 | 79,296 |
| Mode SS | |||
|---|---|---|---|
| Quadrant | BADHDUFLAG | Total packets | Discarded packets |
| A | 0 | 22 | 8 |
| B | 0 | 23 | 9 |
| C | 0 | 23 | 9 |
| D | 0 | 23 | 7 |
| Mode M9 | |||
|---|---|---|---|
| Quadrant | BADHDUFLAG | Total packets | Discarded packets |
| A | 0 | 8 | 6 |
| B | 0 | 10 | 7 |
| C | 0 | 7 | 4 |
| D | 0 | 8 | 5 |
| Mode M0 | |||
|---|---|---|---|
| Quadrant | BADHDUFLAG | Total packets | Discarded packets |
| A | 0 | 3901 | 1420 |
| B | 0 | 2662 | 1043 |
| C | 0 | 2230 | 831 |
| D | 0 | 2825 | 947 |
| Quadrant | Total seconds | Saturated seconds | Saturation percentage |
|---|---|---|---|
| A | 663 | 77 | 11.613876% |
| B | 686 | 21 | 3.061224% |
| C | 679 | 5 | 0.736377% |
| D | 689 | 18 | 2.612482% |
Noise dominated data is calculated using 1-second bins in cleaned event files. If a bin has >2000 counts, and if more than 50% of those come from <1% of pixels, then it is considered to be noise-dominated and hence unusable.
| Quadrant | # 1 sec bins | Bins with >0 counts | Bins with >2000 counts | High rate bins dominated by noise | Noise dominated (total time) | Noise dominated (detector-on time) | Marked lightcurve |
|---|---|---|---|---|---|---|---|
| A | 2676 | 710 | 53 | 53 | 1.98% | 7.46% | 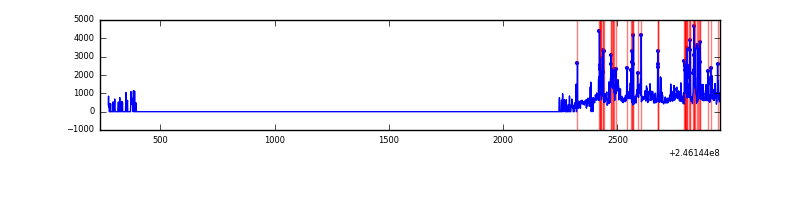 |
| B | 2699 | 738 | 5 | 5 | 0.19% | 0.68% | 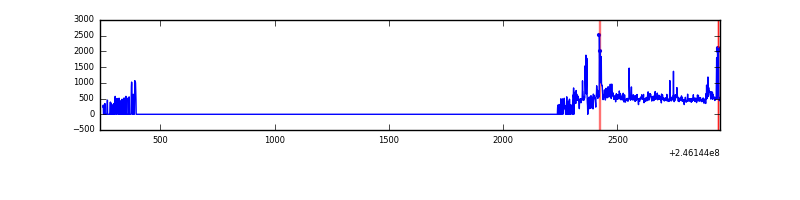 |
| C | 2713 | 734 | 0 | 0 | 0.00% | 0.00% |  |
| D | 2682 | 748 | 9 | 9 | 0.34% | 1.20% | 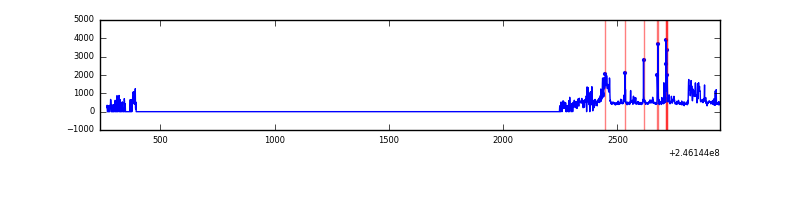 |
Top three noisy pixels from each quadrant. If the there are fewer than three noisy pixels in the level2.evt file, extra rows are filled as -1
| Pixel properties | Quadrant properties | ||||||
|---|---|---|---|---|---|---|---|
| Quadrant | DetID | PixID | Counts | Sigma | Mean | Median | Sigma |
| A | 14 | 238 | 209099 | 11945.28 | 75 | 73 | 17.5 |
| A | 8 | 5 | 170896 | 9762.08 | 75 | 73 | 17.5 |
| A | 11 | 29 | 5470 | 308.42 | 75 | 73 | 17.5 |
| B | 4 | 239 | 26004 | 1433.01 | 82 | 80 | 18.1 |
| B | 15 | 204 | 22949 | 1264.13 | 82 | 80 | 18.1 |
| B | 10 | 16 | 20534 | 1130.64 | 82 | 80 | 18.1 |
| C | 9 | 204 | 6693 | 328.02 | 78 | 78 | 20.2 |
| C | 13 | 61 | 581 | 24.94 | 78 | 78 | 20.2 |
| C | 3 | 202 | 189 | 5.5 | 78 | 78 | 20.2 |
| D | 1 | 52 | 56123 | 2675.65 | 78 | 76 | 20.9 |
| D | 10 | 199 | 48980 | 2334.65 | 78 | 76 | 20.9 |
| D | 13 | 104 | 21494 | 1022.48 | 78 | 76 | 20.9 |
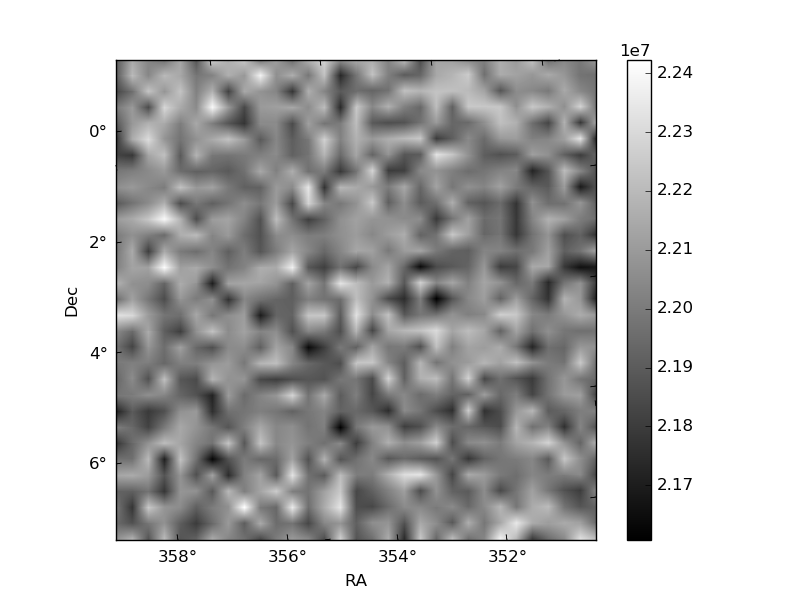
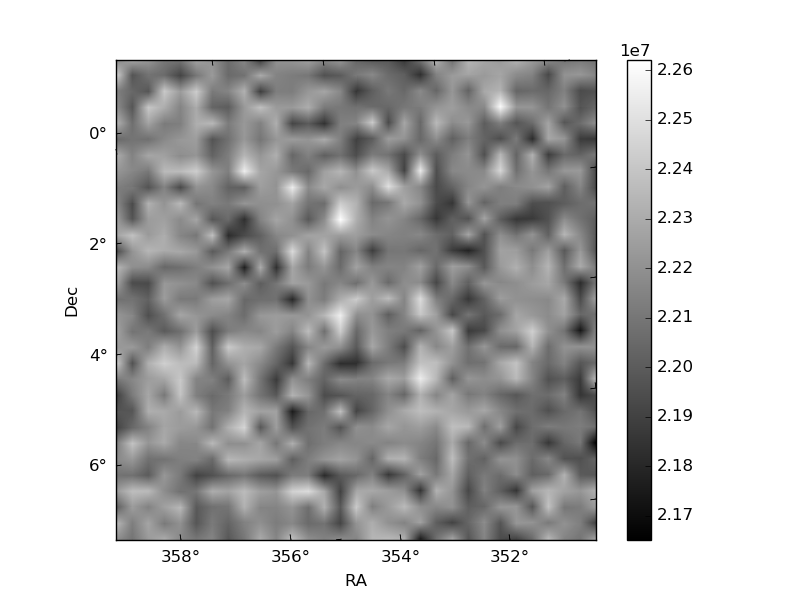
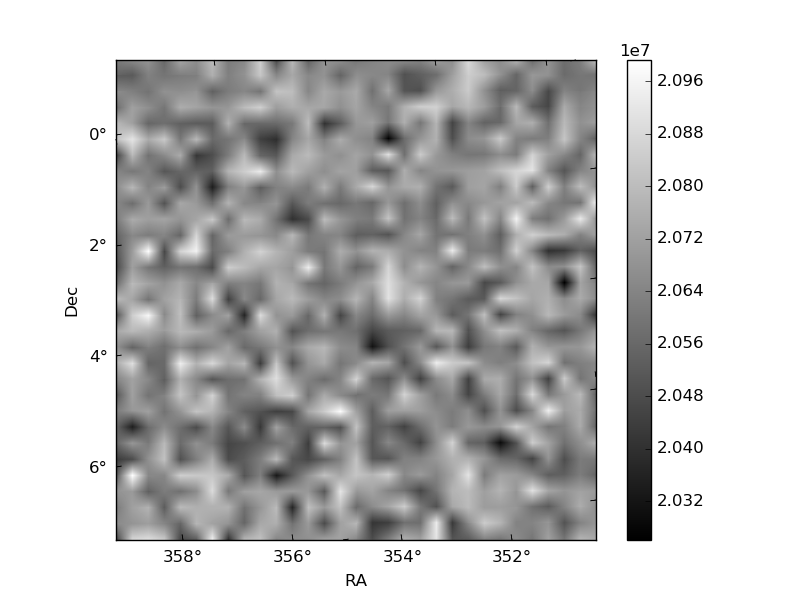
Histogram calculated using DETX and DETY for each event in the final _common_clean file
| Quadrant A | 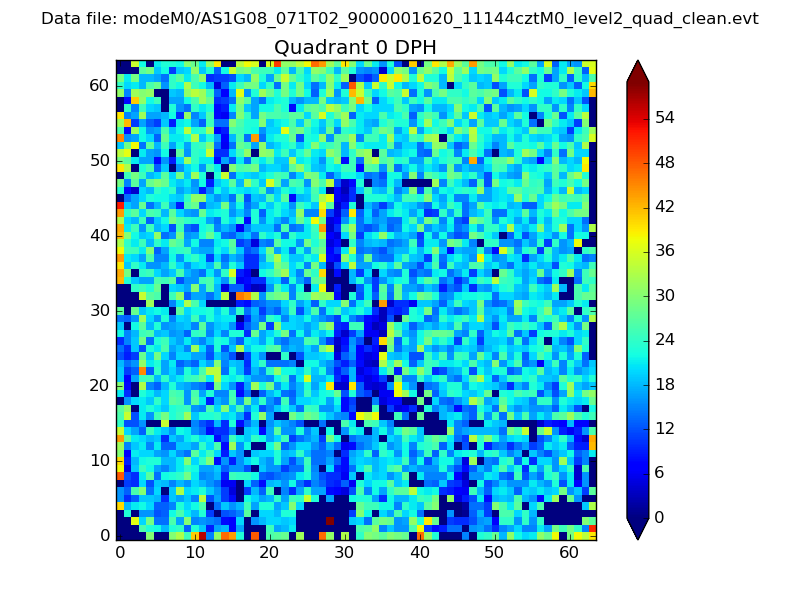 |
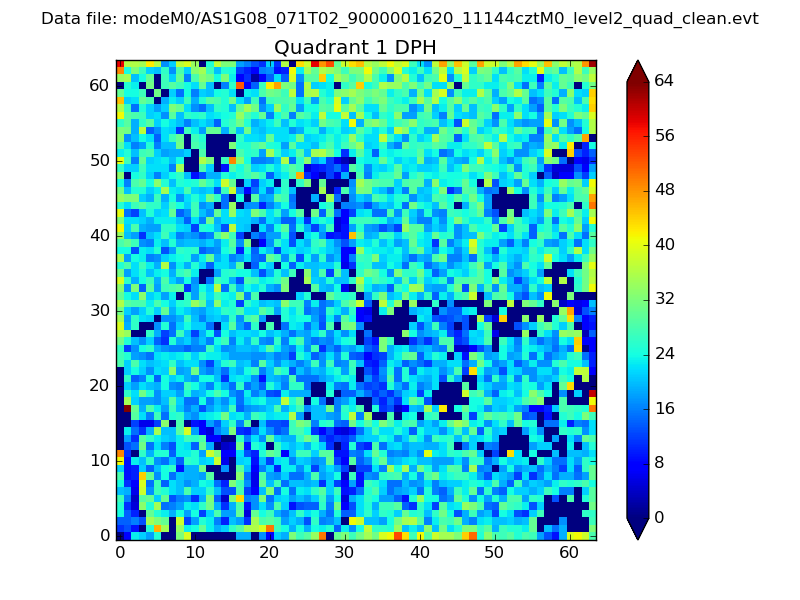 |
Quadrant B |
|---|---|---|---|
| Quadrant D | 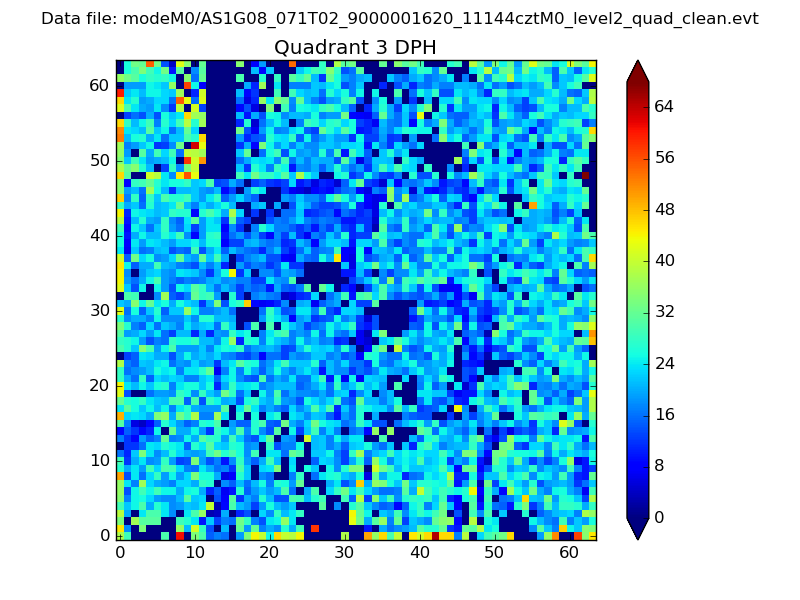 |
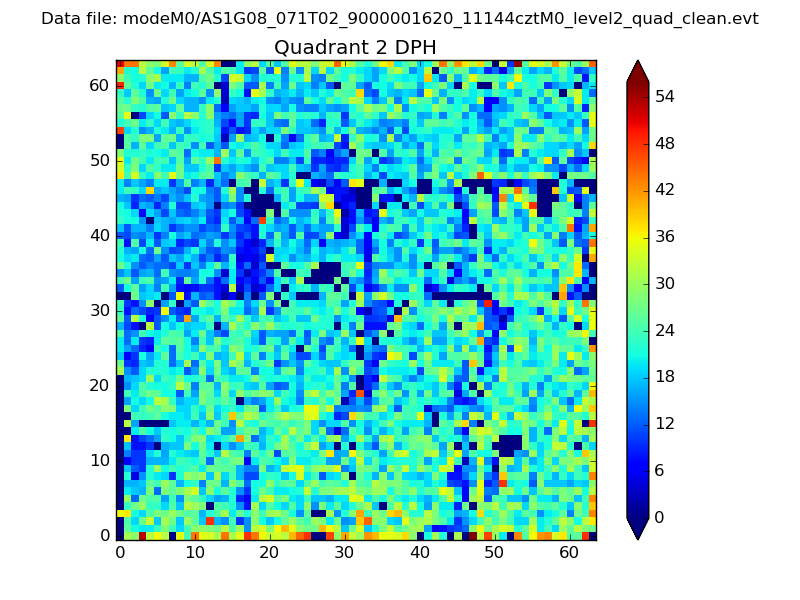 |
Quadrant C |
| Plot type | Count rate plots | Images |
|---|---|---|
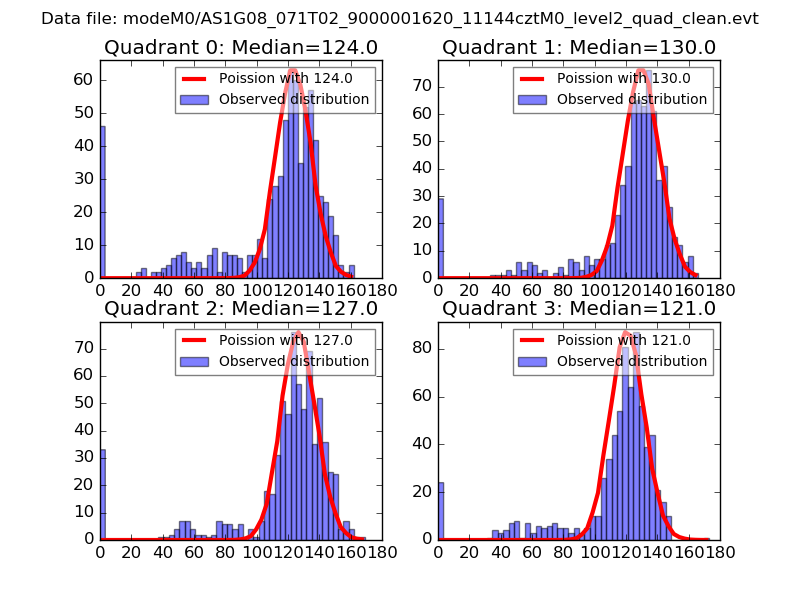
| Comparison with Poisson distribution Blue bars denote a histogram of data divided into 1 sec bins. Red curve is a Poisson curve with rate = median count rate of data. |
 |
 |
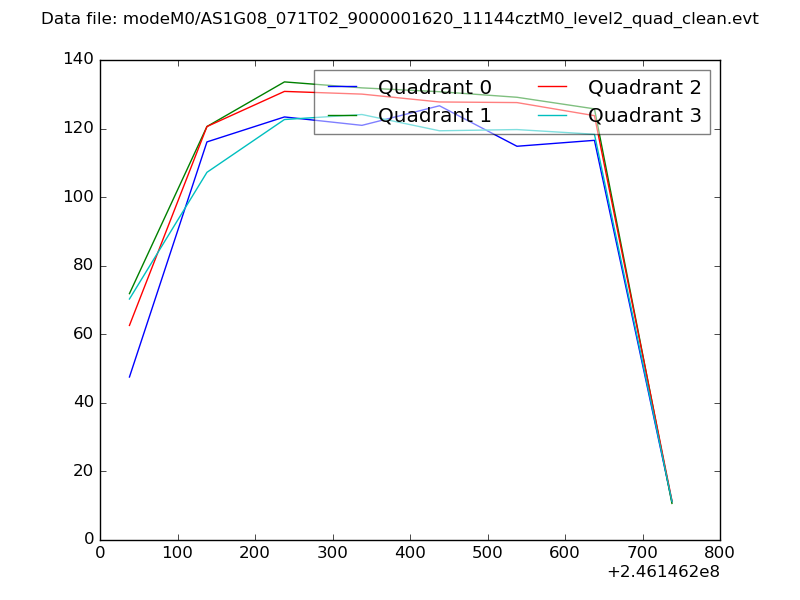
| Quadrant-wise count rates Data is divided into 100 sec bins |
 |
|
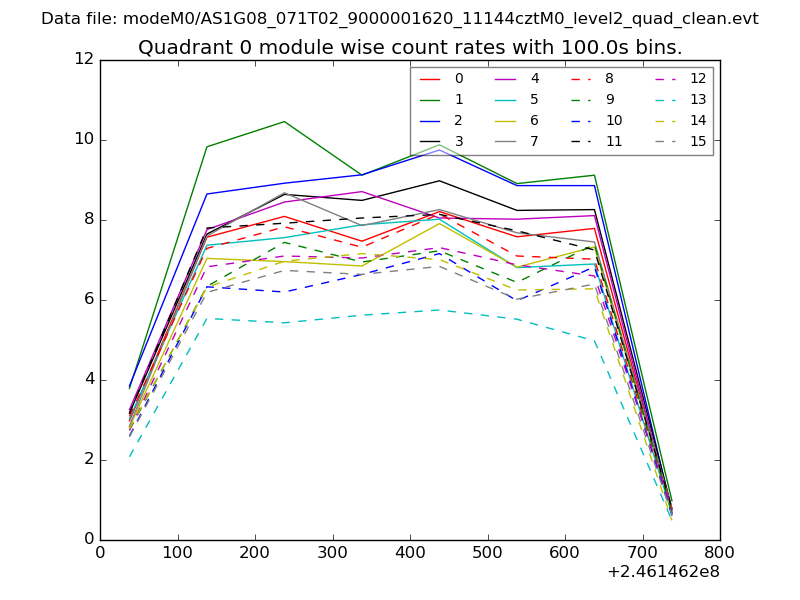
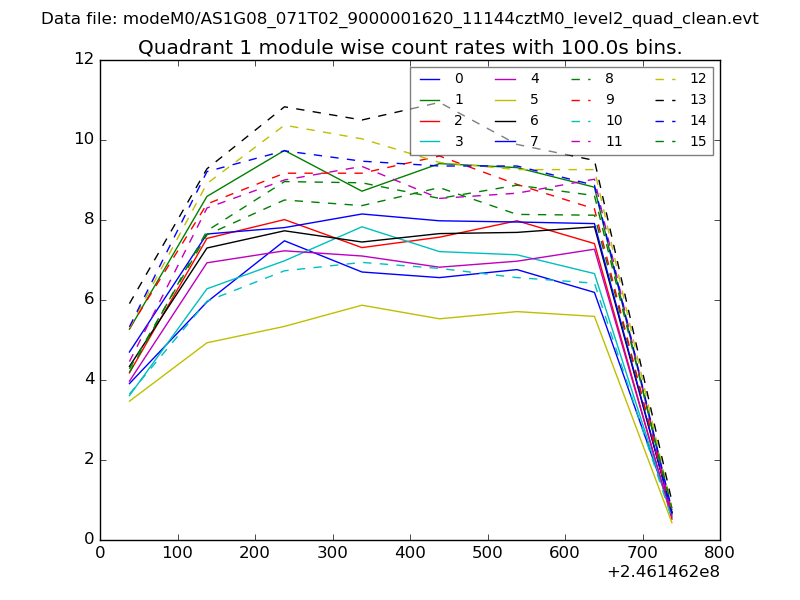
| Module-wise count rates for Quadrant A Data is divided into 100 sec bins |
 |
 |
| Module-wise count rates for Quadrant B Data is divided into 100 sec bins |
 |
 |
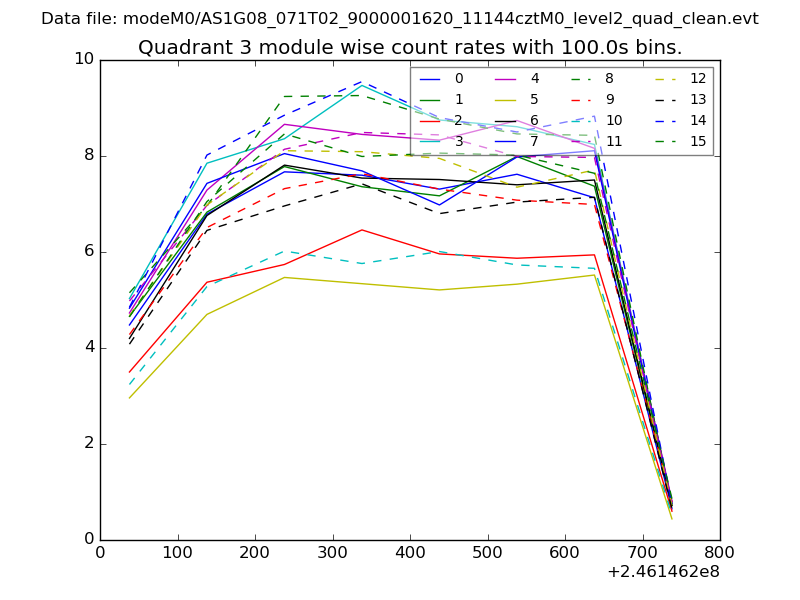
| Module-wise count rates for Quadrant C Data is divided into 100 sec bins |
 |
 |
| Module-wise count rates for Quadrant D Data is divided into 100 sec bins |
 |
 |
| Parameter | Plot |
|---|---|
| CZT HV Monitor | 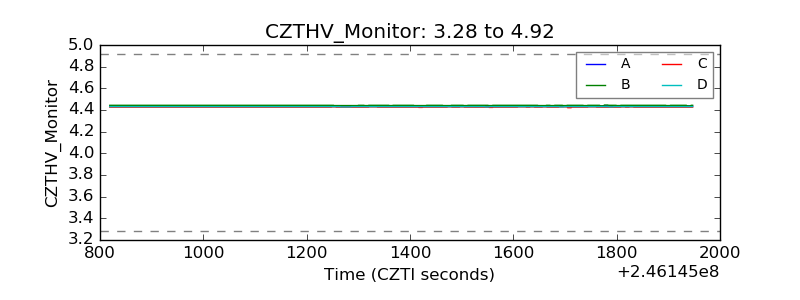 |
| D_VDD | 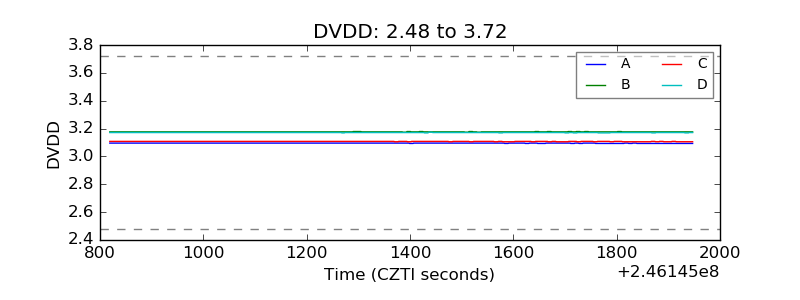 |
| Temperature 1 |  |
| Veto HV Monitor | 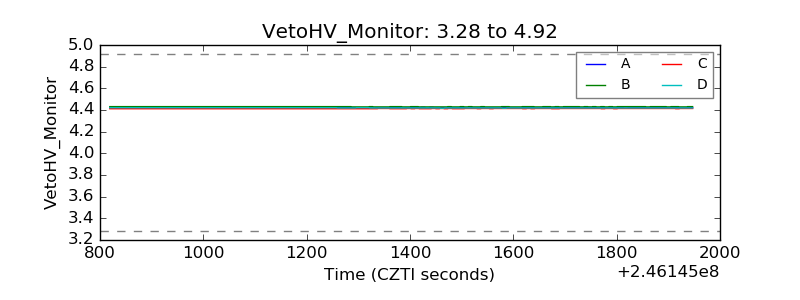 |
| Veto LLD | 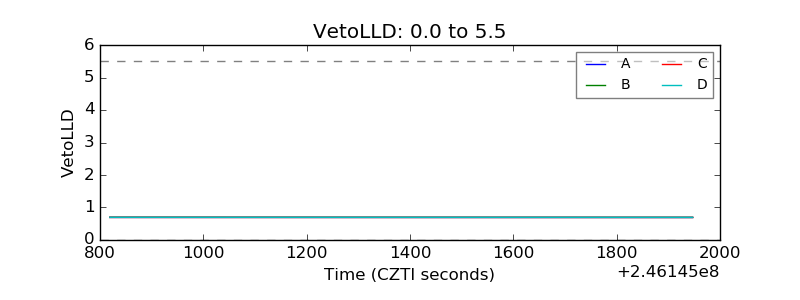 |
| Alpha Counter | 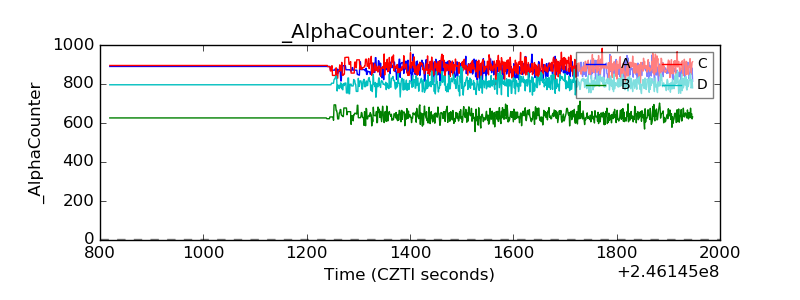 |
| _CPM_Rate | 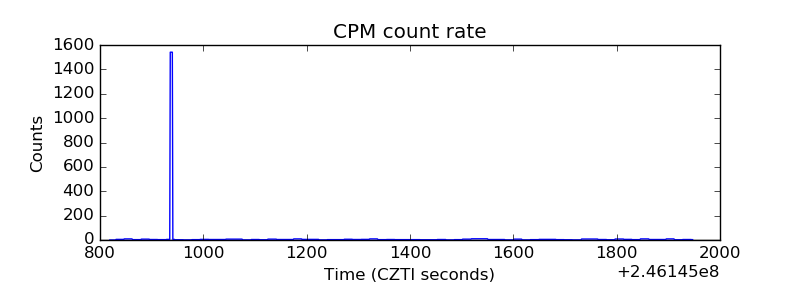 |
| CZT Counter | 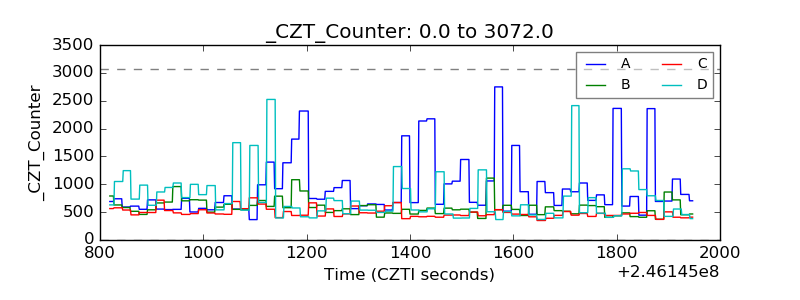 |
| +2.5 Volts monitor |  |
| +5 Volts monitor | 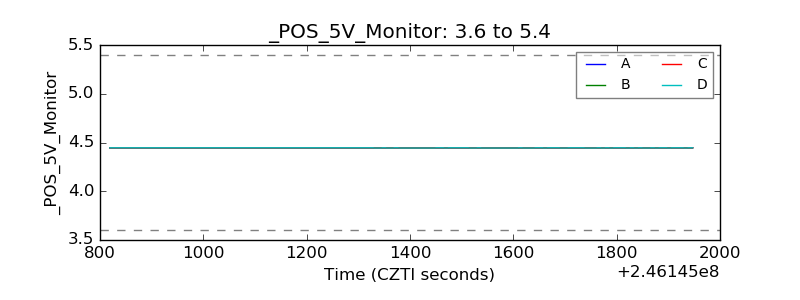 |
| _ROLL_ROT |  |
| _Roll_DEC | 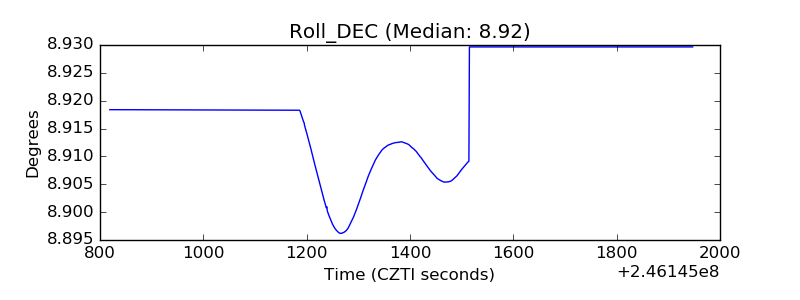 |
| _Roll_RA | 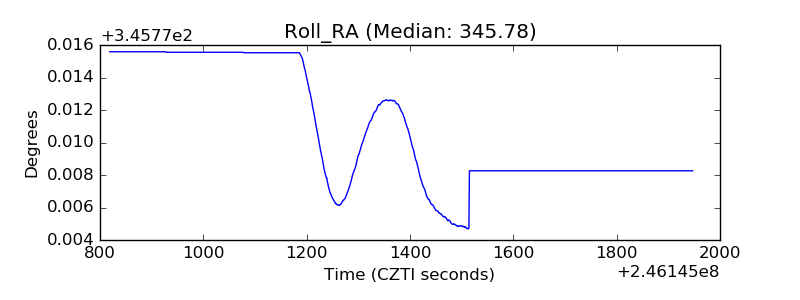 |
| Veto Counter |  |