| Param | Original file | Final file |
|---|---|---|
| Filename | modeM0/AS1A04_180T01_9000001622cztM0_level2.fits | modeM0/AS1A04_180T01_9000001622cztM0_level2_quad_clean.evt |
| Size (bytes) | 346,181,760 | 323,976,960 |
| Size | 330.1 MB | 309.0 MB |
| Events in quadrant A | 2,043,294 | 1,815,644 |
| Events in quadrant B | 2,064,470 | 1,937,988 |
| Events in quadrant C | 2,118,824 | 1,898,985 |
| Events in quadrant D | 1,782,204 | 1,686,073 |
| Mode M0 | |||
|---|---|---|---|
| Quadrant | BADHDUFLAG | Total packets | Discarded packets |
| A | 0 | 122079 | 0 |
| B | 0 | 95134 | 0 |
| C | 0 | 75066 | 0 |
| D | 0 | 96655 | 0 |
| Mode M9 | |||
|---|---|---|---|
| Quadrant | BADHDUFLAG | Total packets | Discarded packets |
| A | 0 | 66 | 0 |
| B | 0 | 66 | 0 |
| C | 0 | 66 | 0 |
| D | 0 | 66 | 0 |
| Mode SS | |||
|---|---|---|---|
| Quadrant | BADHDUFLAG | Total packets | Discarded packets |
| A | 0 | 734 | 0 |
| B | 0 | 732 | 0 |
| C | 0 | 728 | 0 |
| D | 0 | 736 | 0 |
| Quadrant | Total seconds | Saturated seconds | Saturation percentage |
|---|---|---|---|
| A | 35851 | 3882 | 10.828150% |
| B | 35984 | 2069 | 5.749778% |
| C | 36072 | 449 | 1.244733% |
| D | 36037 | 1787 | 4.958792% |
Noise dominated data is calculated using 1-second bins in cleaned event files. If a bin has >2000 counts, and if more than 50% of those come from <1% of pixels, then it is considered to be noise-dominated and hence unusable.
| Quadrant | # 1 sec bins | Bins with >0 counts | Bins with >2000 counts | High rate bins dominated by noise | Noise dominated (total time) | Noise dominated (detector-on time) | Marked lightcurve |
|---|---|---|---|---|---|---|---|
| A | 44165 | 36137 | 0 | 0 | 0.00% | 0.00% |  |
| B | 44165 | 36276 | 0 | 0 | 0.00% | 0.00% |  |
| C | 44165 | 36385 | 0 | 0 | 0.00% | 0.00% | 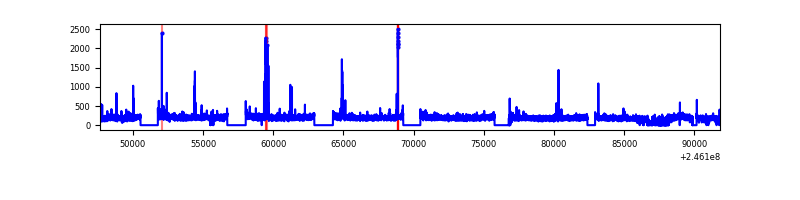 |
| D | 44165 | 36344 | 0 | 0 | 0.00% | 0.00% |  |
Top three noisy pixels from each quadrant. If the there are fewer than three noisy pixels in the level2.evt file, extra rows are filled as -1
| Pixel properties | Quadrant properties | ||||||
|---|---|---|---|---|---|---|---|
| Quadrant | DetID | PixID | Counts | Sigma | Mean | Median | Sigma |
| A | 0 | 29 | 1907 | 10.61 | 532 | 499 | 132.7 |
| A | 7 | 110 | 1671 | 8.83 | 532 | 499 | 132.7 |
| A | 9 | 19 | 1501 | 7.55 | 532 | 499 | 132.7 |
| B | 2 | 9 | 1711 | 11.01 | 544 | 519 | 108.3 |
| B | 3 | 17 | 1374 | 7.9 | 544 | 519 | 108.3 |
| B | 5 | 128 | 1344 | 7.62 | 544 | 519 | 108.3 |
| C | 1 | 80 | 1616 | 7.4 | 560 | 519 | 148.1 |
| C | 1 | 81 | 1577 | 7.14 | 560 | 519 | 148.1 |
| C | 12 | 241 | 1445 | 6.25 | 560 | 519 | 148.1 |
| D | 3 | 14 | 1359 | 6.57 | 508 | 462 | 136.5 |
| D | 6 | 231 | 1340 | 6.43 | 508 | 462 | 136.5 |
| D | 3 | 31 | 1311 | 6.22 | 508 | 462 | 136.5 |
Histogram calculated using DETX and DETY for each event in the final _common_clean file
| Quadrant A | 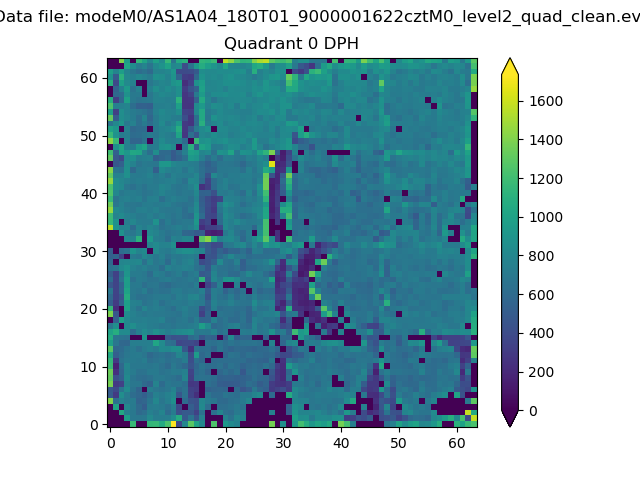 |
 |
Quadrant B |
|---|---|---|---|
| Quadrant D |  |
 |
Quadrant C |
| Plot type | Count rate plots | Images |
|---|---|---|
| Comparison with Poisson distribution Blue bars denote a histogram of data divided into 1 sec bins. Red curve is a Poisson curve with rate = median count rate of data. |
 |
 |
| Quadrant-wise count rates Data is divided into 100 sec bins |
 |
|
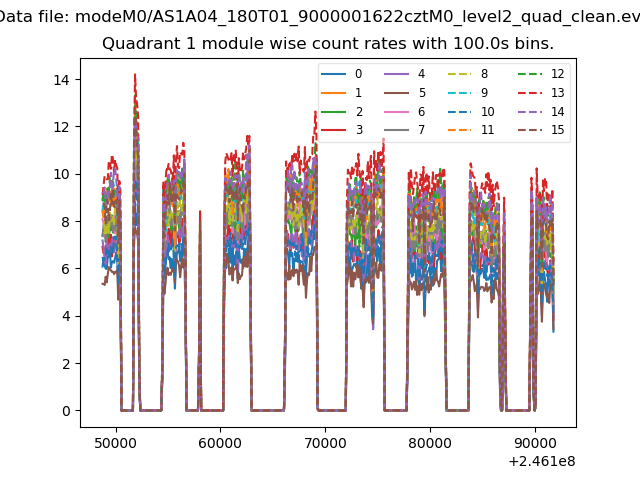
| Module-wise count rates for Quadrant A Data is divided into 100 sec bins |
 |
 |
| Module-wise count rates for Quadrant B Data is divided into 100 sec bins |
 |
 |
| Module-wise count rates for Quadrant C Data is divided into 100 sec bins |
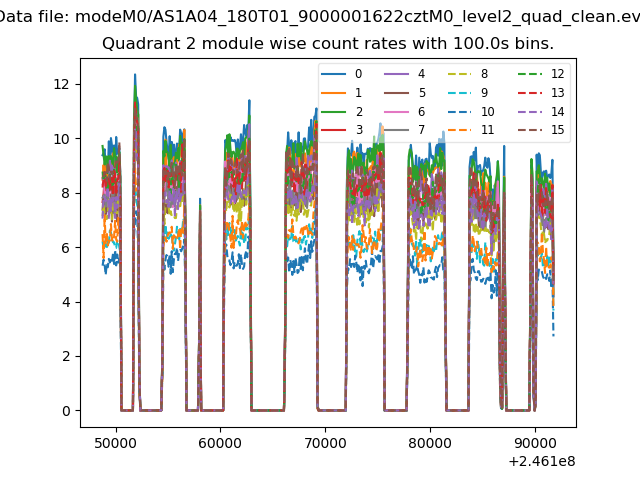 |
 |
| Module-wise count rates for Quadrant D Data is divided into 100 sec bins |
 |
 |
| Parameter | Plot |
|---|---|
| CZT HV Monitor |  |
| D_VDD | 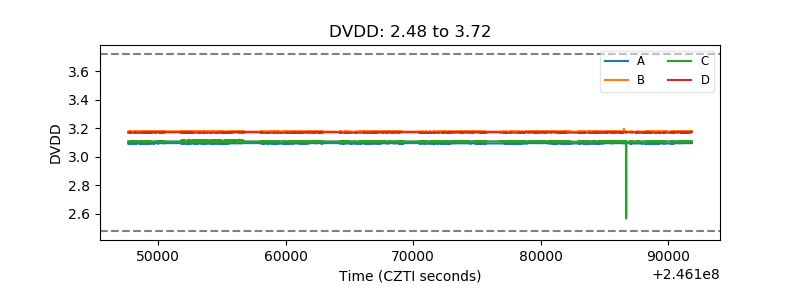 |
| Temperature 1 |  |
| Veto HV Monitor |  |
| Veto LLD |  |
| Alpha Counter |  |
| _CPM_Rate |  |
| CZT Counter |  |
| +2.5 Volts monitor |  |
| +5 Volts monitor |  |
| _ROLL_ROT |  |
| _Roll_DEC | 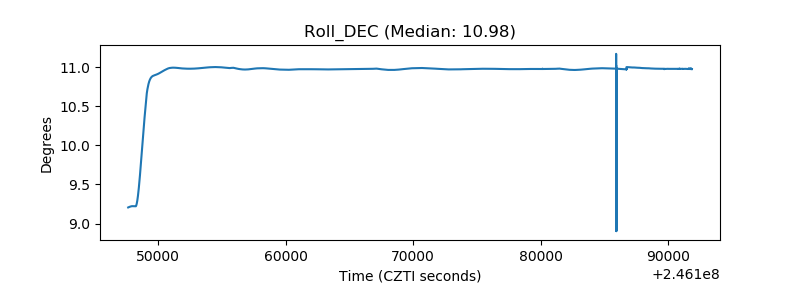 |
| _Roll_RA |  |
| Veto Counter | 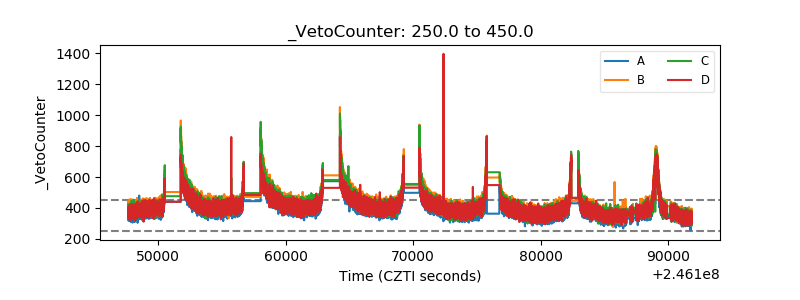 |