| Param | Original file | Final file |
|---|---|---|
| Filename | modeM0/AS1A04_180T01_9000001622_11143cztM0_level2.evt | modeM0/AS1A04_180T01_9000001622_11143cztM0_level2_quad_clean.evt |
| Size (bytes) | 392,791,680 | 51,217,920 |
| Size | 374.6 MB | 48.8 MB |
| Events in quadrant A | 3,324,293 | 308,847 |
| Events in quadrant B | 2,974,485 | 321,368 |
| Events in quadrant C | 2,131,373 | 315,247 |
| Events in quadrant D | 3,162,737 | 291,779 |
| Mode M0 | |||
|---|---|---|---|
| Quadrant | BADHDUFLAG | Total packets | Discarded packets |
| A | 0 | 12848 | 24 |
| B | 0 | 11680 | 11 |
| C | 0 | 9188 | 5 |
| D | 0 | 12349 | 16 |
| Mode M9 | |||
|---|---|---|---|
| Quadrant | BADHDUFLAG | Total packets | Discarded packets |
| A | 0 | 13 | 1 |
| B | 0 | 12 | 0 |
| C | 0 | 12 | 0 |
| D | 0 | 12 | 0 |
| Mode SS | |||
|---|---|---|---|
| Quadrant | BADHDUFLAG | Total packets | Discarded packets |
| A | 0 | 92 | 0 |
| B | 0 | 92 | 0 |
| C | 0 | 92 | 0 |
| D | 0 | 92 | 0 |
| Quadrant | Total seconds | Saturated seconds | Saturation percentage |
|---|---|---|---|
| A | 4445 | 243 | 5.466817% |
| B | 4449 | 191 | 4.293100% |
| C | 4451 | 17 | 0.381937% |
| D | 4447 | 341 | 7.668091% |
Noise dominated data is calculated using 1-second bins in cleaned event files. If a bin has >2000 counts, and if more than 50% of those come from <1% of pixels, then it is considered to be noise-dominated and hence unusable.
| Quadrant | # 1 sec bins | Bins with >0 counts | Bins with >2000 counts | High rate bins dominated by noise | Noise dominated (total time) | Noise dominated (detector-on time) | Marked lightcurve |
|---|---|---|---|---|---|---|---|
| A | 5695 | 4455 | 167 | 167 | 2.93% | 3.75% | 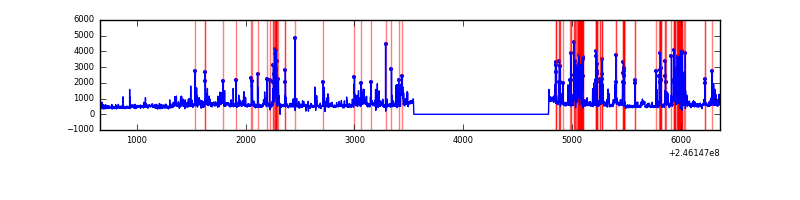 |
| B | 5695 | 4455 | 79 | 79 | 1.39% | 1.77% | 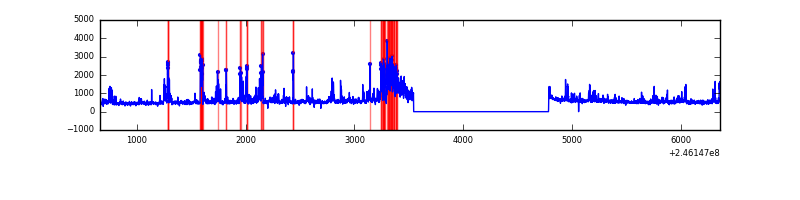 |
| C | 5695 | 4456 | 2 | 2 | 0.04% | 0.04% | 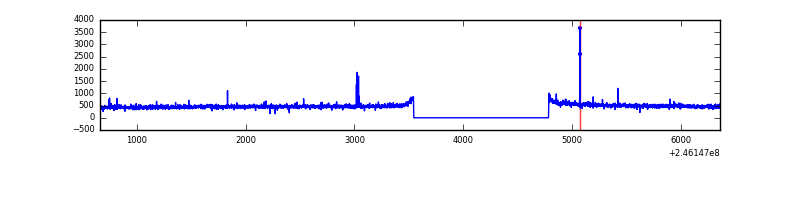 |
| D | 5695 | 4456 | 281 | 281 | 4.93% | 6.31% |  |
Top three noisy pixels from each quadrant. If the there are fewer than three noisy pixels in the level2.evt file, extra rows are filled as -1
| Pixel properties | Quadrant properties | ||||||
|---|---|---|---|---|---|---|---|
| Quadrant | DetID | PixID | Counts | Sigma | Mean | Median | Sigma |
| A | 8 | 5 | 546268 | 4882.95 | 547 | 536 | 111.8 |
| A | 14 | 238 | 529036 | 4728.76 | 547 | 536 | 111.8 |
| A | 8 | 15 | 86559 | 769.69 | 547 | 536 | 111.8 |
| B | 4 | 239 | 576807 | 5407.39 | 559 | 547 | 106.6 |
| B | 15 | 204 | 71277 | 663.7 | 559 | 547 | 106.6 |
| B | 4 | 80 | 47050 | 436.37 | 559 | 547 | 106.6 |
| C | 14 | 234 | 9888 | 73.82 | 539 | 541 | 126.6 |
| C | 9 | 204 | 8995 | 66.76 | 539 | 541 | 126.6 |
| C | 8 | 128 | 4012 | 27.41 | 539 | 541 | 126.6 |
| D | 10 | 253 | 955108 | 7663.34 | 513 | 500 | 124.6 |
| D | 10 | 199 | 71051 | 566.36 | 513 | 500 | 124.6 |
| D | 1 | 52 | 38563 | 305.56 | 513 | 500 | 124.6 |
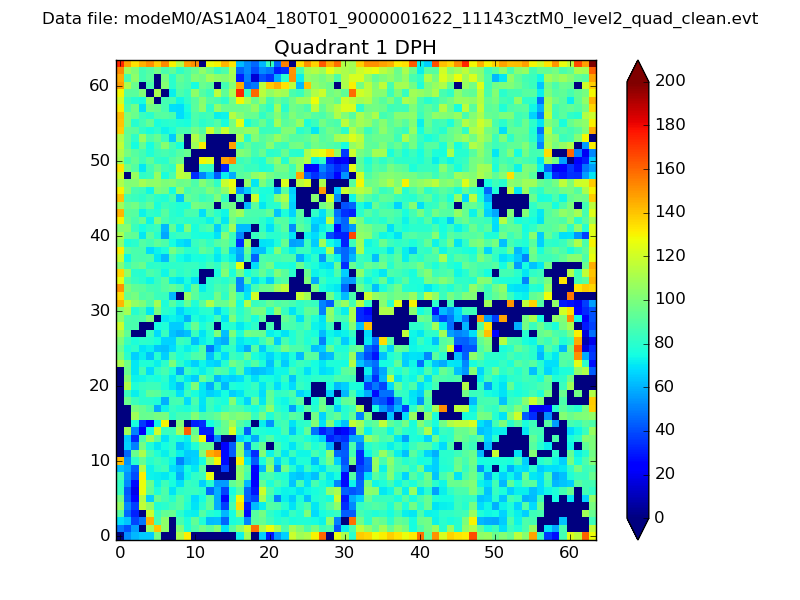
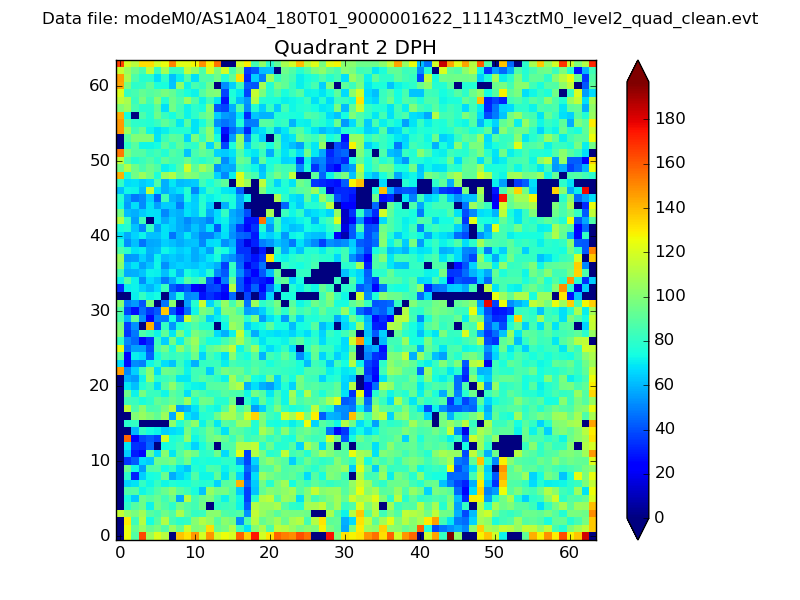
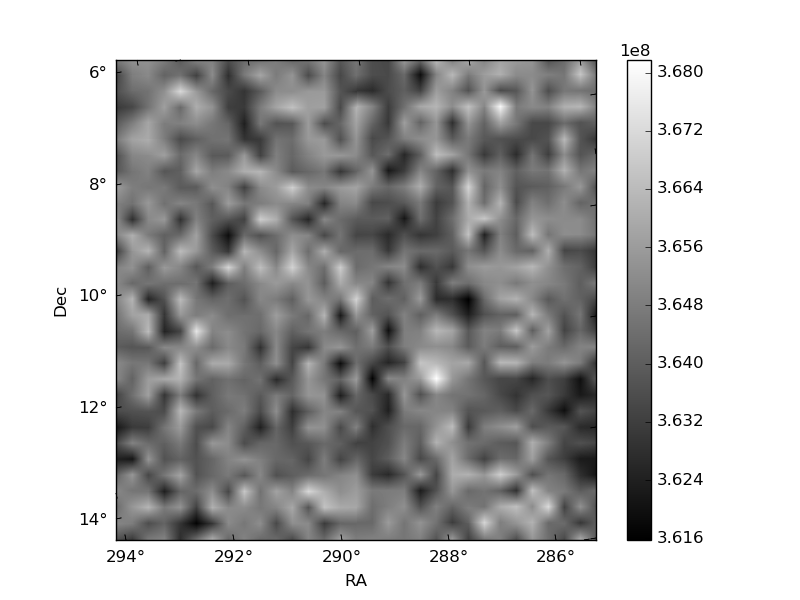
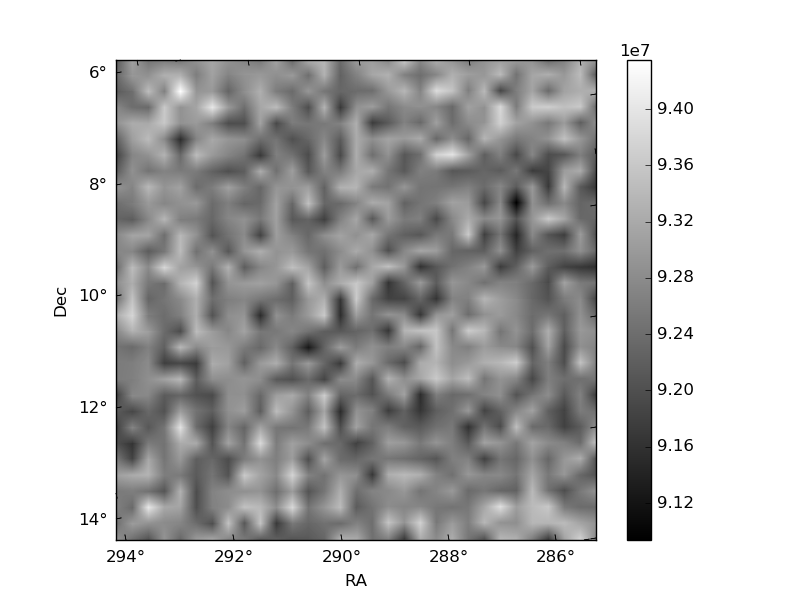
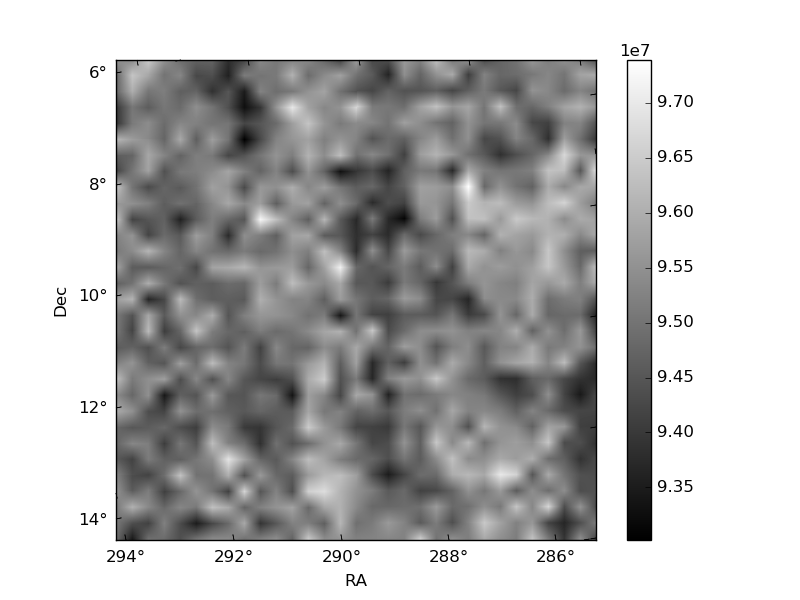
Histogram calculated using DETX and DETY for each event in the final _common_clean file
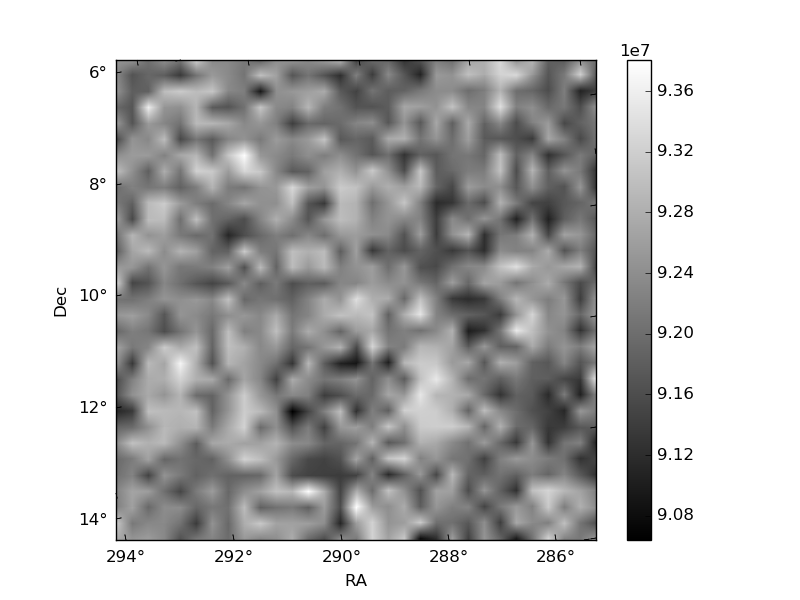
| Quadrant A | 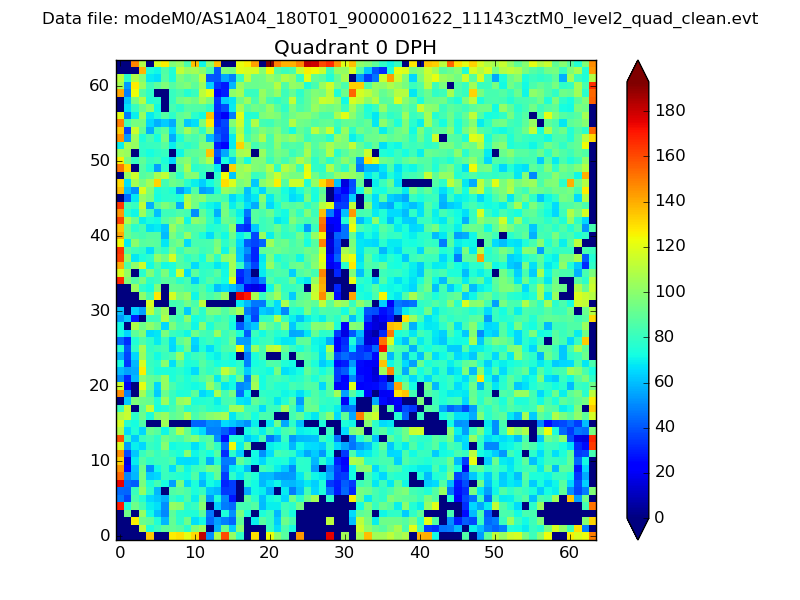 |
 |
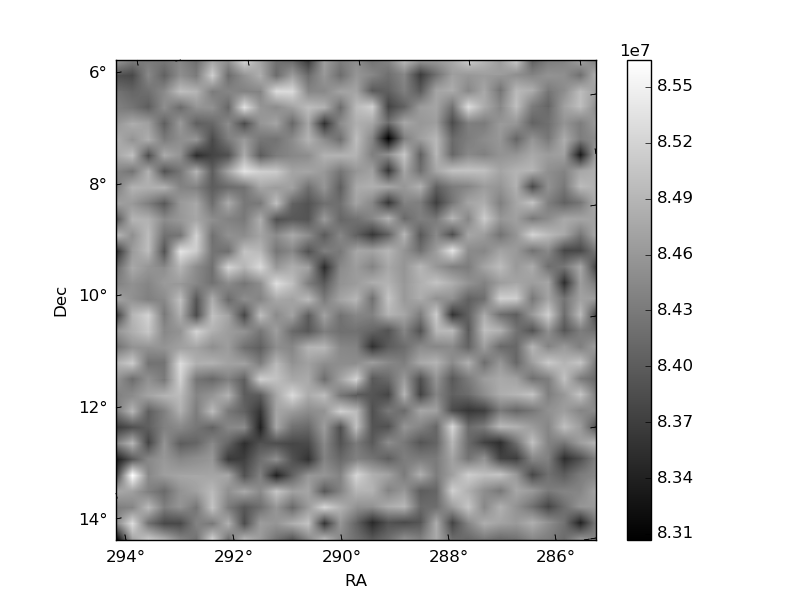
Quadrant B |
|---|---|---|---|
| Quadrant D | 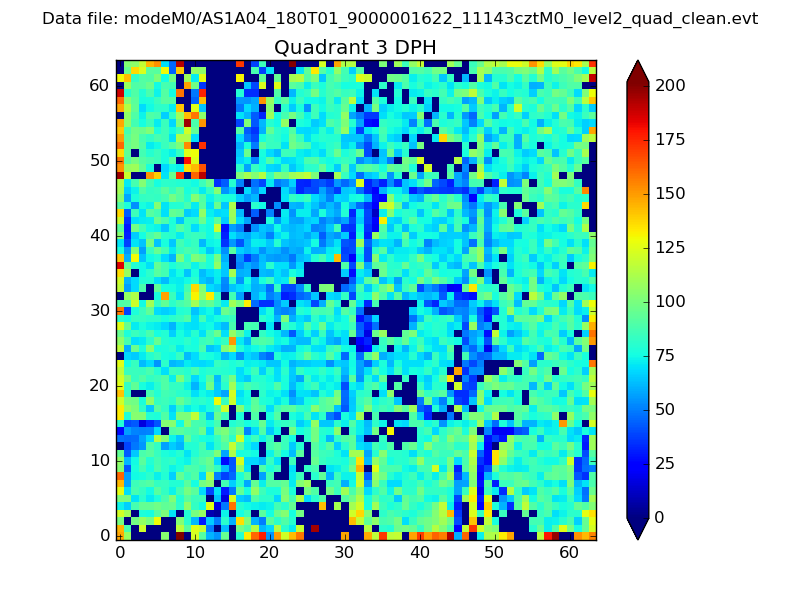 |
 |
Quadrant C |
| Plot type | Count rate plots | Images |
|---|---|---|
| Comparison with Poisson distribution Blue bars denote a histogram of data divided into 1 sec bins. Red curve is a Poisson curve with rate = median count rate of data. |
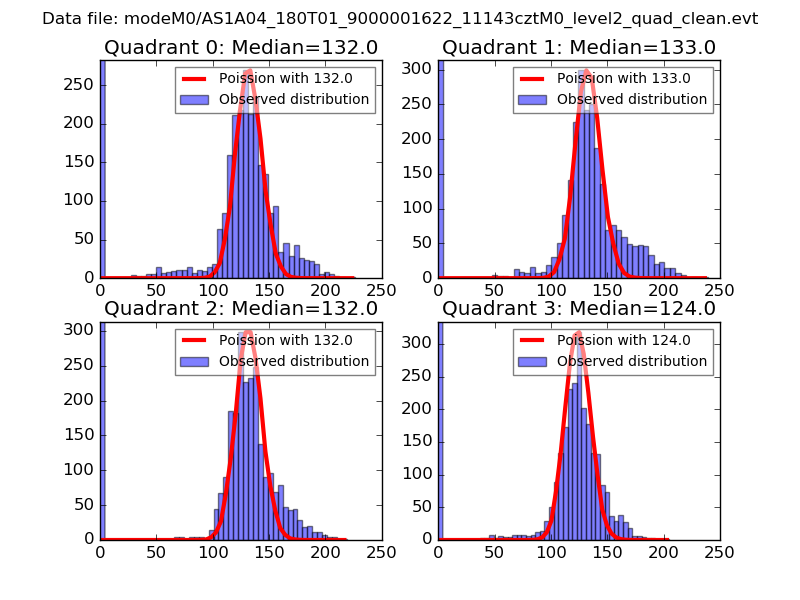 |
 |
| Quadrant-wise count rates Data is divided into 100 sec bins |
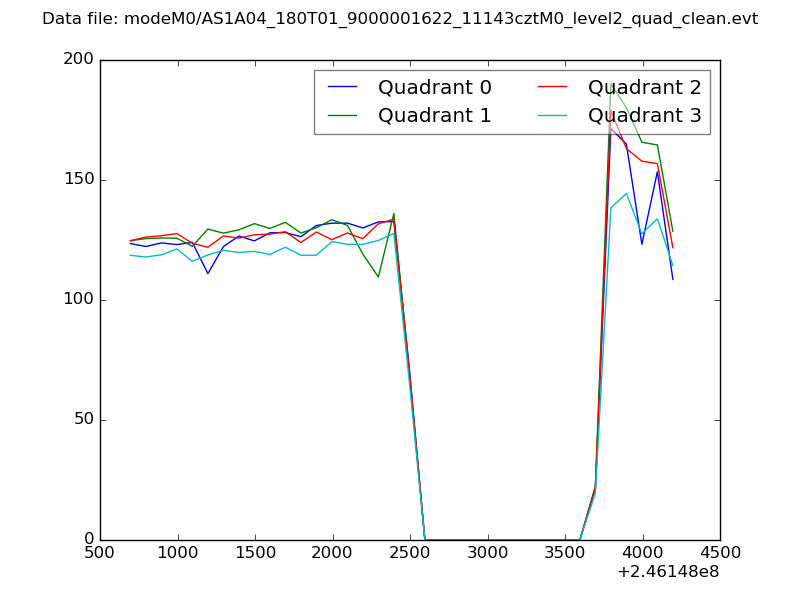 |
|
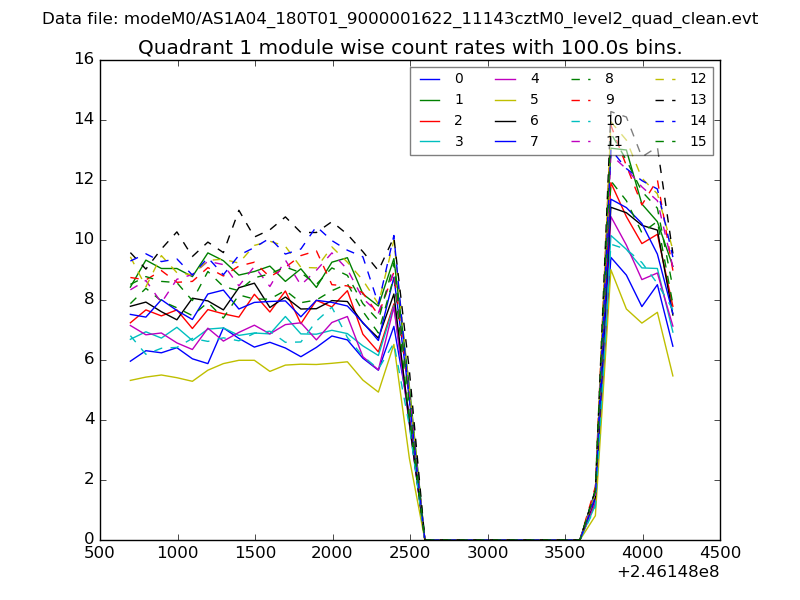
| Module-wise count rates for Quadrant A Data is divided into 100 sec bins |
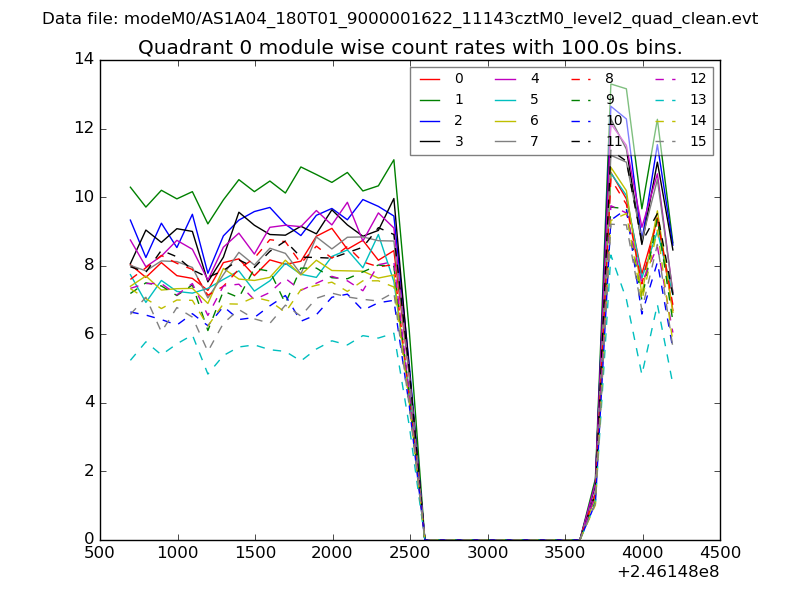 |
 |
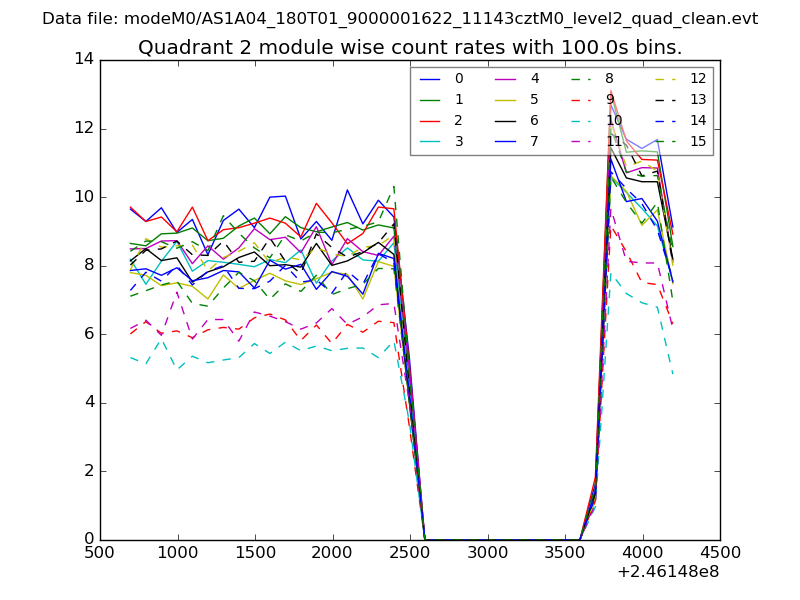
| Module-wise count rates for Quadrant B Data is divided into 100 sec bins |
 |
 |
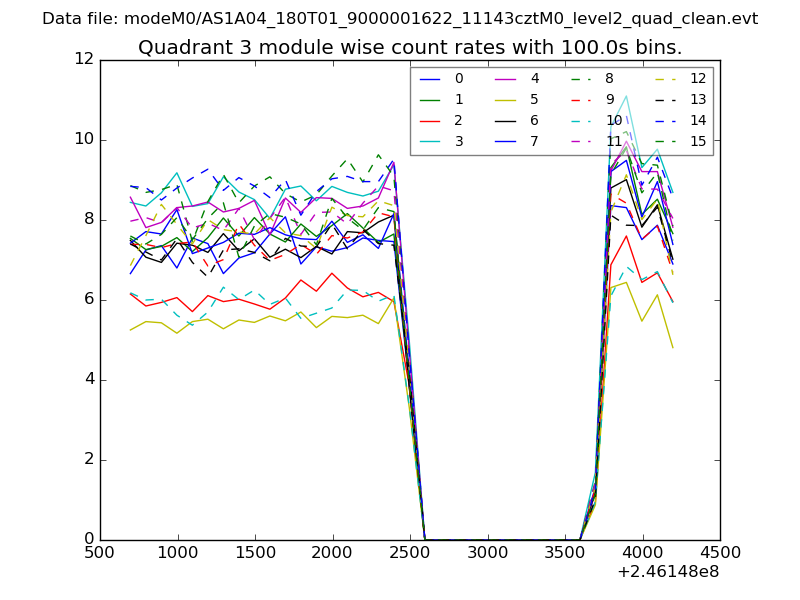
| Module-wise count rates for Quadrant C Data is divided into 100 sec bins |
 |
 |
| Module-wise count rates for Quadrant D Data is divided into 100 sec bins |
 |
 |
| Parameter | Plot |
|---|---|
| CZT HV Monitor | 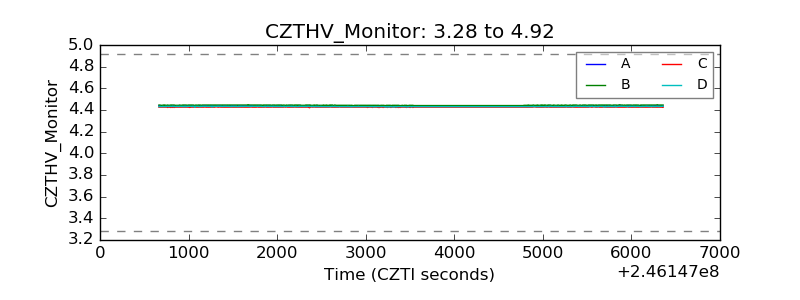 |
| D_VDD |  |
| Temperature 1 | 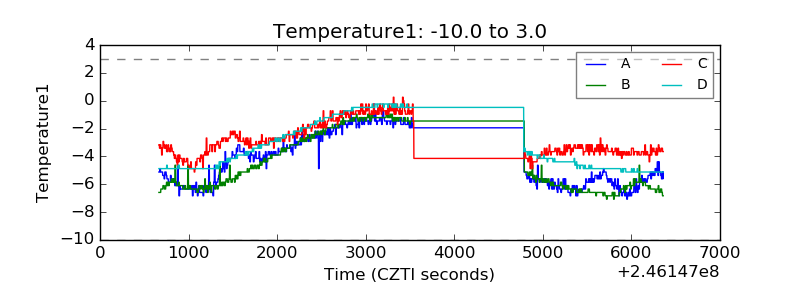 |
| Veto HV Monitor | 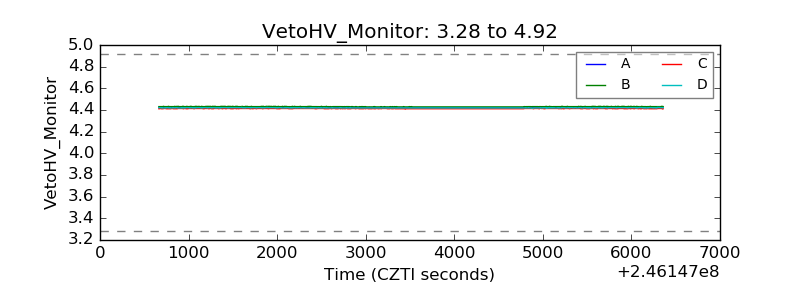 |
| Veto LLD | 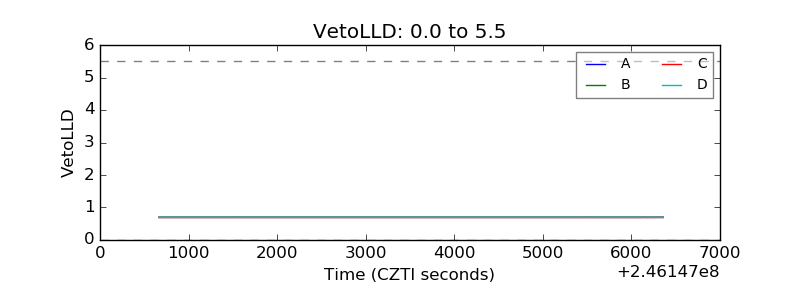 |
| Alpha Counter | 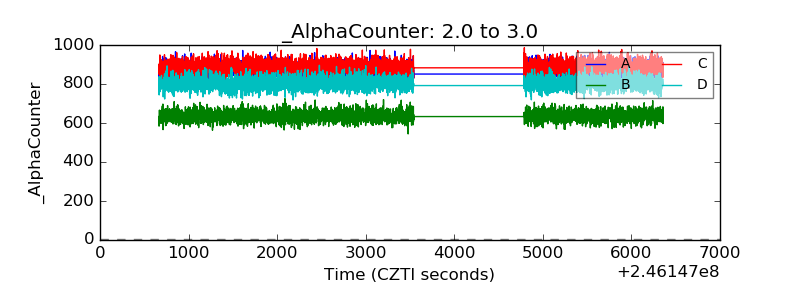 |
| _CPM_Rate | 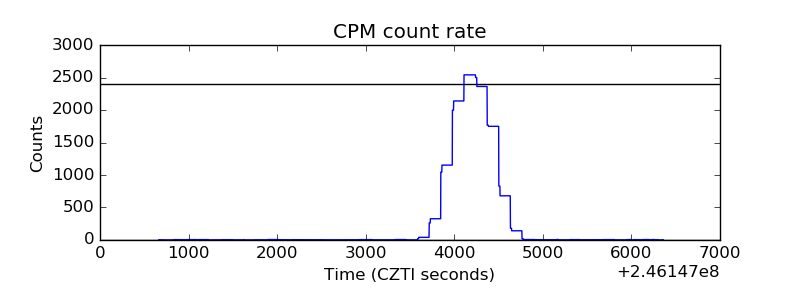 |
| CZT Counter | 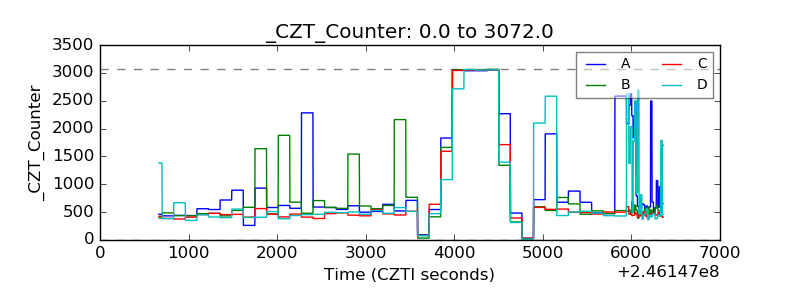 |
| +2.5 Volts monitor |  |
| +5 Volts monitor |  |
| _ROLL_ROT | 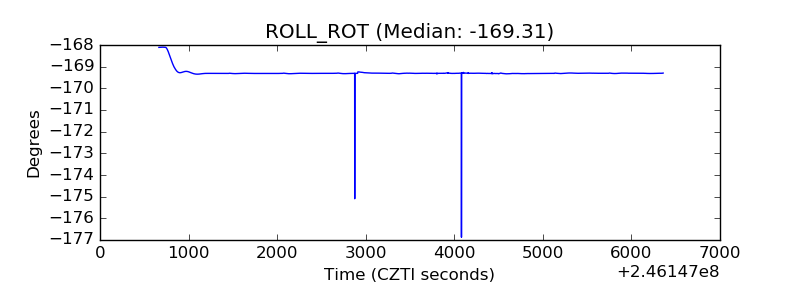 |
| _Roll_DEC | 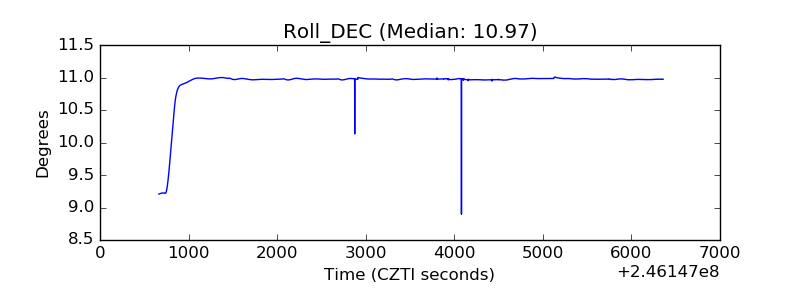 |
| _Roll_RA | 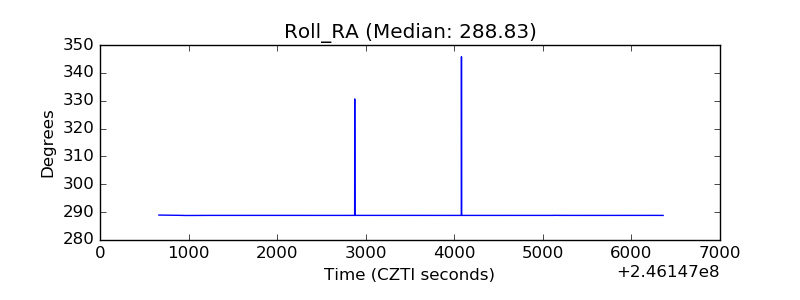 |
| Veto Counter |  |