| Param | Original file | Final file |
|---|---|---|
| Filename | modeM0/AS1A04_180T01_9000001622_11147cztM0_level2.evt | modeM0/AS1A04_180T01_9000001622_11147cztM0_level2_quad_clean.evt |
| Size (bytes) | 400,161,600 | 47,404,800 |
| Size | 381.6 MB | 45.2 MB |
| Events in quadrant A | 4,187,490 | 277,069 |
| Events in quadrant B | 2,795,225 | 299,262 |
| Events in quadrant C | 1,859,004 | 301,328 |
| Events in quadrant D | 3,003,634 | 273,286 |
| Mode M0 | |||
|---|---|---|---|
| Quadrant | BADHDUFLAG | Total packets | Discarded packets |
| A | 0 | 18246 | 3002 |
| B | 0 | 13372 | 2490 |
| C | 0 | 9571 | 1315 |
| D | 0 | 13216 | 1578 |
| Mode M9 | |||
|---|---|---|---|
| Quadrant | BADHDUFLAG | Total packets | Discarded packets |
| A | 0 | 21 | 10 |
| B | 0 | 14 | 3 |
| C | 0 | 14 | 3 |
| D | 0 | 15 | 4 |
| Mode SS | |||
|---|---|---|---|
| Quadrant | BADHDUFLAG | Total packets | Discarded packets |
| A | 0 | 96 | 16 |
| B | 0 | 96 | 14 |
| C | 0 | 99 | 17 |
| D | 0 | 99 | 19 |
| Quadrant | Total seconds | Saturated seconds | Saturation percentage |
|---|---|---|---|
| A | 3986 | 417 | 10.461616% |
| B | 4017 | 216 | 5.377147% |
| C | 4052 | 19 | 0.468904% |
| D | 4044 | 263 | 6.503462% |
Noise dominated data is calculated using 1-second bins in cleaned event files. If a bin has >2000 counts, and if more than 50% of those come from <1% of pixels, then it is considered to be noise-dominated and hence unusable.
| Quadrant | # 1 sec bins | Bins with >0 counts | Bins with >2000 counts | High rate bins dominated by noise | Noise dominated (total time) | Noise dominated (detector-on time) | Marked lightcurve |
|---|---|---|---|---|---|---|---|
| A | 6633 | 4050 | 270 | 270 | 4.07% | 6.67% | 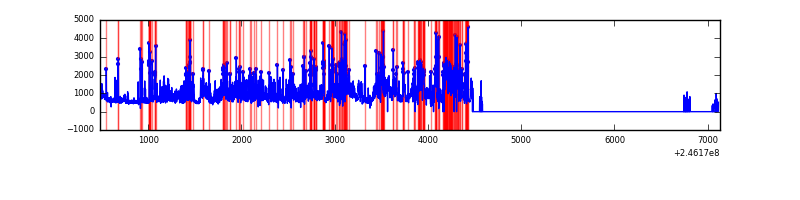 |
| B | 6624 | 4067 | 104 | 104 | 1.57% | 2.56% | 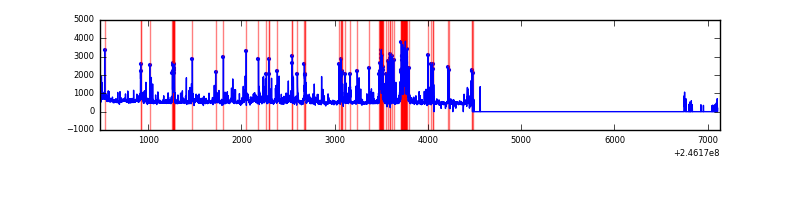 |
| C | 6648 | 4109 | 0 | 0 | 0.00% | 0.00% | 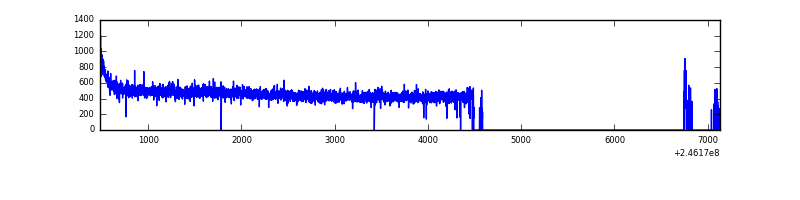 |
| D | 6635 | 4099 | 179 | 179 | 2.70% | 4.37% | 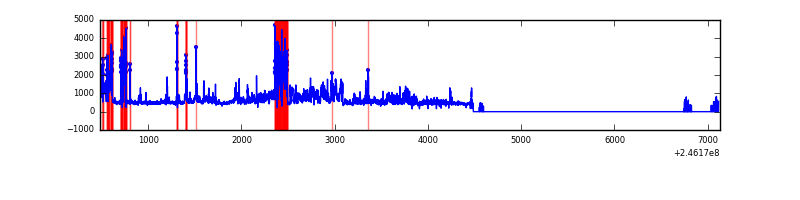 |
Top three noisy pixels from each quadrant. If the there are fewer than three noisy pixels in the level2.evt file, extra rows are filled as -1
| Pixel properties | Quadrant properties | ||||||
|---|---|---|---|---|---|---|---|
| Quadrant | DetID | PixID | Counts | Sigma | Mean | Median | Sigma |
| A | 8 | 5 | 1568359 | 16445.51 | 471 | 461 | 95.3 |
| A | 14 | 238 | 554119 | 5807.26 | 471 | 461 | 95.3 |
| A | 8 | 15 | 129038 | 1348.63 | 471 | 461 | 95.3 |
| B | 4 | 239 | 545562 | 5854.35 | 486 | 475 | 93.1 |
| B | 15 | 204 | 145385 | 1556.36 | 486 | 475 | 93.1 |
| B | 10 | 16 | 117962 | 1261.84 | 486 | 475 | 93.1 |
| C | 9 | 204 | 5351 | 43.98 | 474 | 478 | 110.8 |
| C | 13 | 61 | 3646 | 28.59 | 474 | 478 | 110.8 |
| C | 4 | 222 | 1918 | 13.0 | 474 | 478 | 110.8 |
| D | 2 | 14 | 364347 | 3274.33 | 455 | 443 | 111.1 |
| D | 11 | 129 | 355170 | 3191.76 | 455 | 443 | 111.1 |
| D | 1 | 52 | 238903 | 2145.61 | 455 | 443 | 111.1 |
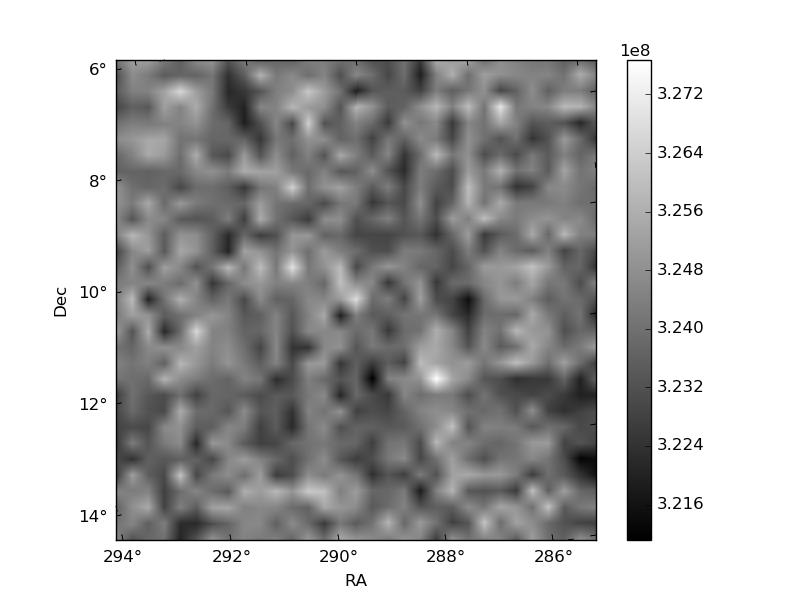
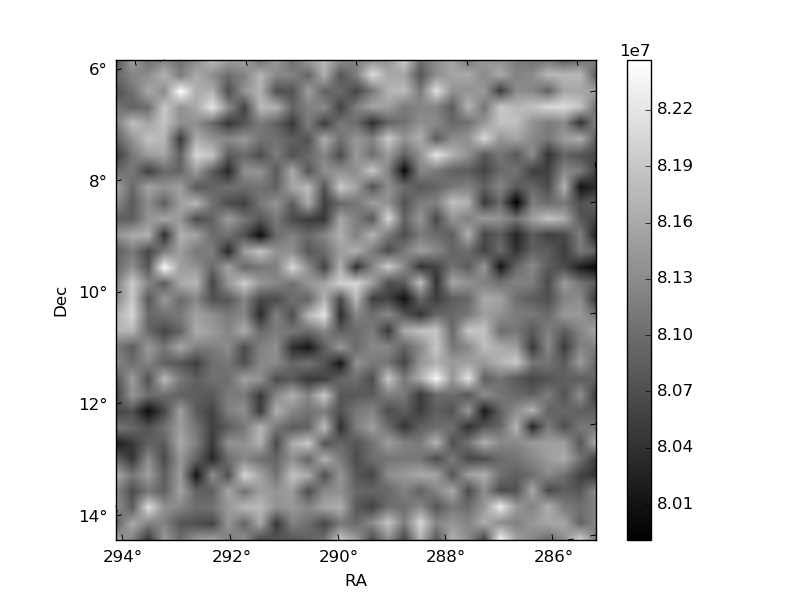
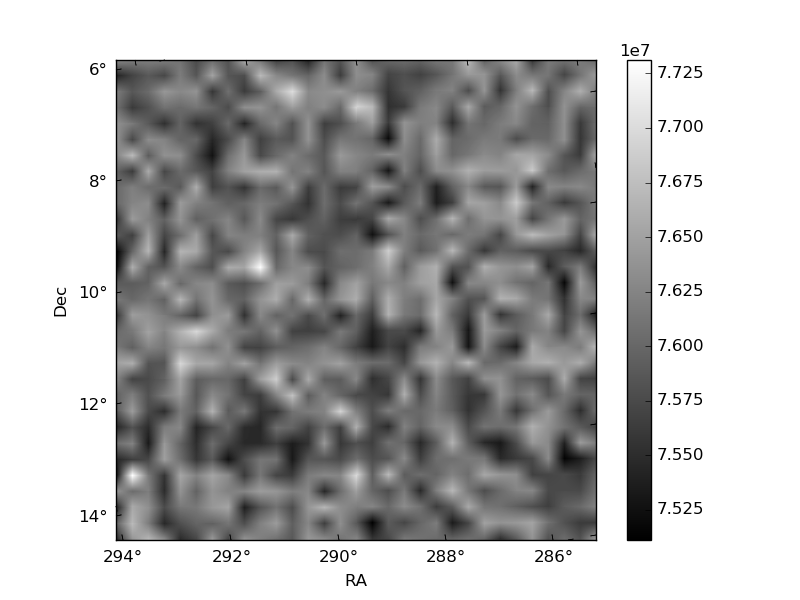
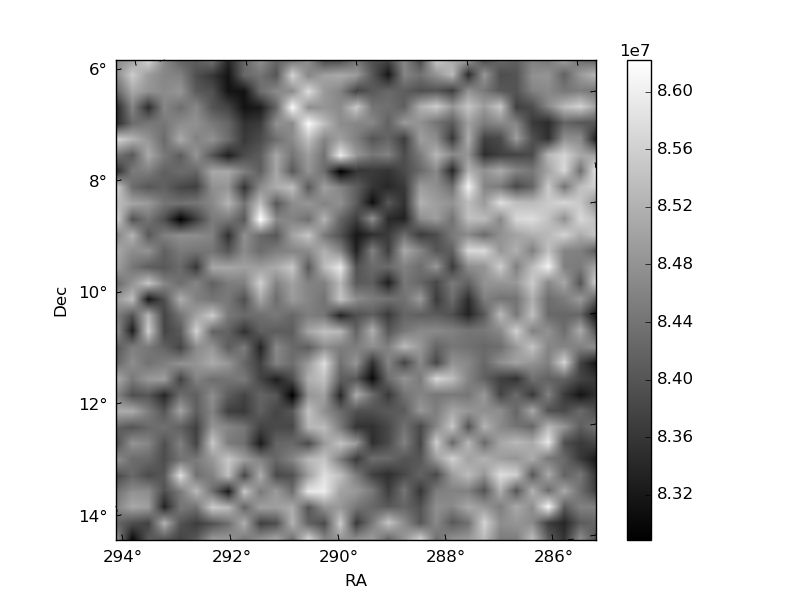
Histogram calculated using DETX and DETY for each event in the final _common_clean file
| Quadrant A | 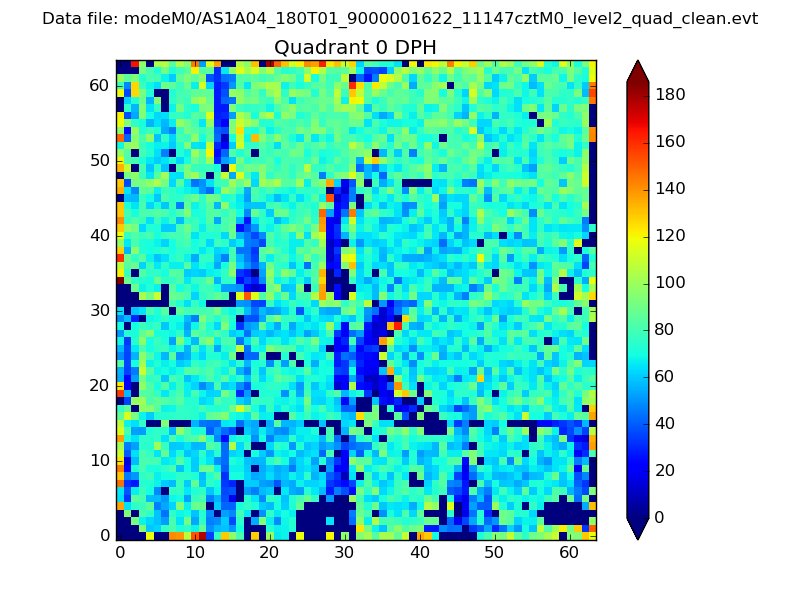 |
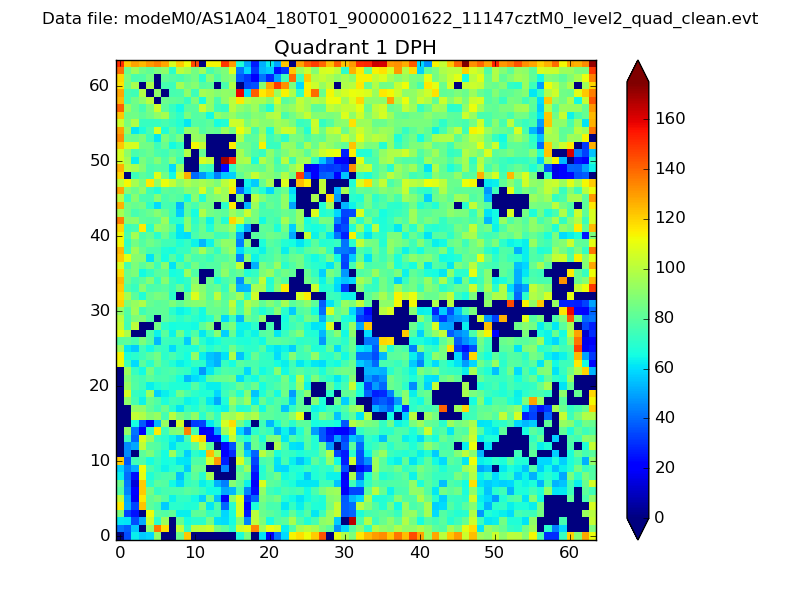 |
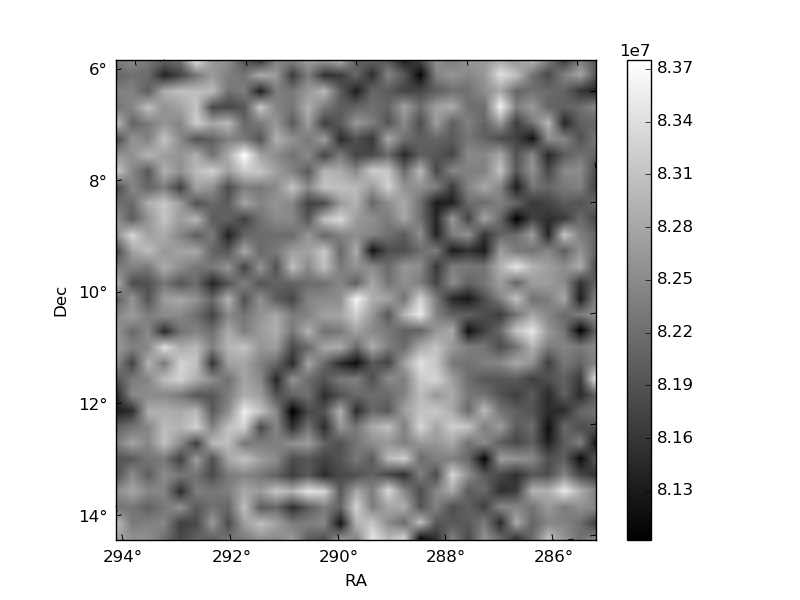
Quadrant B |
|---|---|---|---|
| Quadrant D | 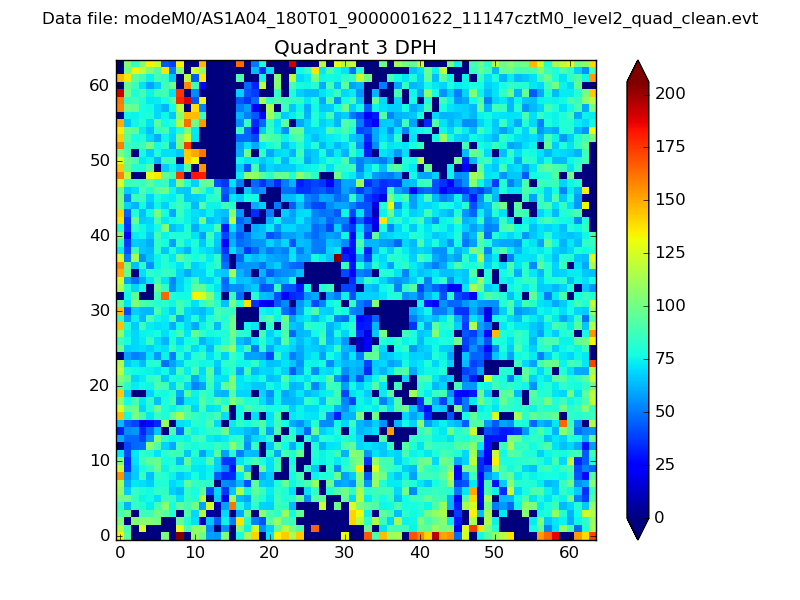 |
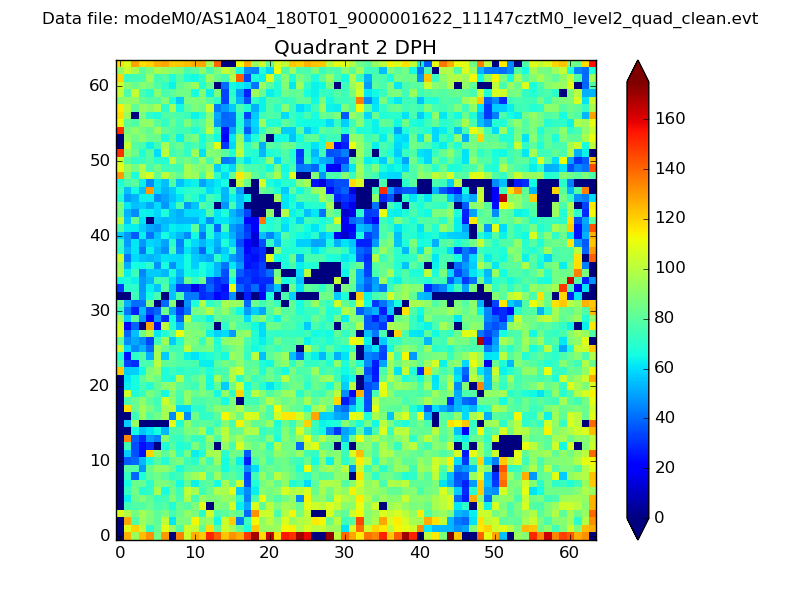 |
Quadrant C |
| Plot type | Count rate plots | Images |
|---|---|---|
| Comparison with Poisson distribution Blue bars denote a histogram of data divided into 1 sec bins. Red curve is a Poisson curve with rate = median count rate of data. |
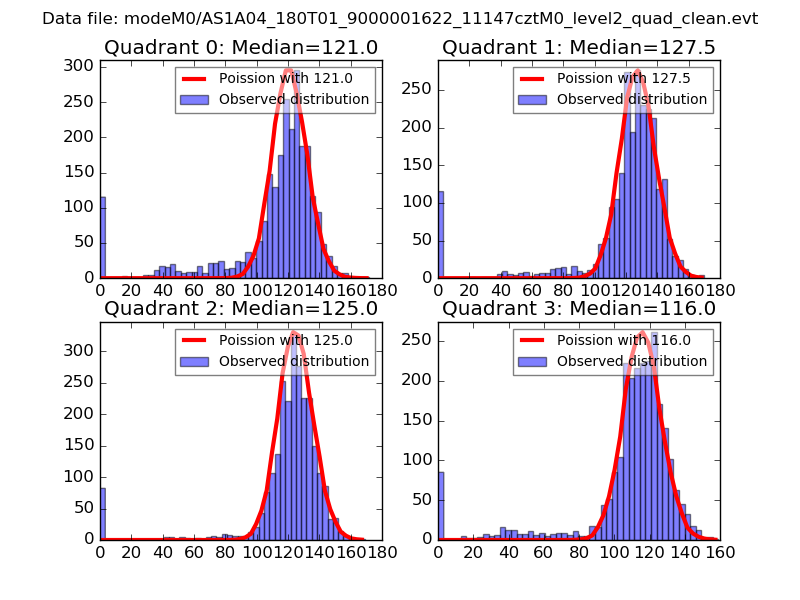 |
 |
| Quadrant-wise count rates Data is divided into 100 sec bins |
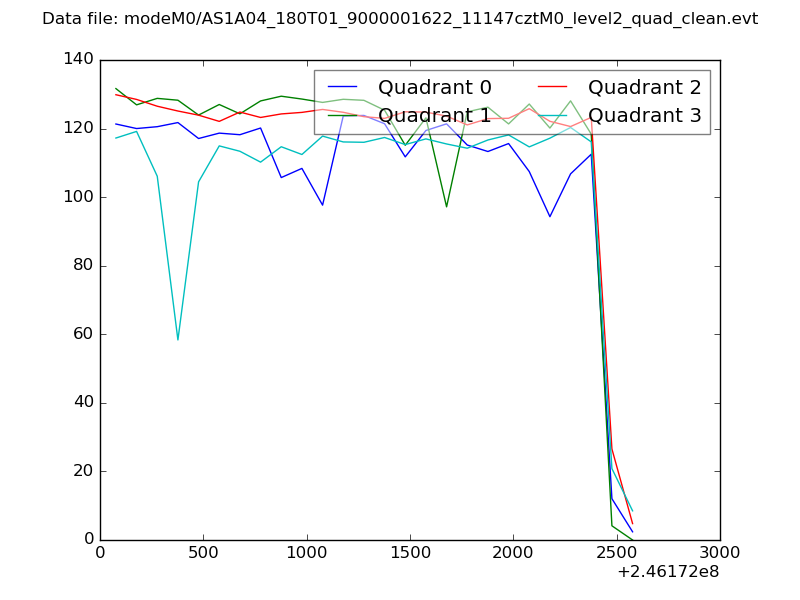 |
|
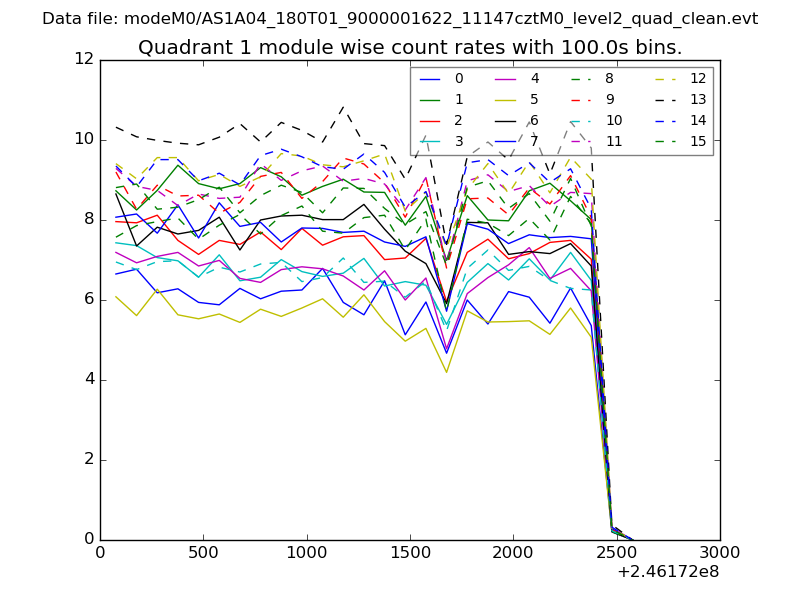
| Module-wise count rates for Quadrant A Data is divided into 100 sec bins |
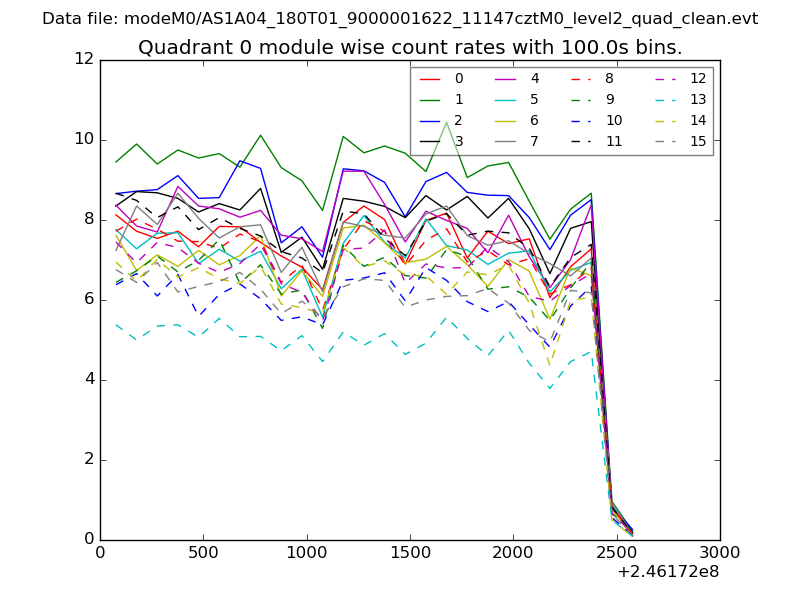 |
 |
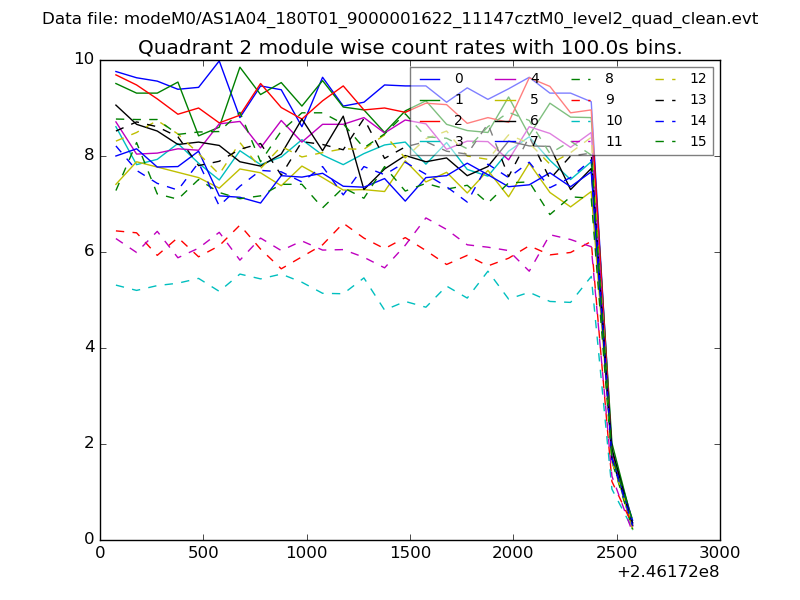
| Module-wise count rates for Quadrant B Data is divided into 100 sec bins |
 |
 |
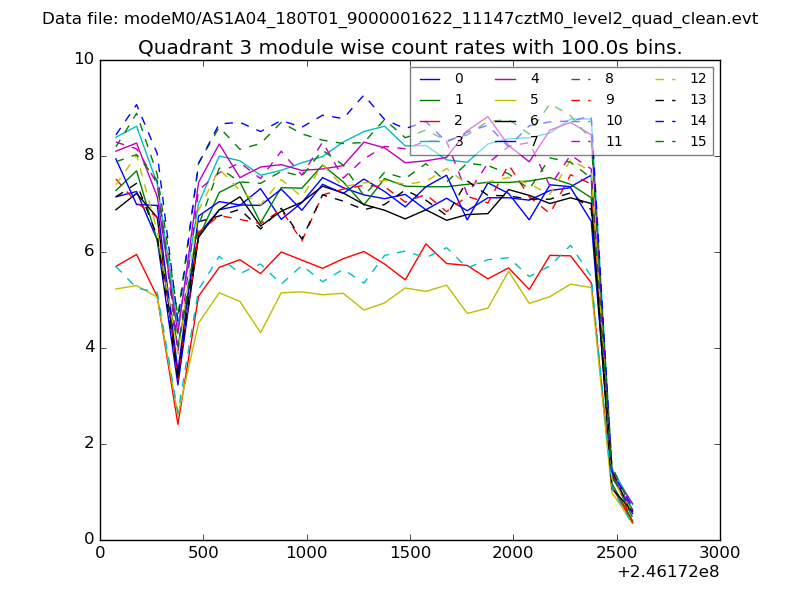
| Module-wise count rates for Quadrant C Data is divided into 100 sec bins |
 |
 |
| Module-wise count rates for Quadrant D Data is divided into 100 sec bins |
 |
 |
| Parameter | Plot |
|---|---|
| CZT HV Monitor | 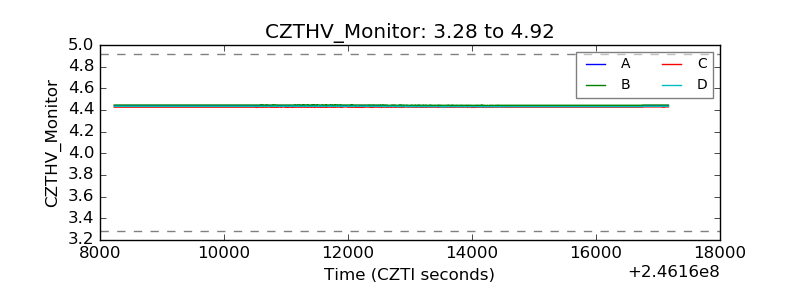 |
| D_VDD |  |
| Temperature 1 | 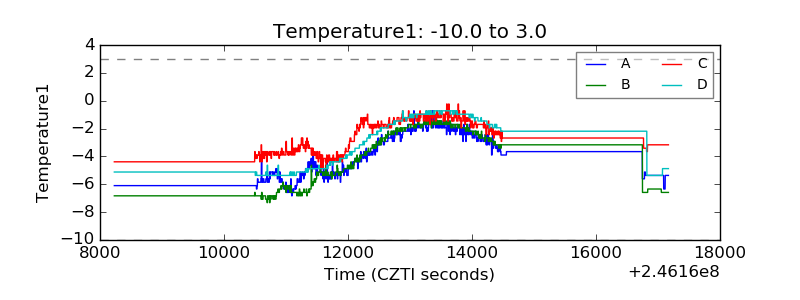 |
| Veto HV Monitor | 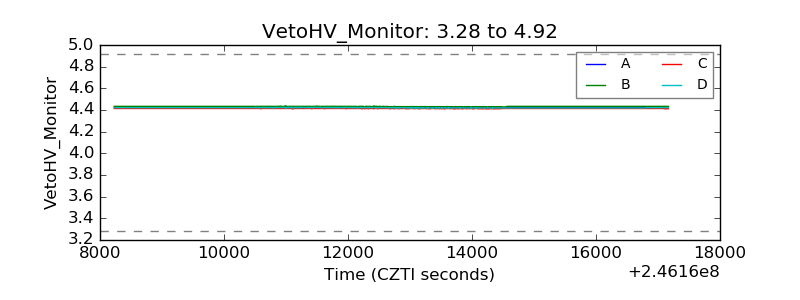 |
| Veto LLD | 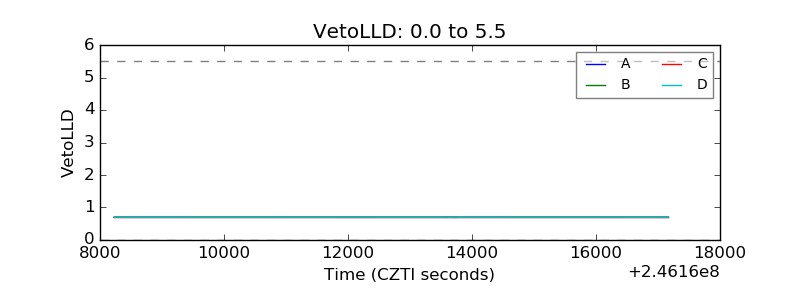 |
| Alpha Counter | 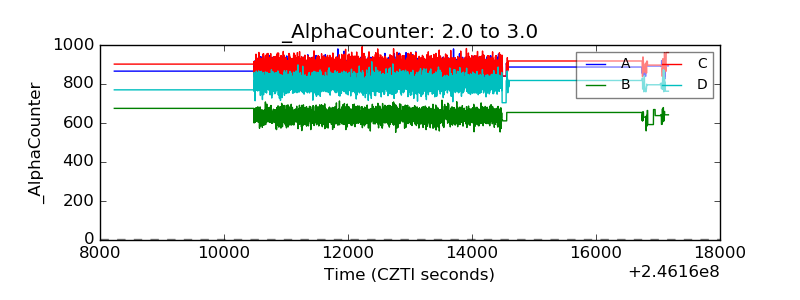 |
| _CPM_Rate | 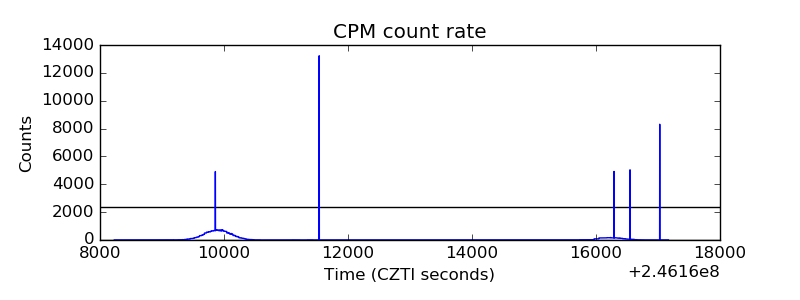 |
| CZT Counter | 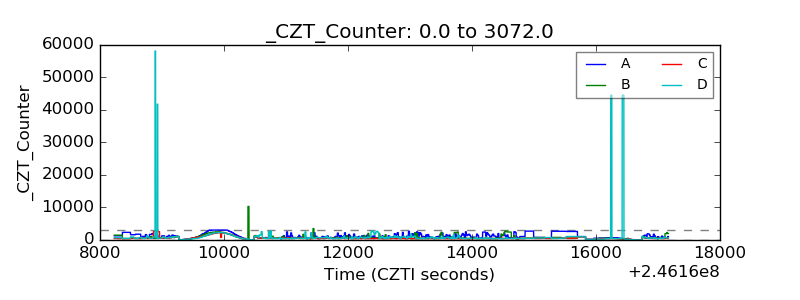 |
| +2.5 Volts monitor |  |
| +5 Volts monitor |  |
| _ROLL_ROT |  |
| _Roll_DEC | 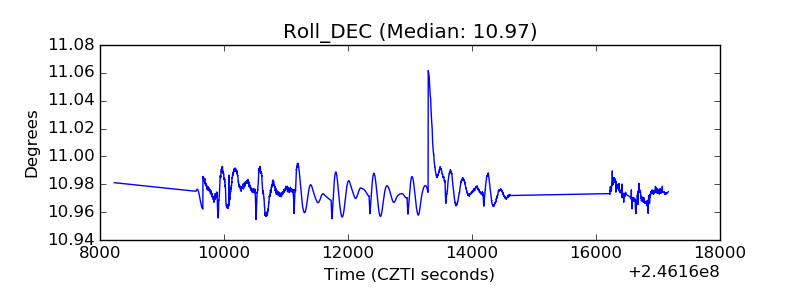 |
| _Roll_RA | 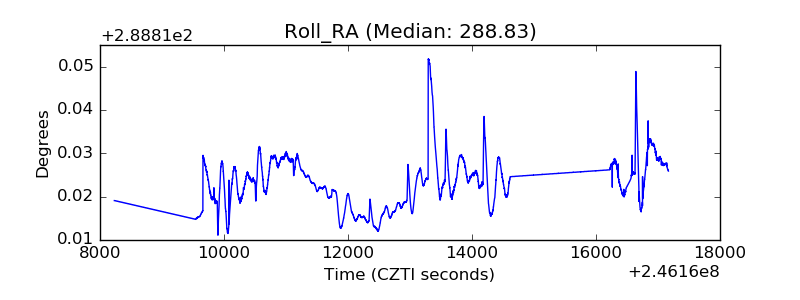 |
| Veto Counter | 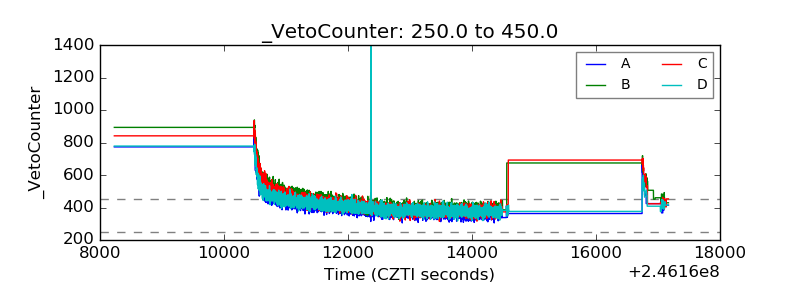 |