| Param | Original file | Final file |
|---|---|---|
| Filename | modeM0/AS1A04_180T01_9000001622_11148cztM0_level2.evt | modeM0/AS1A04_180T01_9000001622_11148cztM0_level2_quad_clean.evt |
| Size (bytes) | 2,708,112,960 | 362,911,680 |
| Size | 2.5 GB | 346.1 MB |
| Events in quadrant A | 26,519,651 | 2,214,416 |
| Events in quadrant B | 19,487,900 | 2,334,661 |
| Events in quadrant C | 13,923,577 | 2,308,144 |
| Events in quadrant D | 20,141,841 | 2,147,466 |
| Mode M0 | |||
|---|---|---|---|
| Quadrant | BADHDUFLAG | Total packets | Discarded packets |
| A | 0 | 99046 | 570 |
| B | 0 | 76542 | 299 |
| C | 0 | 60380 | 238 |
| D | 0 | 79107 | 303 |
| Mode M9 | |||
|---|---|---|---|
| Quadrant | BADHDUFLAG | Total packets | Discarded packets |
| A | 0 | 66 | 0 |
| B | 0 | 66 | 0 |
| C | 0 | 66 | 0 |
| D | 0 | 66 | 0 |
| Mode SS | |||
|---|---|---|---|
| Quadrant | BADHDUFLAG | Total packets | Discarded packets |
| A | 0 | 592 | 0 |
| B | 0 | 592 | 2 |
| C | 0 | 592 | 2 |
| D | 0 | 592 | 2 |
| Quadrant | Total seconds | Saturated seconds | Saturation percentage |
|---|---|---|---|
| A | 28867 | 2946 | 10.205425% |
| B | 28895 | 1451 | 5.021630% |
| C | 28901 | 285 | 0.986125% |
| D | 28889 | 1485 | 5.140365% |
Noise dominated data is calculated using 1-second bins in cleaned event files. If a bin has >2000 counts, and if more than 50% of those come from <1% of pixels, then it is considered to be noise-dominated and hence unusable.
| Quadrant | # 1 sec bins | Bins with >0 counts | Bins with >2000 counts | High rate bins dominated by noise | Noise dominated (total time) | Noise dominated (detector-on time) | Marked lightcurve |
|---|---|---|---|---|---|---|---|
| A | 35628 | 28903 | 1757 | 1757 | 4.93% | 6.08% | 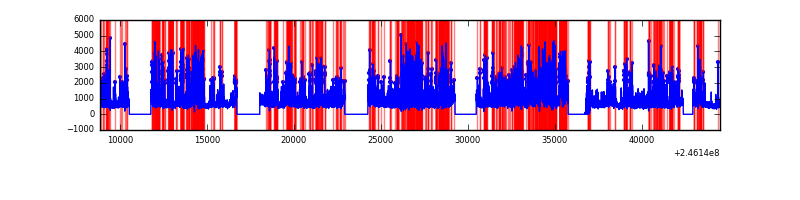 |
| B | 35628 | 28939 | 627 | 627 | 1.76% | 2.17% | 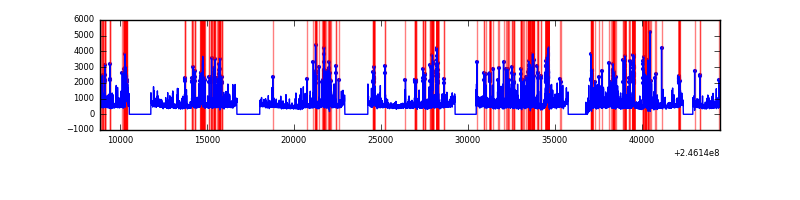 |
| C | 35628 | 28934 | 22 | 22 | 0.06% | 0.08% | 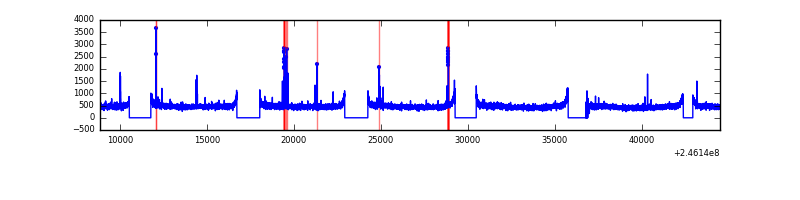 |
| D | 35628 | 28928 | 991 | 991 | 2.78% | 3.43% | 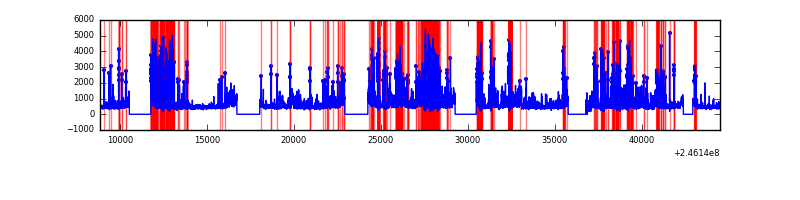 |
Top three noisy pixels from each quadrant. If the there are fewer than three noisy pixels in the level2.evt file, extra rows are filled as -1
| Pixel properties | Quadrant properties | ||||||
|---|---|---|---|---|---|---|---|
| Quadrant | DetID | PixID | Counts | Sigma | Mean | Median | Sigma |
| A | 8 | 5 | 6797006 | 9650.56 | 3522 | 3456 | 704.0 |
| A | 14 | 238 | 4721267 | 6701.88 | 3522 | 3456 | 704.0 |
| A | 8 | 15 | 706877 | 999.24 | 3522 | 3456 | 704.0 |
| B | 4 | 239 | 2869350 | 4200.87 | 3630 | 3548 | 682.2 |
| B | 10 | 16 | 1178501 | 1722.32 | 3630 | 3548 | 682.2 |
| B | 15 | 204 | 480919 | 699.76 | 3630 | 3548 | 682.2 |
| C | 9 | 54 | 98884 | 117.5 | 3516 | 3540 | 811.4 |
| C | 9 | 204 | 83554 | 98.61 | 3516 | 3540 | 811.4 |
| C | 13 | 61 | 26040 | 27.73 | 3516 | 3540 | 811.4 |
| D | 1 | 52 | 2489276 | 3043.74 | 3427 | 3333 | 816.7 |
| D | 11 | 129 | 1410644 | 1723.09 | 3427 | 3333 | 816.7 |
| D | 10 | 253 | 1176917 | 1436.91 | 3427 | 3333 | 816.7 |
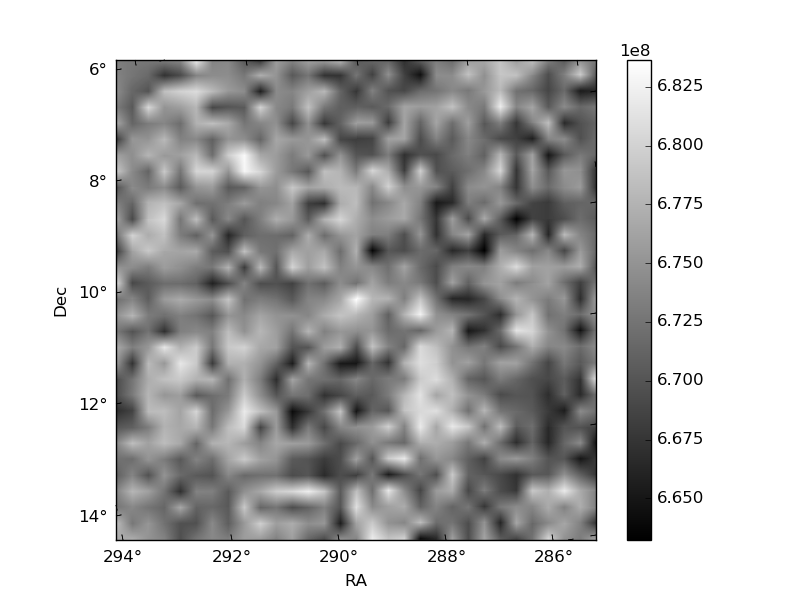
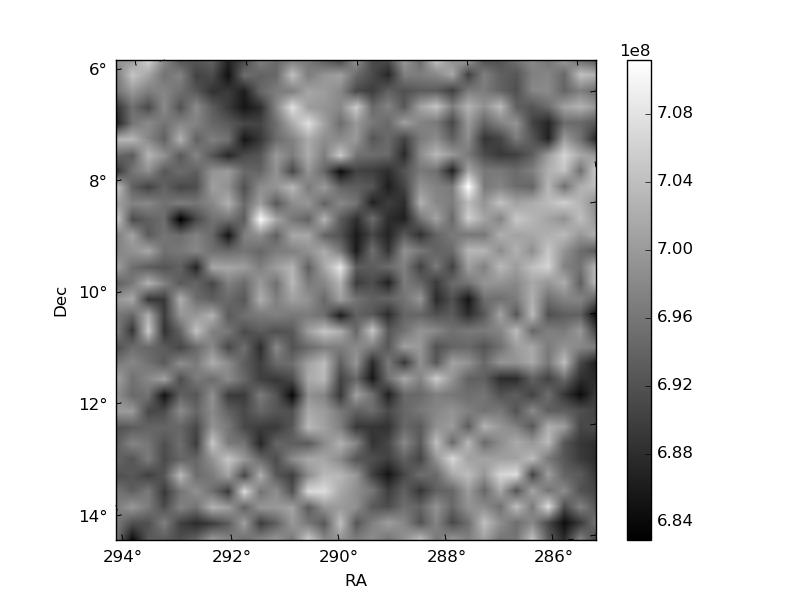
Histogram calculated using DETX and DETY for each event in the final _common_clean file
| Quadrant A | 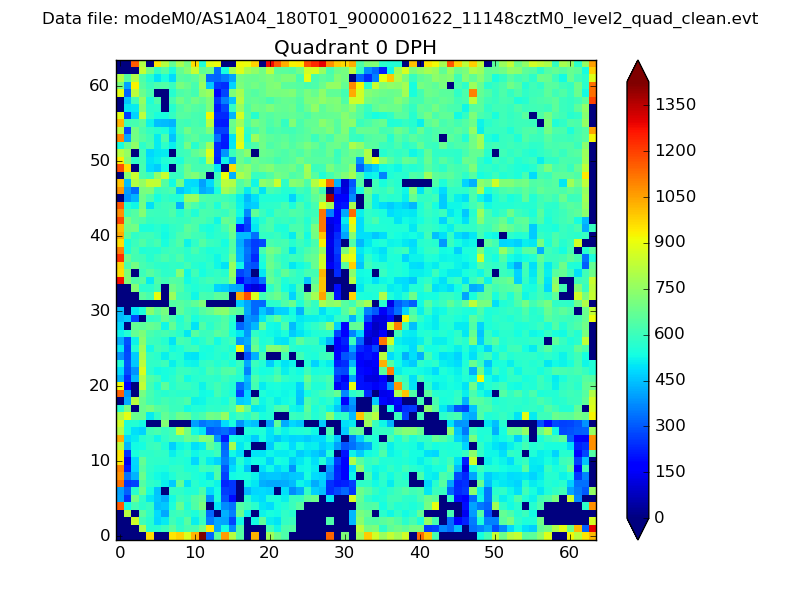 |
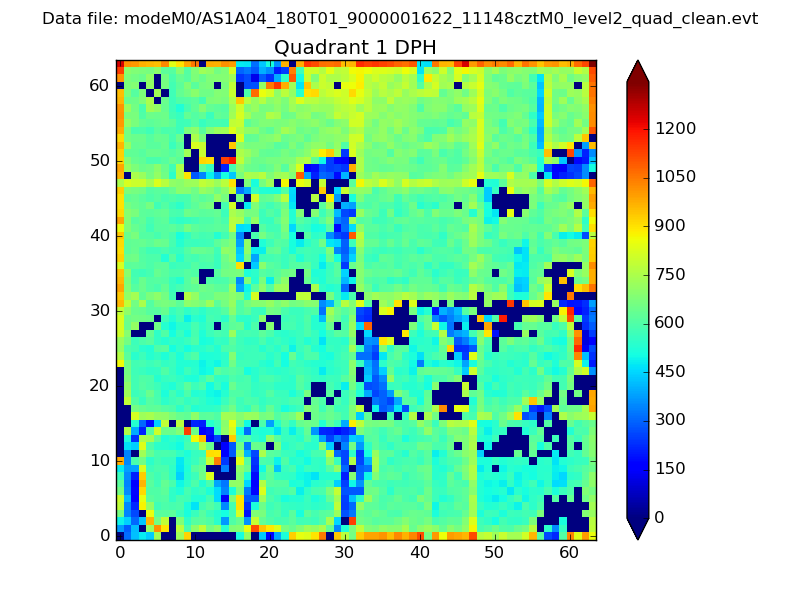 |
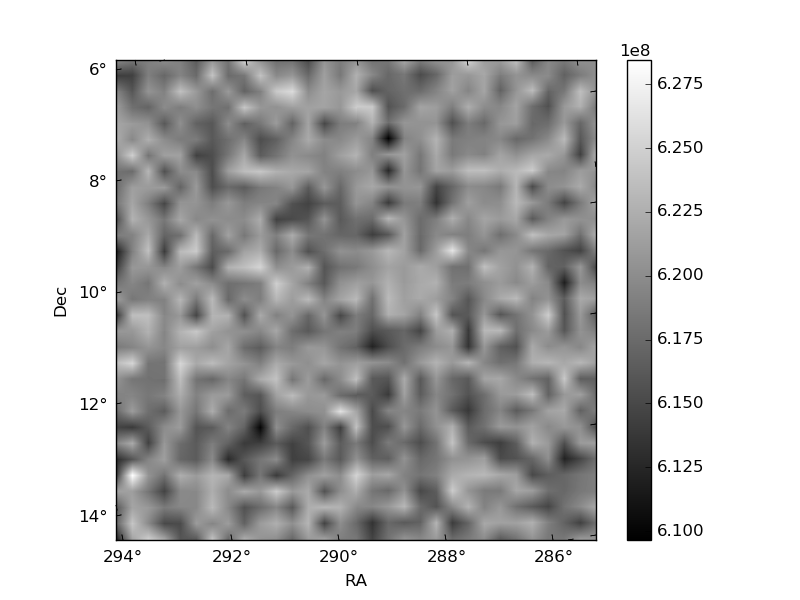
Quadrant B |
|---|---|---|---|
| Quadrant D | 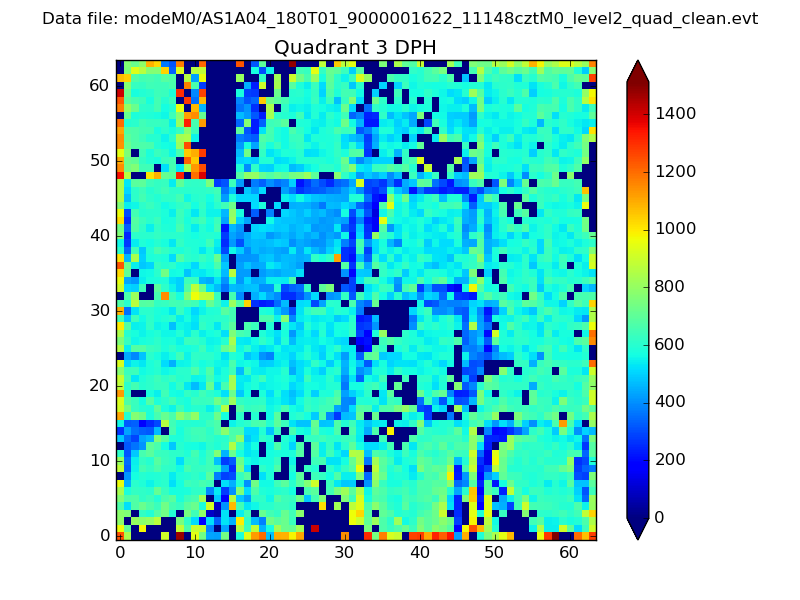 |
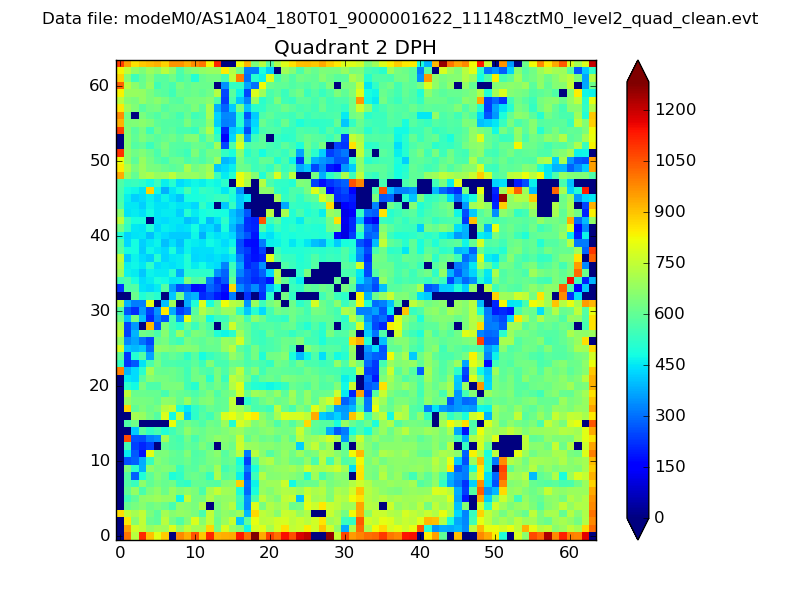 |
Quadrant C |
| Plot type | Count rate plots | Images |
|---|---|---|
| Comparison with Poisson distribution Blue bars denote a histogram of data divided into 1 sec bins. Red curve is a Poisson curve with rate = median count rate of data. |
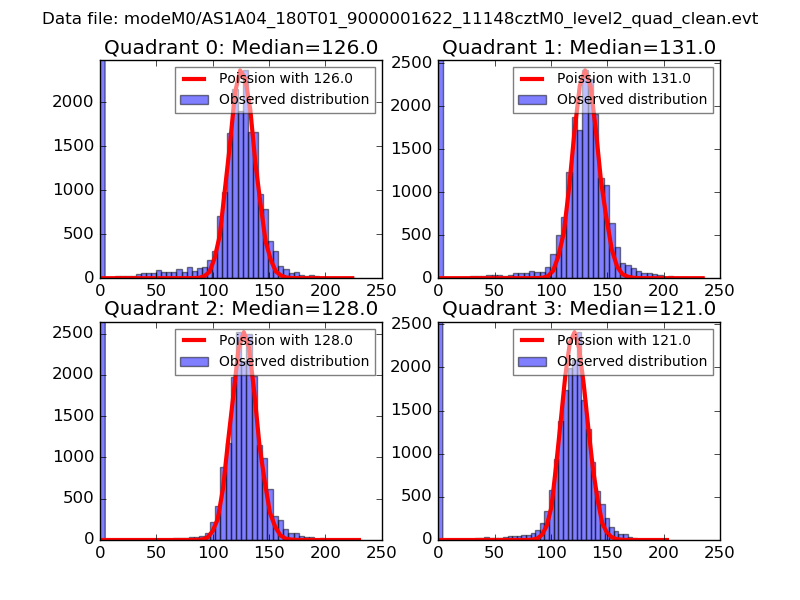 |
 |
| Quadrant-wise count rates Data is divided into 100 sec bins |
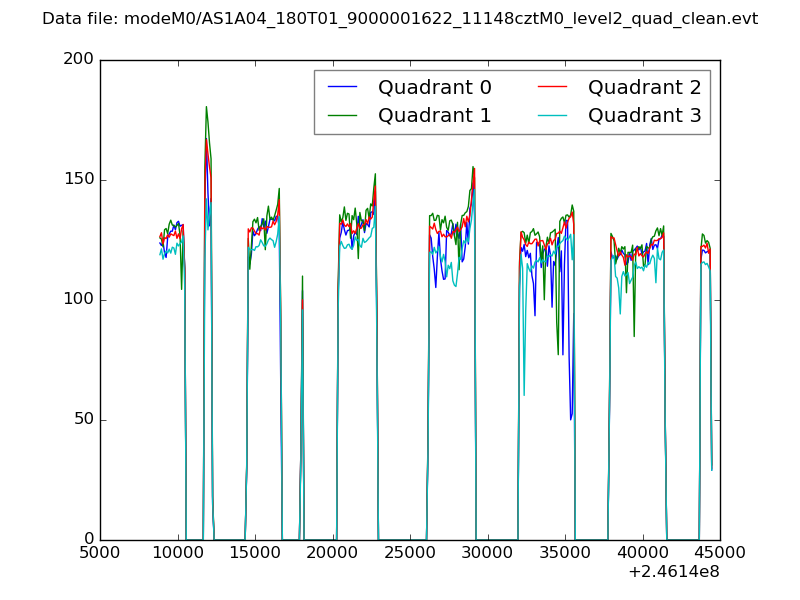 |
|
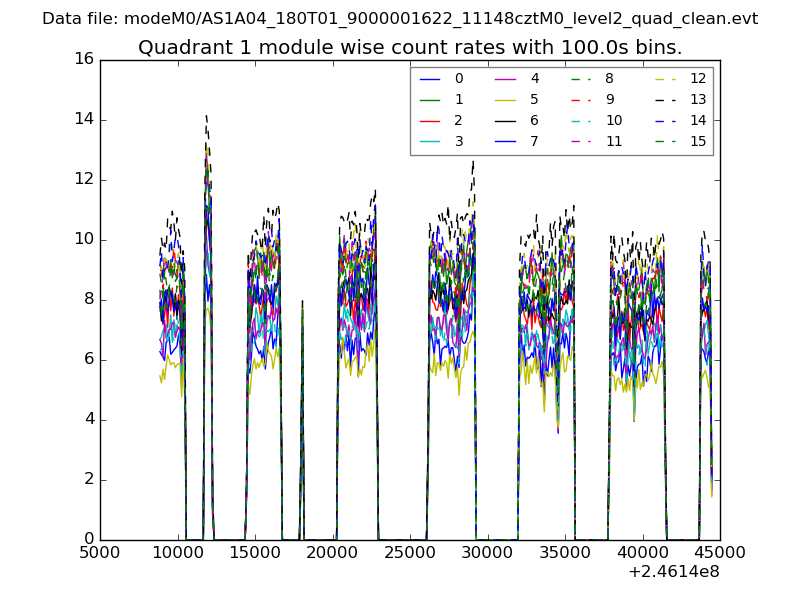
| Module-wise count rates for Quadrant A Data is divided into 100 sec bins |
 |
 |
| Module-wise count rates for Quadrant B Data is divided into 100 sec bins |
 |
 |
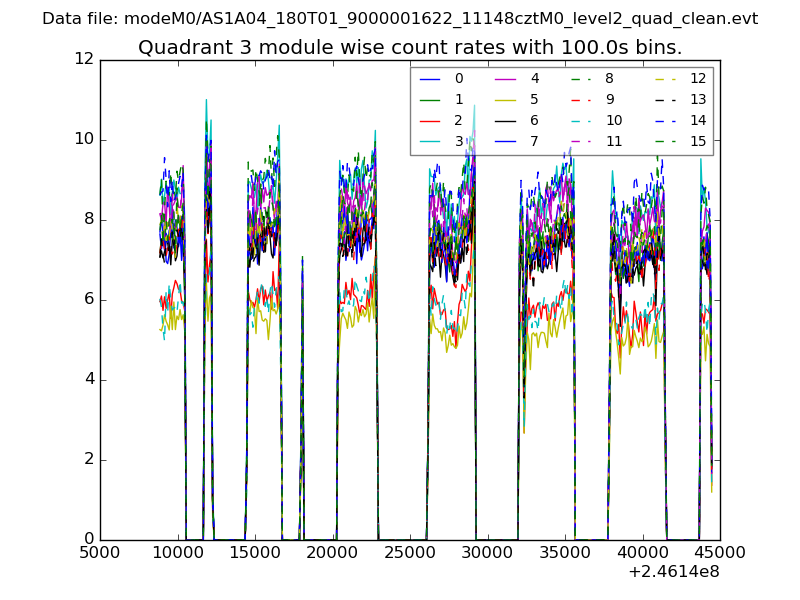
| Module-wise count rates for Quadrant C Data is divided into 100 sec bins |
 |
 |
| Module-wise count rates for Quadrant D Data is divided into 100 sec bins |
 |
 |
| Parameter | Plot |
|---|---|
| CZT HV Monitor | 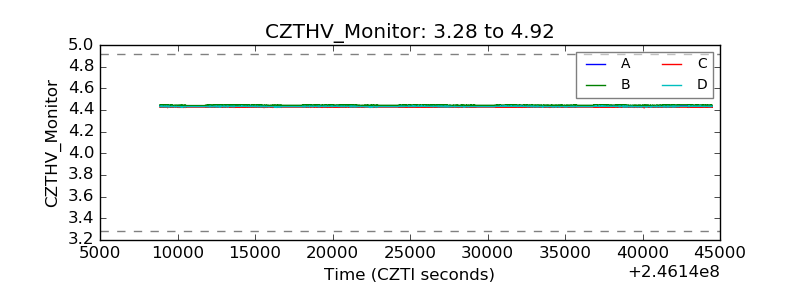 |
| D_VDD | 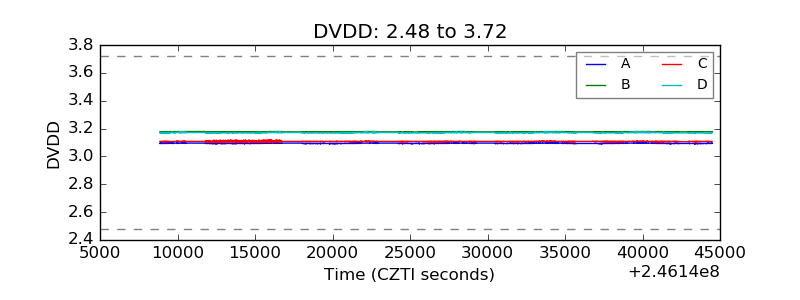 |
| Temperature 1 | 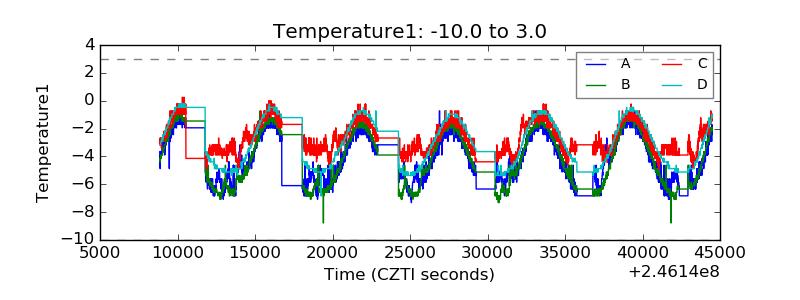 |
| Veto HV Monitor | 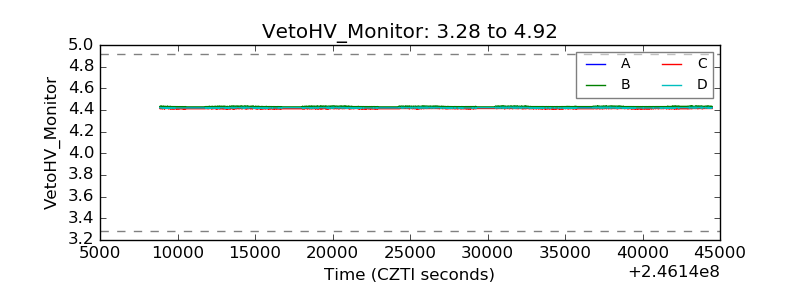 |
| Veto LLD |  |
| Alpha Counter | 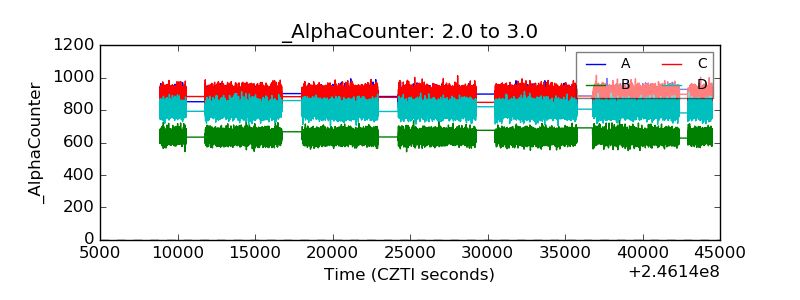 |
| _CPM_Rate | 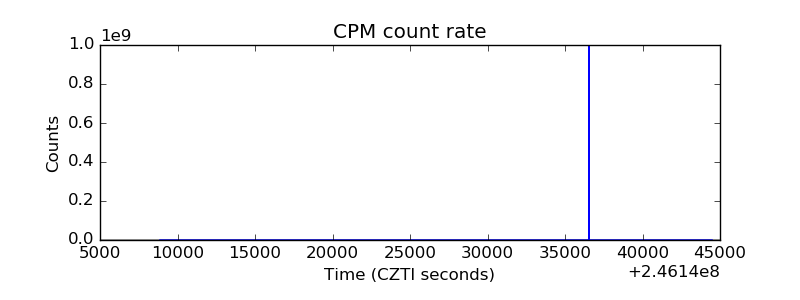 |
| CZT Counter | 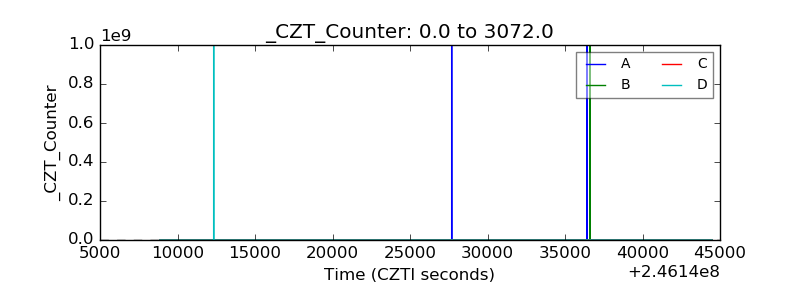 |
| +2.5 Volts monitor |  |
| +5 Volts monitor |  |
| _ROLL_ROT | 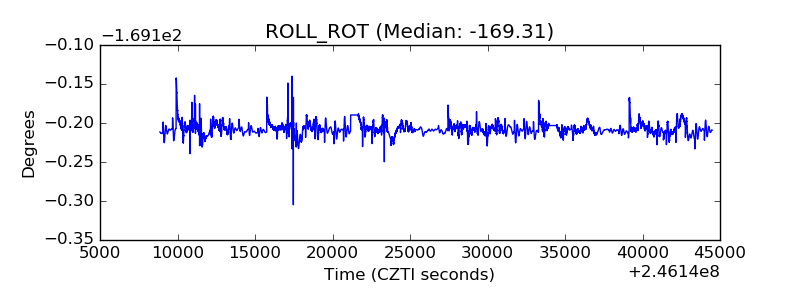 |
| _Roll_DEC | 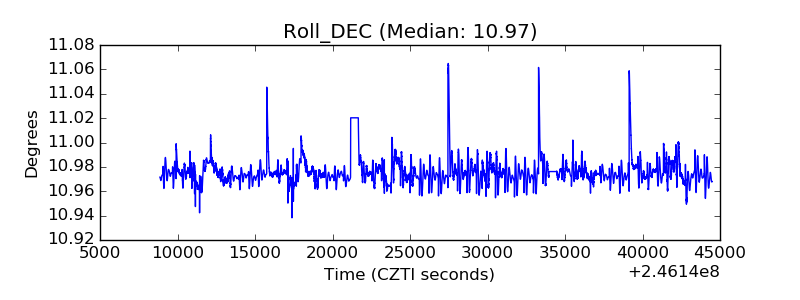 |
| _Roll_RA | 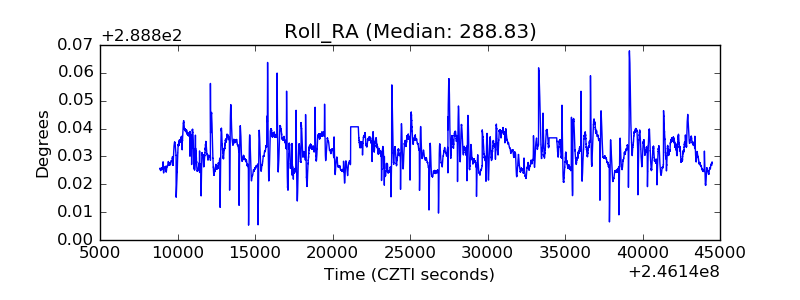 |
| Veto Counter |  |