| Param | Original file | Final file |
|---|---|---|
| Filename | modeM0/AS1A04_180T01_9000001622_11150cztM0_level2.evt | modeM0/AS1A04_180T01_9000001622_11150cztM0_level2_quad_clean.evt |
| Size (bytes) | 561,752,640 | 80,075,520 |
| Size | 535.7 MB | 76.4 MB |
| Events in quadrant A | 5,744,157 | 481,768 |
| Events in quadrant B | 4,212,536 | 515,785 |
| Events in quadrant C | 2,818,684 | 517,422 |
| Events in quadrant D | 3,826,003 | 486,276 |
| Mode M0 | |||
|---|---|---|---|
| Quadrant | BADHDUFLAG | Total packets | Discarded packets |
| A | 0 | 26294 | 5145 |
| B | 0 | 20314 | 3841 |
| C | 0 | 15151 | 2305 |
| D | 0 | 18188 | 2726 |
| Mode M9 | |||
|---|---|---|---|
| Quadrant | BADHDUFLAG | Total packets | Discarded packets |
| A | 1 | 273359709408 | 0 |
| B | 1 | -1 | -1 |
| C | 1 | -1 | -1 |
| D | 1 | -1 | -1 |
| Mode SS | |||
|---|---|---|---|
| Quadrant | BADHDUFLAG | Total packets | Discarded packets |
| A | 0 | 147 | 27 |
| B | 0 | 145 | 25 |
| C | 0 | 145 | 29 |
| D | 0 | 145 | 19 |
| Quadrant | Total seconds | Saturated seconds | Saturation percentage |
|---|---|---|---|
| A | 5946 | 936 | 15.741675% |
| B | 6046 | 584 | 9.659279% |
| C | 6139 | 163 | 2.655156% |
| D | 6113 | 283 | 4.629478% |
Noise dominated data is calculated using 1-second bins in cleaned event files. If a bin has >2000 counts, and if more than 50% of those come from <1% of pixels, then it is considered to be noise-dominated and hence unusable.
| Quadrant | # 1 sec bins | Bins with >0 counts | Bins with >2000 counts | High rate bins dominated by noise | Noise dominated (total time) | Noise dominated (detector-on time) | Marked lightcurve |
|---|---|---|---|---|---|---|---|
| A | 7494 | 6230 | 450 | 450 | 6.00% | 7.22% | 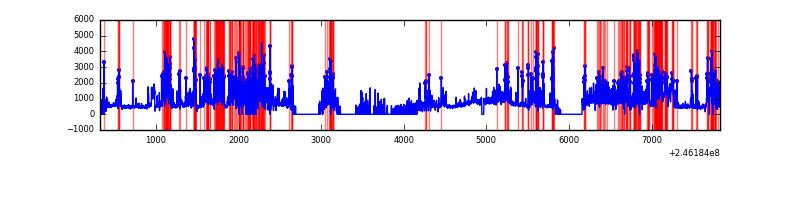 |
| B | 7503 | 6312 | 153 | 153 | 2.04% | 2.42% | 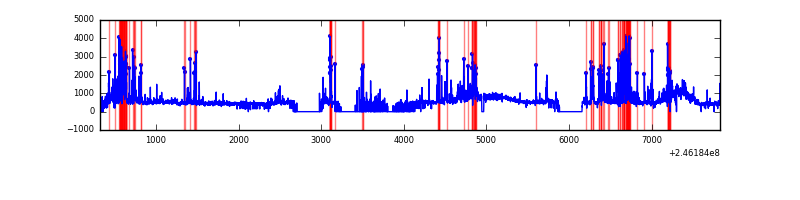 |
| C | 7504 | 6428 | 1 | 1 | 0.01% | 0.02% | 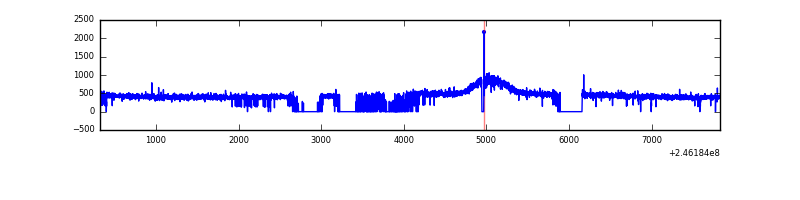 |
| D | 7497 | 6405 | 89 | 89 | 1.19% | 1.39% | 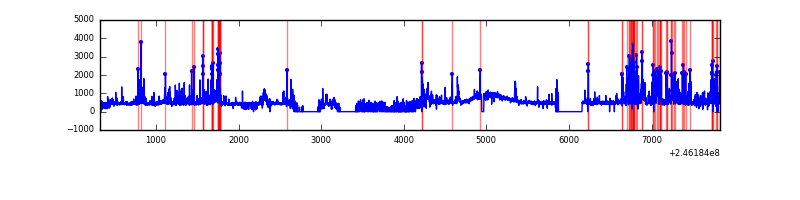 |
Top three noisy pixels from each quadrant. If the there are fewer than three noisy pixels in the level2.evt file, extra rows are filled as -1
| Pixel properties | Quadrant properties | ||||||
|---|---|---|---|---|---|---|---|
| Quadrant | DetID | PixID | Counts | Sigma | Mean | Median | Sigma |
| A | 8 | 5 | 2026517 | 14070.3 | 696 | 678 | 144.0 |
| A | 14 | 238 | 835428 | 5797.69 | 696 | 678 | 144.0 |
| A | 8 | 15 | 161243 | 1115.19 | 696 | 678 | 144.0 |
| B | 4 | 239 | 627307 | 4461.3 | 721 | 704 | 140.5 |
| B | 10 | 16 | 536974 | 3818.15 | 721 | 704 | 140.5 |
| B | 15 | 204 | 82998 | 585.92 | 721 | 704 | 140.5 |
| C | 13 | 61 | 5318 | 27.14 | 721 | 722 | 169.4 |
| C | 9 | 204 | 3473 | 16.24 | 721 | 722 | 169.4 |
| C | 14 | 234 | 2306 | 9.35 | 721 | 722 | 169.4 |
| D | 1 | 52 | 453878 | 2572.68 | 719 | 696 | 176.2 |
| D | 14 | 34 | 121166 | 683.9 | 719 | 696 | 176.2 |
| D | 13 | 172 | 110705 | 624.51 | 719 | 696 | 176.2 |
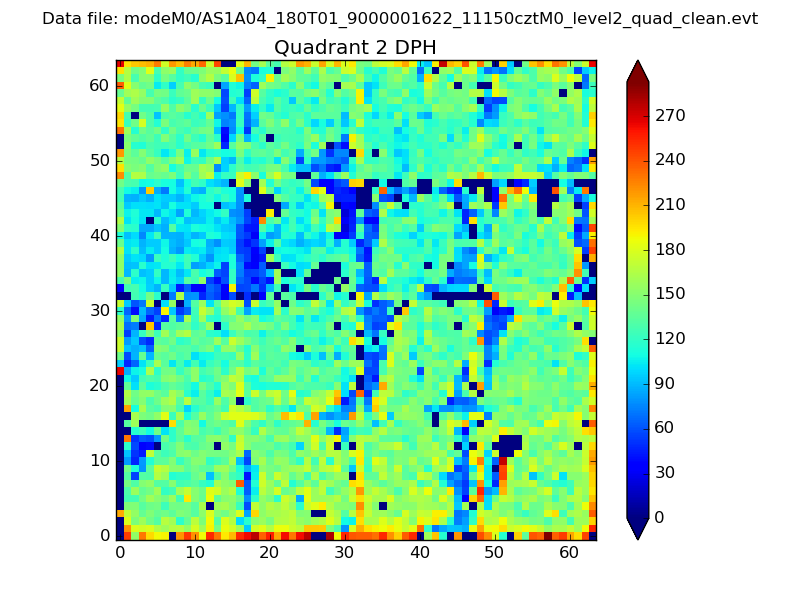
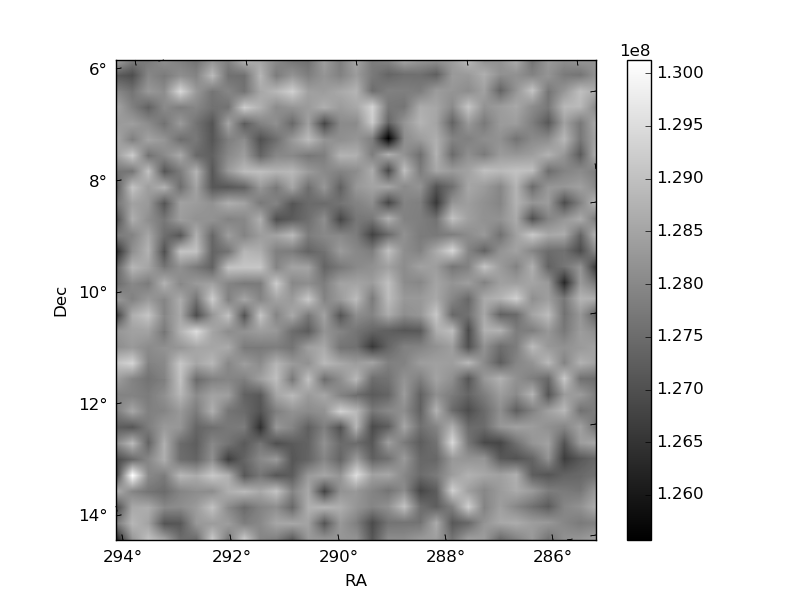
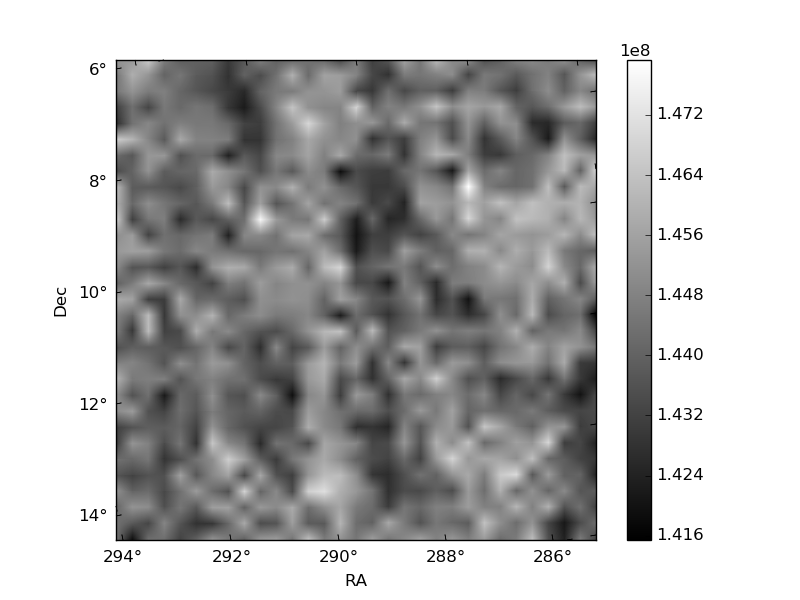
Histogram calculated using DETX and DETY for each event in the final _common_clean file
| Quadrant A | 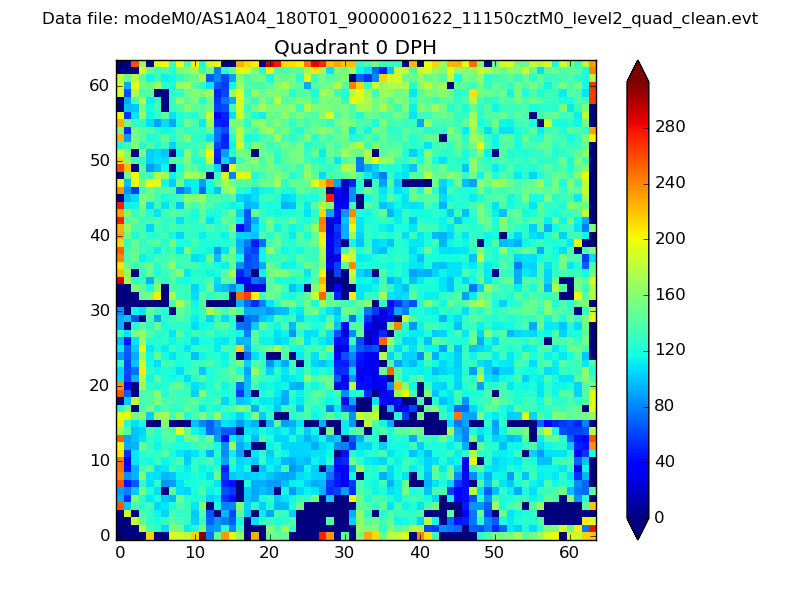 |
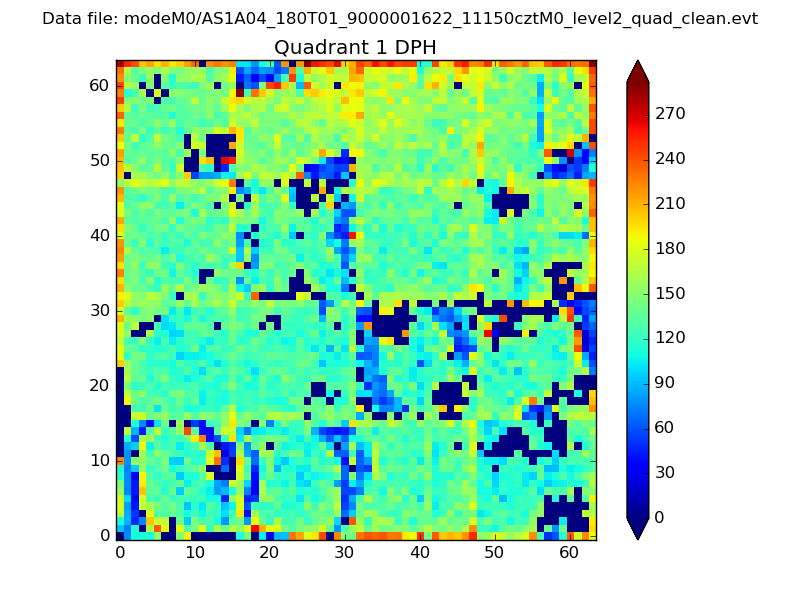 |
Quadrant B |
|---|---|---|---|
| Quadrant D | 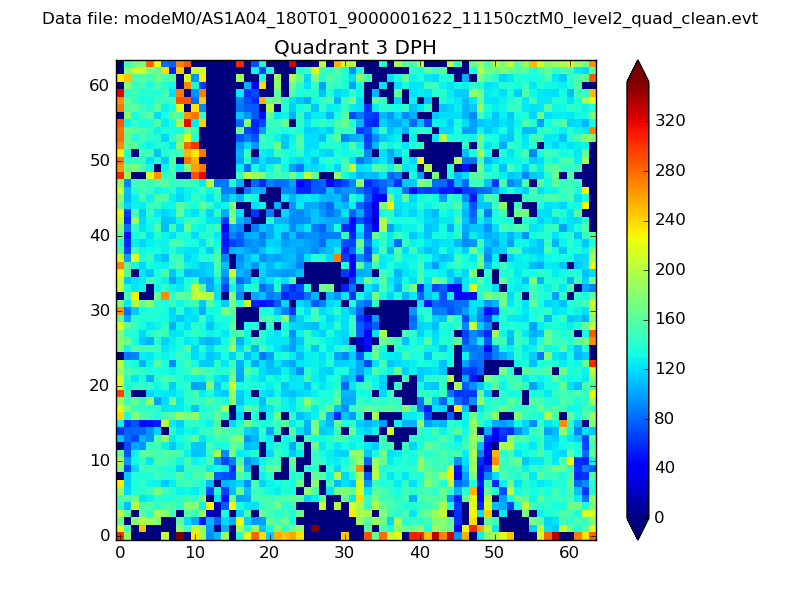 |
 |
Quadrant C |
| Plot type | Count rate plots | Images |
|---|---|---|
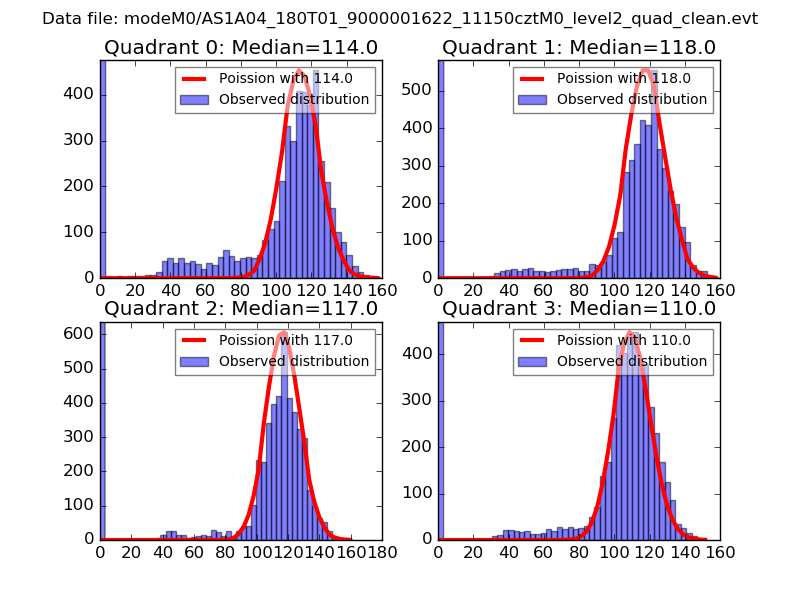
| Comparison with Poisson distribution Blue bars denote a histogram of data divided into 1 sec bins. Red curve is a Poisson curve with rate = median count rate of data. |
 |
 |
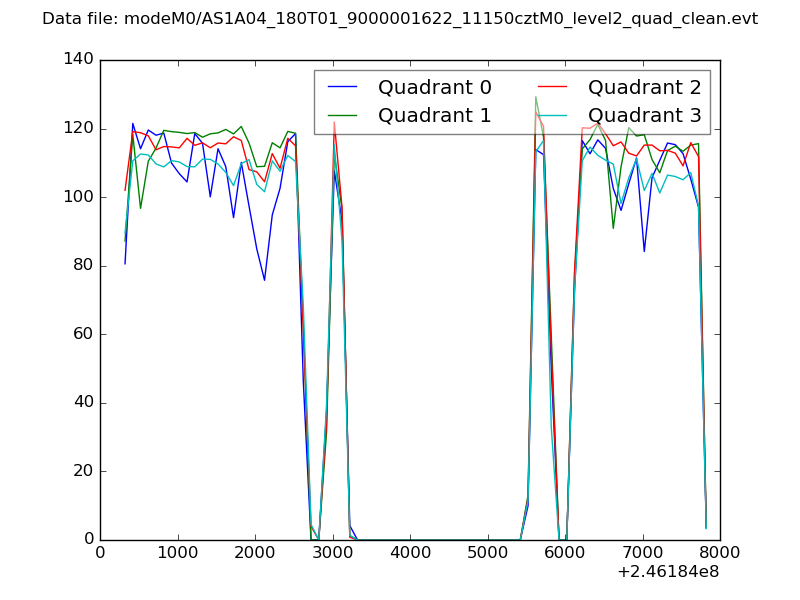
| Quadrant-wise count rates Data is divided into 100 sec bins |
 |
|
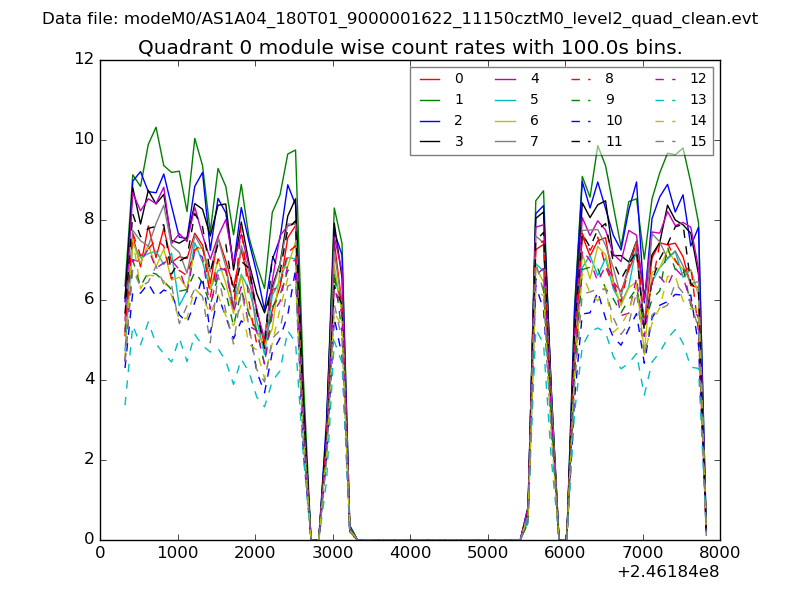
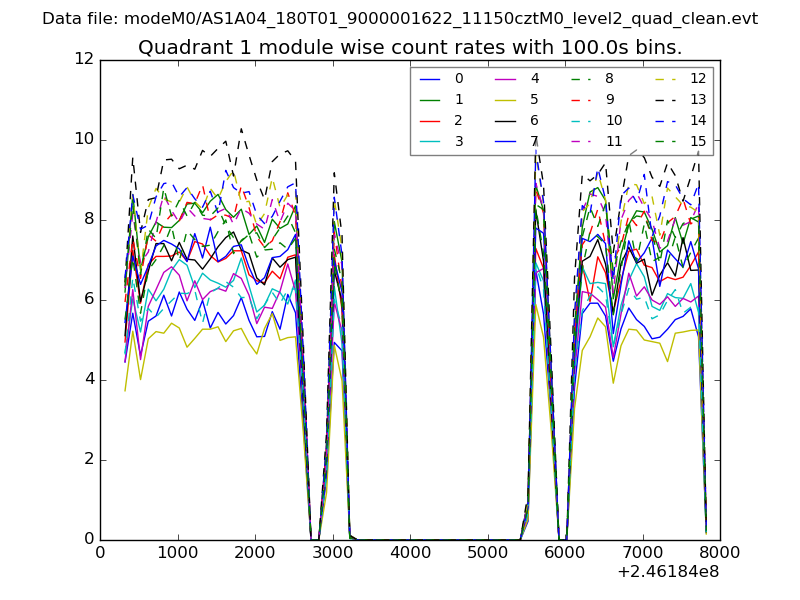
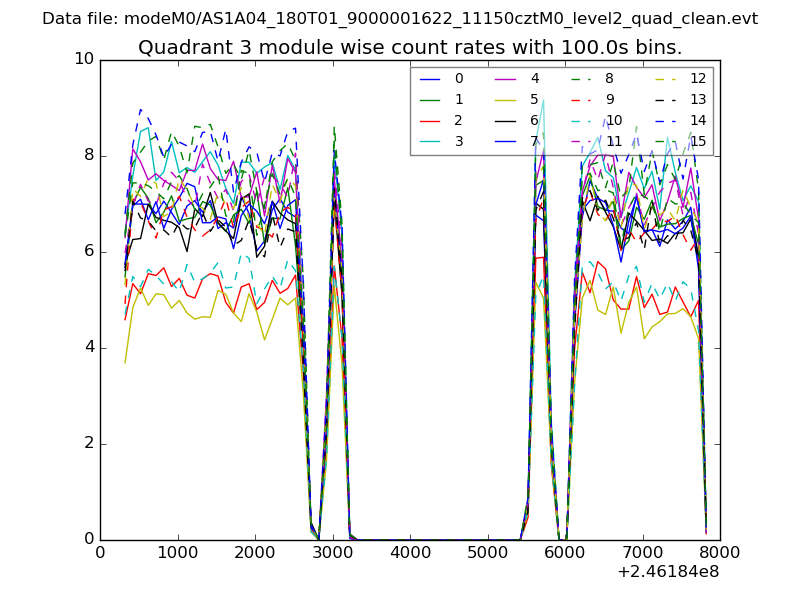
| Module-wise count rates for Quadrant A Data is divided into 100 sec bins |
 |
 |
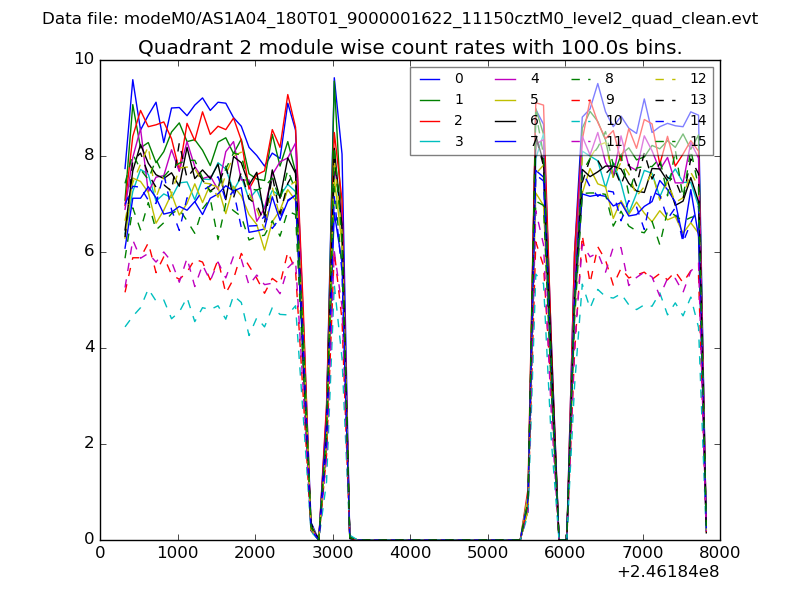
| Module-wise count rates for Quadrant B Data is divided into 100 sec bins |
 |
 |
| Module-wise count rates for Quadrant C Data is divided into 100 sec bins |
 |
 |
| Module-wise count rates for Quadrant D Data is divided into 100 sec bins |
 |
 |
| Parameter | Plot |
|---|---|
| CZT HV Monitor | 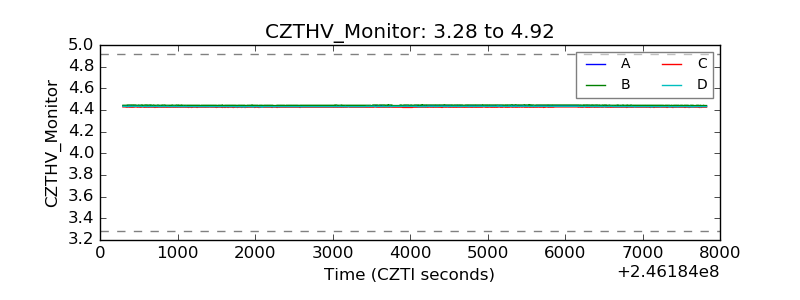 |
| D_VDD | 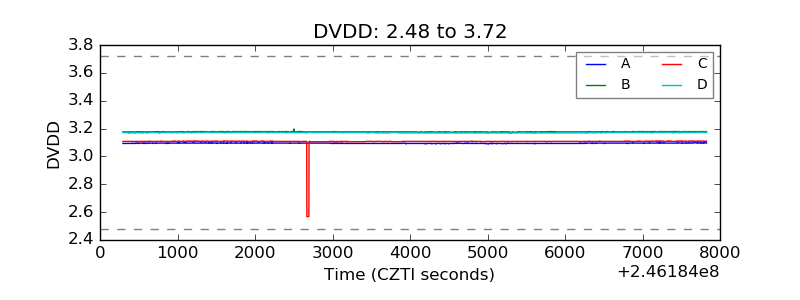 |
| Temperature 1 | 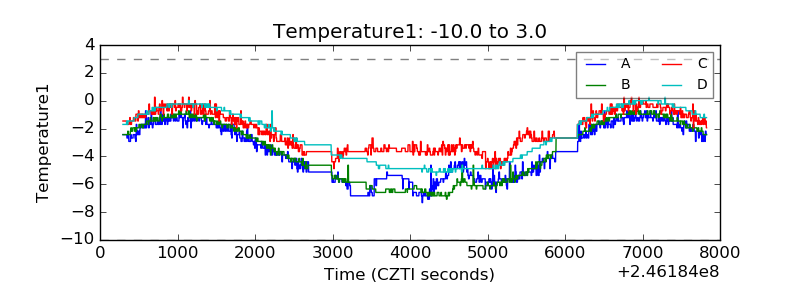 |
| Veto HV Monitor | 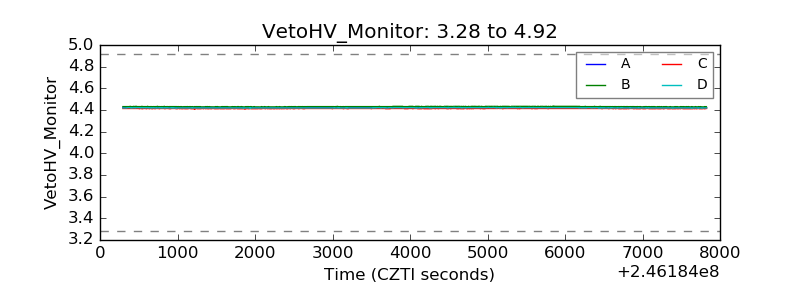 |
| Veto LLD | 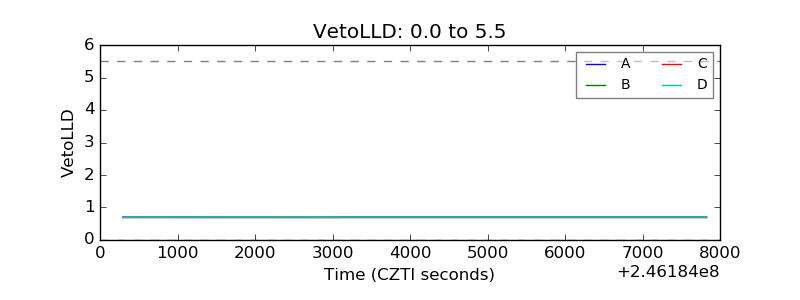 |
| Alpha Counter | 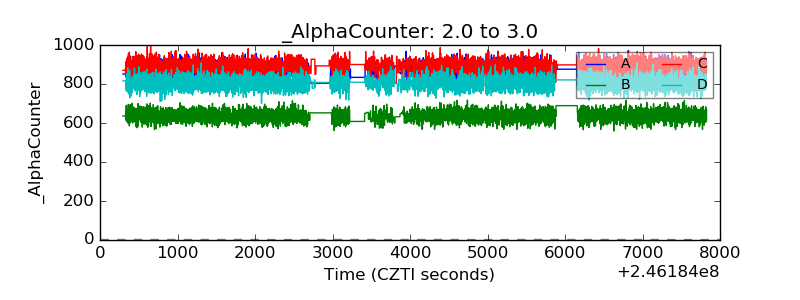 |
| _CPM_Rate | 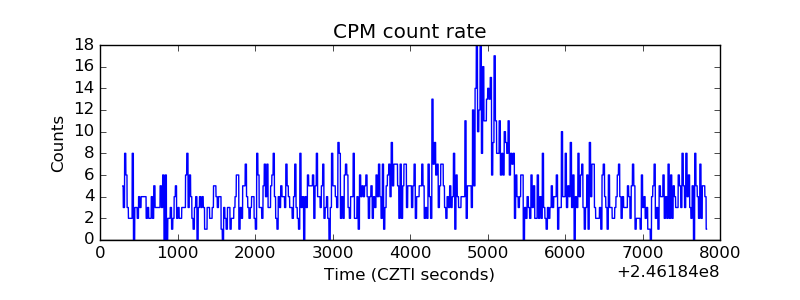 |
| CZT Counter | 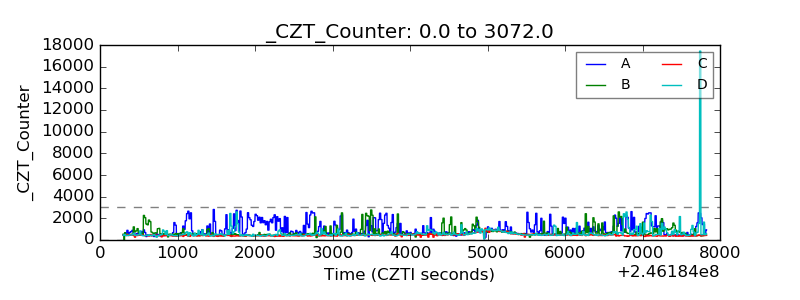 |
| +2.5 Volts monitor |  |
| +5 Volts monitor |  |
| _ROLL_ROT | 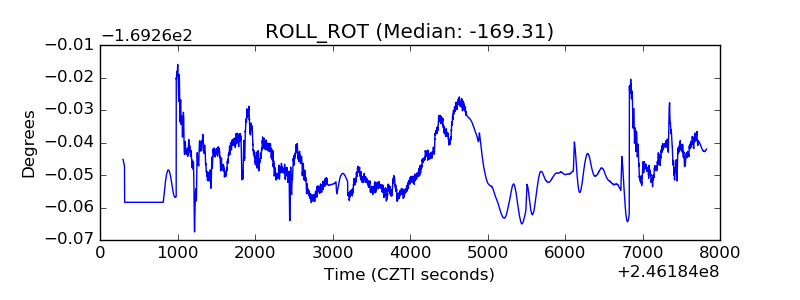 |
| _Roll_DEC | 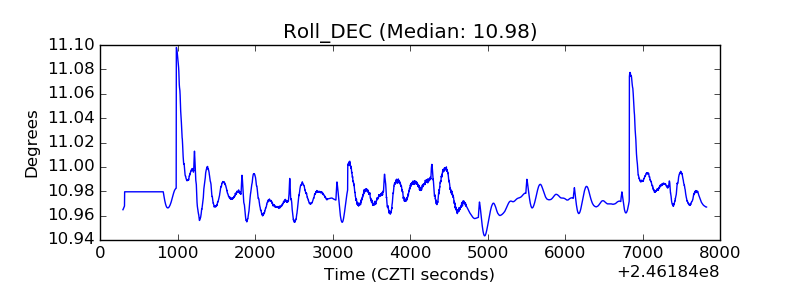 |
| _Roll_RA | 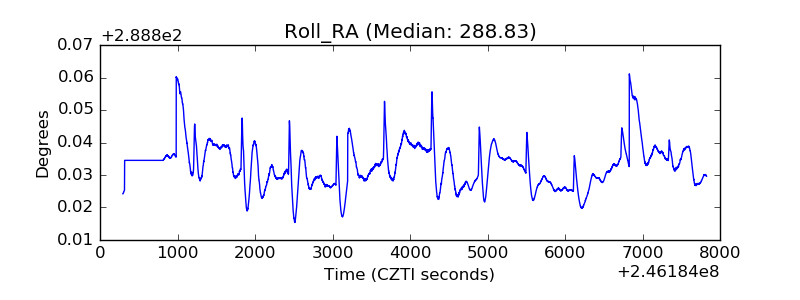 |
| Veto Counter | 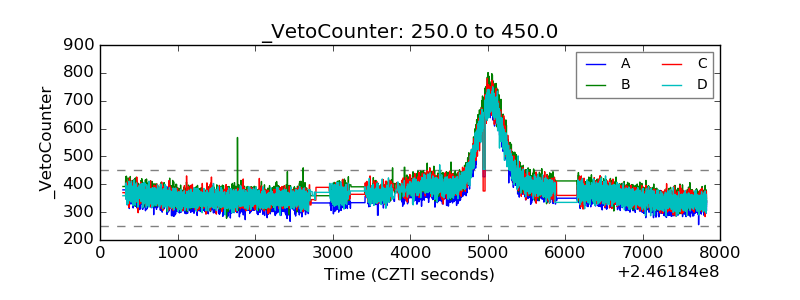 |