| Param | Original file | Final file |
|---|---|---|
| Filename | modeM0/AS1A04_180T01_9000001622_11154cztM0_level2.evt | modeM0/AS1A04_180T01_9000001622_11154cztM0_level2_quad_clean.evt |
| Size (bytes) | 626,175,360 | 82,307,520 |
| Size | 597.2 MB | 78.5 MB |
| Events in quadrant A | 6,558,629 | 487,977 |
| Events in quadrant B | 4,708,828 | 527,799 |
| Events in quadrant C | 3,080,154 | 522,797 |
| Events in quadrant D | 4,164,727 | 488,986 |
| Mode M0 | |||
|---|---|---|---|
| Quadrant | BADHDUFLAG | Total packets | Discarded packets |
| A | 0 | 25734 | 1679 |
| B | 0 | 19054 | 735 |
| C | 0 | 14533 | 600 |
| D | 0 | 17605 | 777 |
| Mode SS | |||
|---|---|---|---|
| Quadrant | BADHDUFLAG | Total packets | Discarded packets |
| A | 0 | 140 | 8 |
| B | 0 | 140 | 6 |
| C | 0 | 140 | 4 |
| D | 0 | 140 | 6 |
| Quadrant | Total seconds | Saturated seconds | Saturation percentage |
|---|---|---|---|
| A | 6632 | 1051 | 15.847407% |
| B | 6676 | 651 | 9.751348% |
| C | 6678 | 163 | 2.440851% |
| D | 6655 | 301 | 4.522915% |
Noise dominated data is calculated using 1-second bins in cleaned event files. If a bin has >2000 counts, and if more than 50% of those come from <1% of pixels, then it is considered to be noise-dominated and hence unusable.
| Quadrant | # 1 sec bins | Bins with >0 counts | Bins with >2000 counts | High rate bins dominated by noise | Noise dominated (total time) | Noise dominated (detector-on time) | Marked lightcurve |
|---|---|---|---|---|---|---|---|
| A | 7012 | 6682 | 582 | 582 | 8.30% | 8.71% | 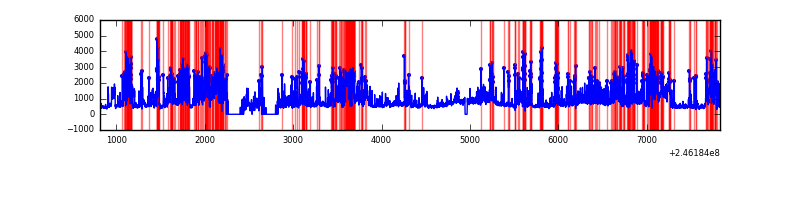 |
| B | 7012 | 6732 | 210 | 210 | 2.99% | 3.12% | 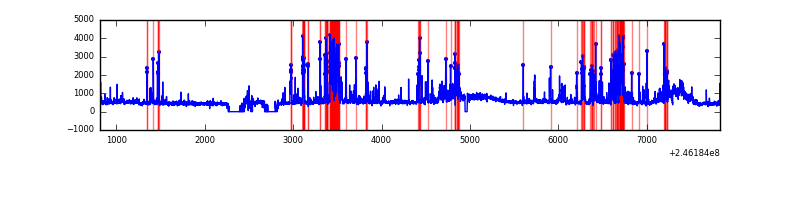 |
| C | 7012 | 6725 | 1 | 1 | 0.01% | 0.01% | 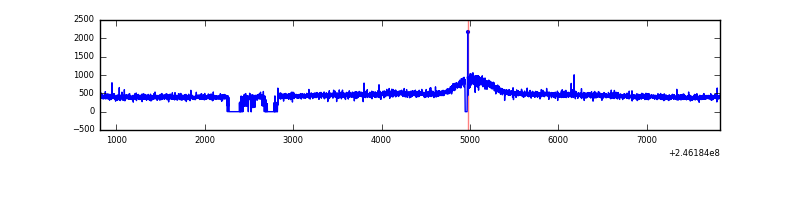 |
| D | 7012 | 6693 | 106 | 106 | 1.51% | 1.58% | 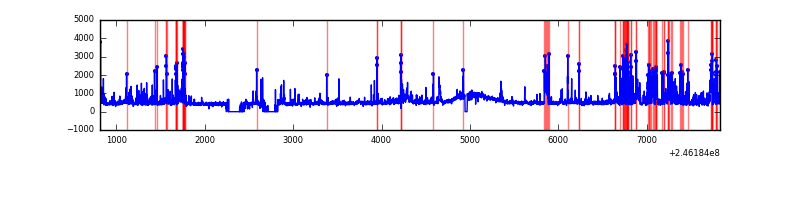 |
Top three noisy pixels from each quadrant. If the there are fewer than three noisy pixels in the level2.evt file, extra rows are filled as -1
| Pixel properties | Quadrant properties | ||||||
|---|---|---|---|---|---|---|---|
| Quadrant | DetID | PixID | Counts | Sigma | Mean | Median | Sigma |
| A | 8 | 5 | 2412277 | 15068.75 | 776 | 756 | 160.0 |
| A | 14 | 238 | 957532 | 5978.56 | 776 | 756 | 160.0 |
| A | 8 | 15 | 158841 | 987.82 | 776 | 756 | 160.0 |
| B | 10 | 16 | 830530 | 5378.21 | 795 | 776 | 154.3 |
| B | 4 | 239 | 556055 | 3599.15 | 795 | 776 | 154.3 |
| B | 15 | 204 | 83322 | 535.04 | 795 | 776 | 154.3 |
| C | 13 | 61 | 5809 | 27.15 | 788 | 790 | 184.9 |
| C | 9 | 204 | 3557 | 14.97 | 788 | 790 | 184.9 |
| C | 14 | 234 | 3311 | 13.64 | 788 | 790 | 184.9 |
| D | 1 | 52 | 488711 | 2567.15 | 783 | 758 | 190.1 |
| D | 2 | 14 | 160308 | 839.4 | 783 | 758 | 190.1 |
| D | 13 | 172 | 119332 | 623.82 | 783 | 758 | 190.1 |
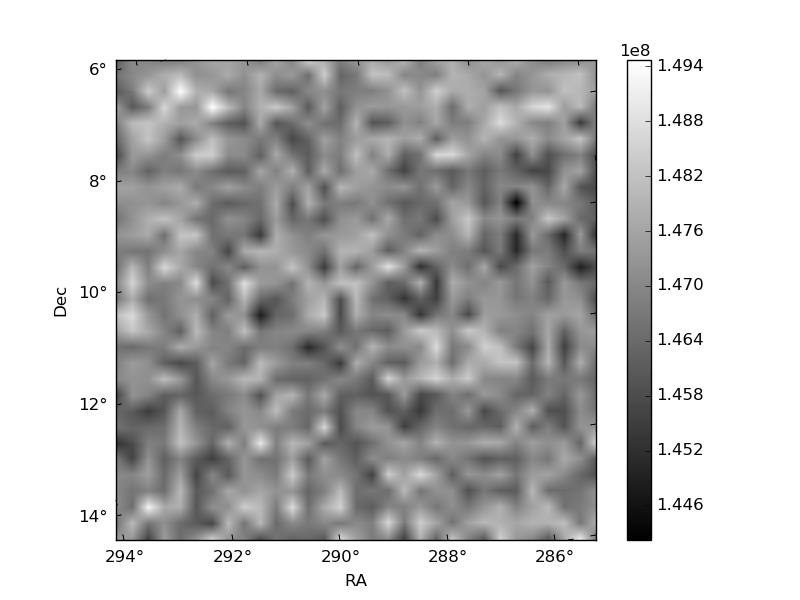
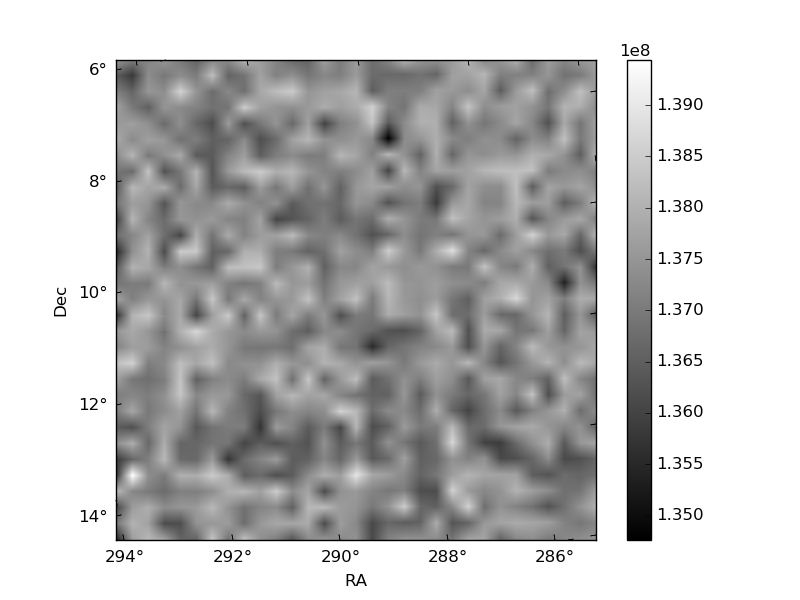
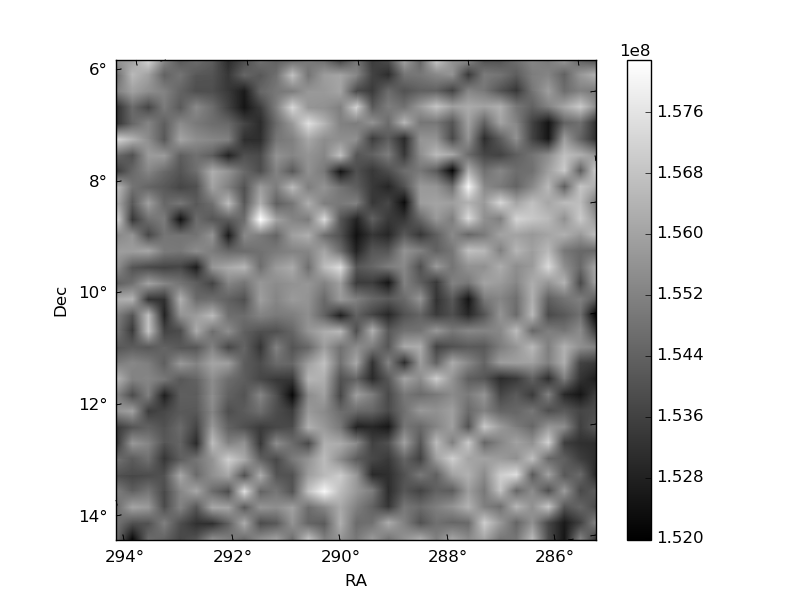
Histogram calculated using DETX and DETY for each event in the final _common_clean file
| Quadrant A |  |
 |
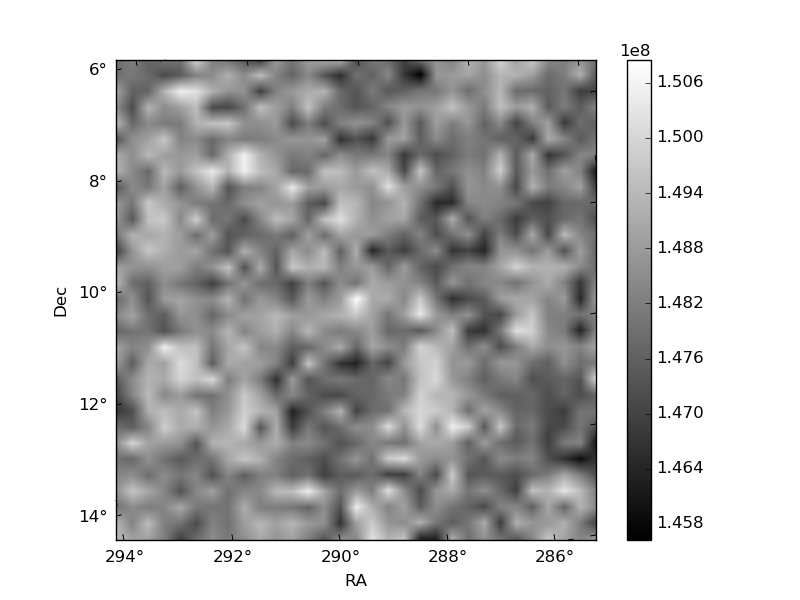
Quadrant B |
|---|---|---|---|
| Quadrant D |  |
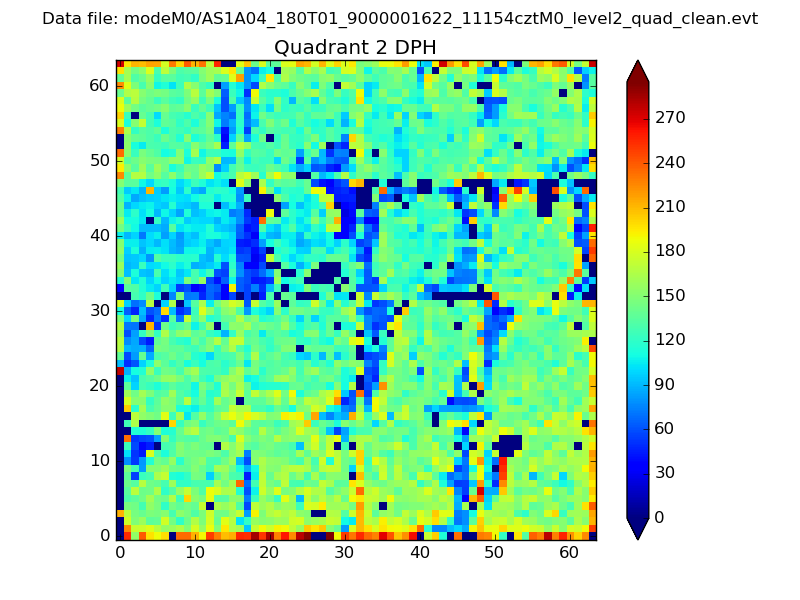 |
Quadrant C |
| Plot type | Count rate plots | Images |
|---|---|---|
| Comparison with Poisson distribution Blue bars denote a histogram of data divided into 1 sec bins. Red curve is a Poisson curve with rate = median count rate of data. |
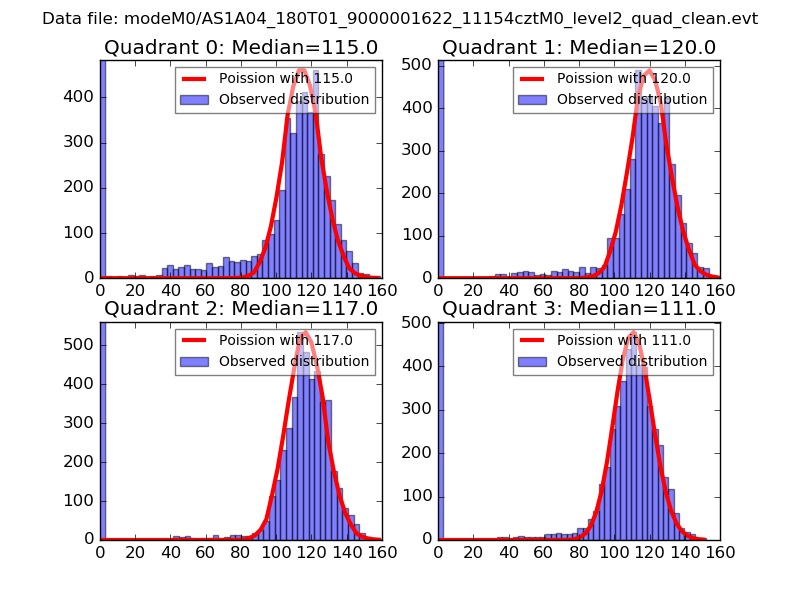 |
 |
| Quadrant-wise count rates Data is divided into 100 sec bins |
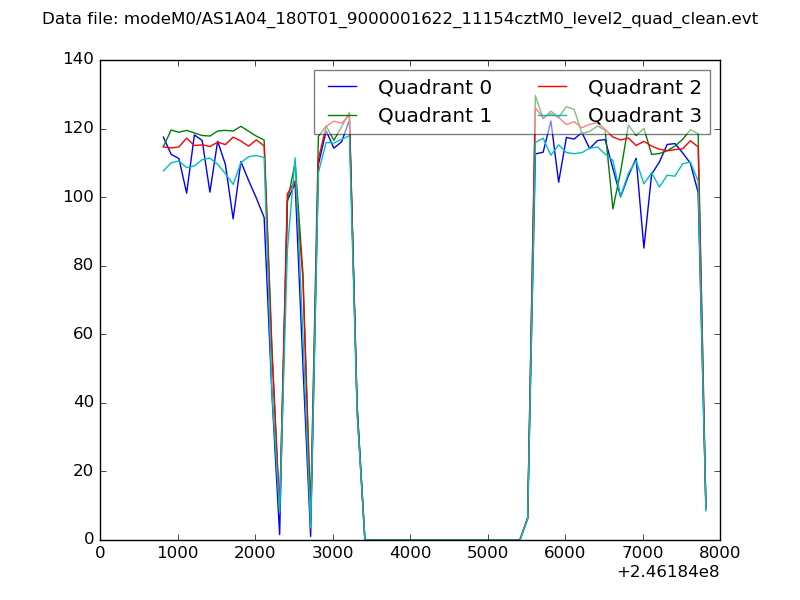 |
|
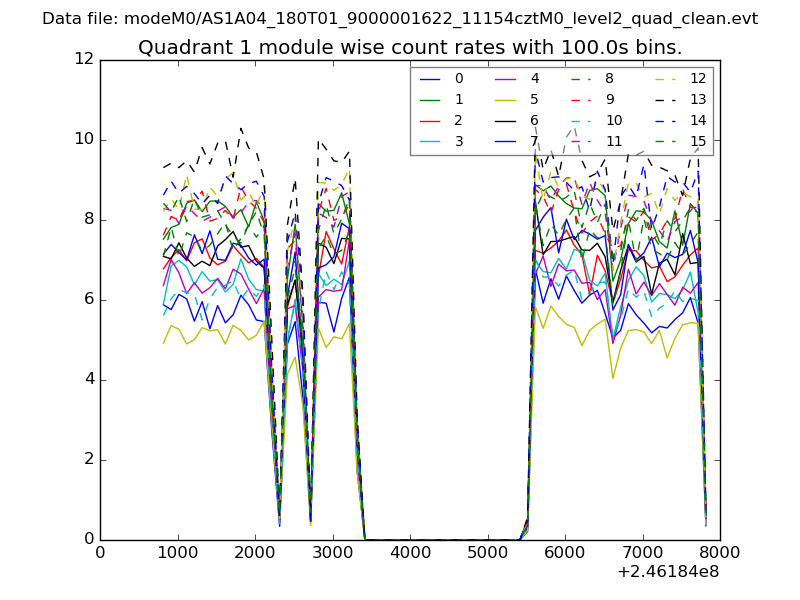
| Module-wise count rates for Quadrant A Data is divided into 100 sec bins |
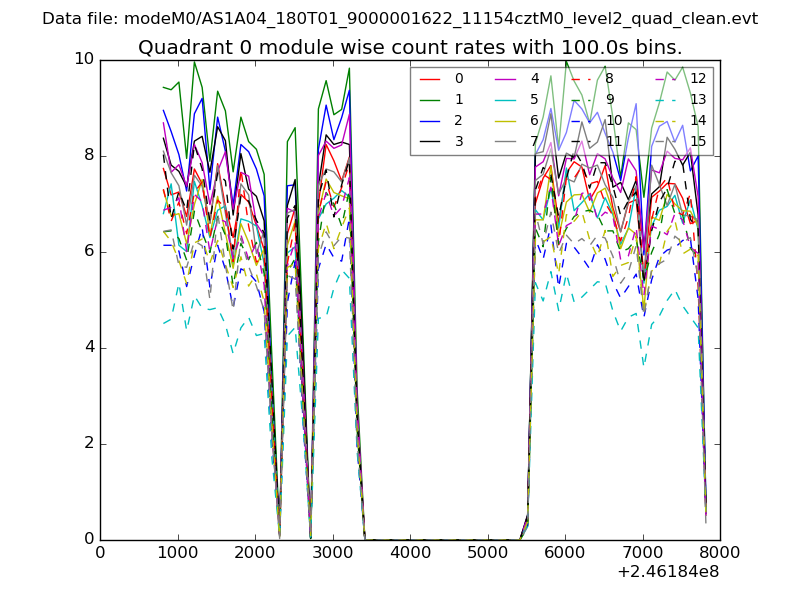 |
 |
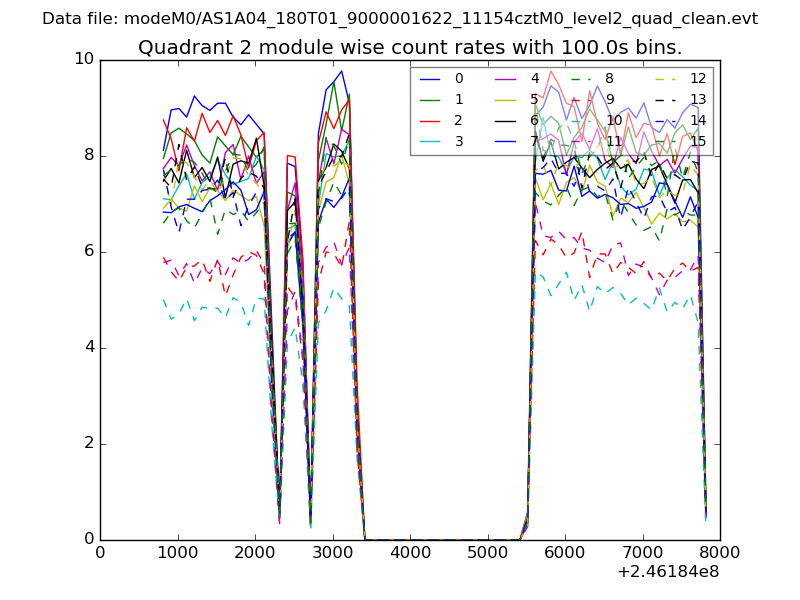
| Module-wise count rates for Quadrant B Data is divided into 100 sec bins |
 |
 |
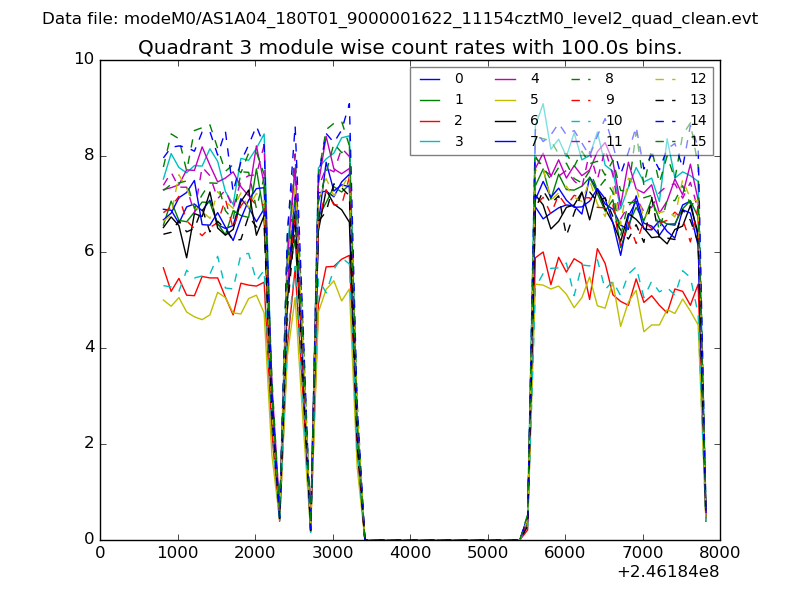
| Module-wise count rates for Quadrant C Data is divided into 100 sec bins |
 |
 |
| Module-wise count rates for Quadrant D Data is divided into 100 sec bins |
 |
 |
| Parameter | Plot |
|---|---|
| CZT HV Monitor | 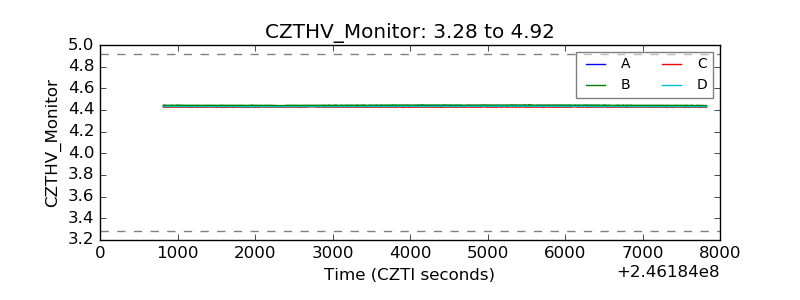 |
| D_VDD | 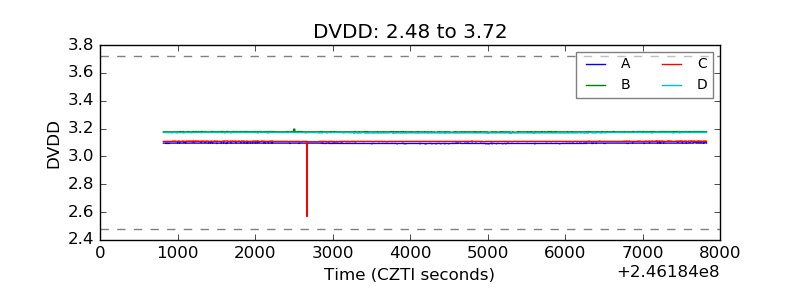 |
| Temperature 1 | 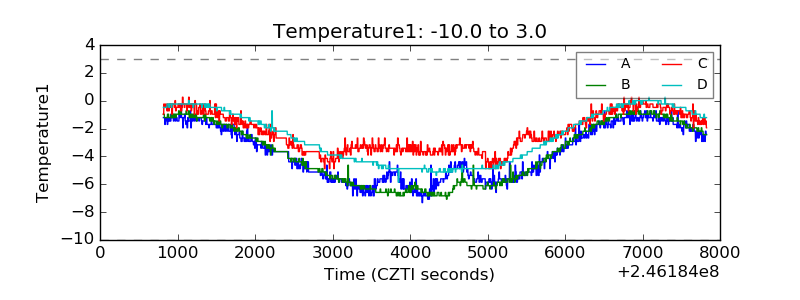 |
| Veto HV Monitor | 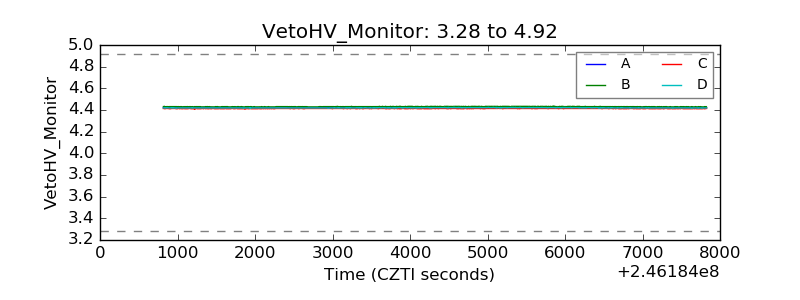 |
| Veto LLD |  |
| Alpha Counter | 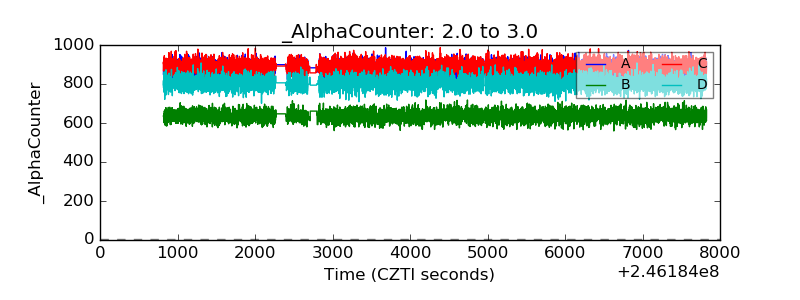 |
| _CPM_Rate | 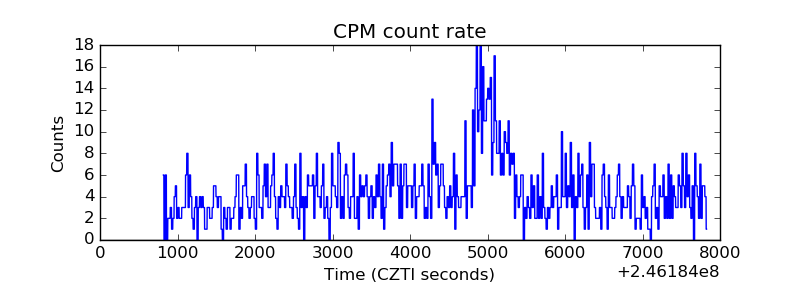 |
| CZT Counter |  |
| +2.5 Volts monitor | 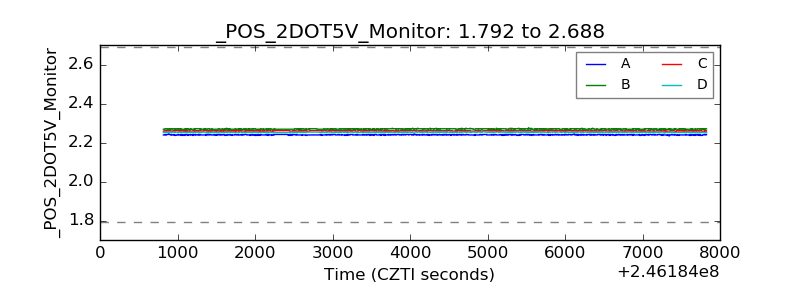 |
| +5 Volts monitor |  |
| _ROLL_ROT | 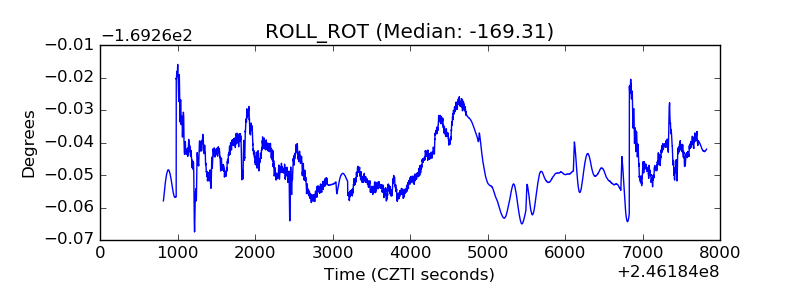 |
| _Roll_DEC | 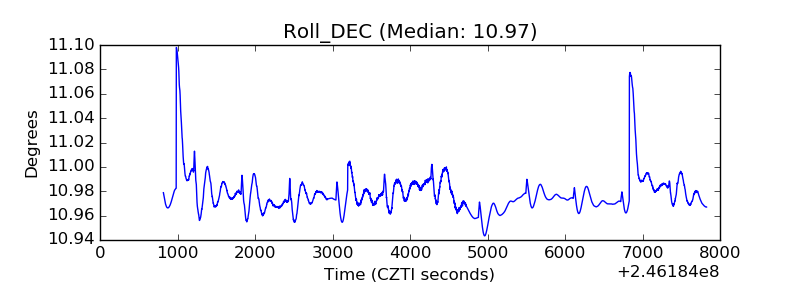 |
| _Roll_RA |  |
| Veto Counter | 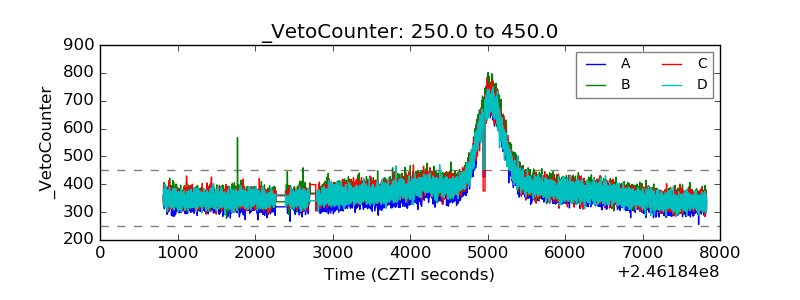 |