| Param | Original file | Final file |
|---|---|---|
| Filename | modeM0/AS1A04_058T01_9000001628cztM0_level2.fits | modeM0/AS1A04_058T01_9000001628cztM0_level2_quad_clean.evt |
| Size (bytes) | 283,752,000 | 267,606,720 |
| Size | 270.6 MB | 255.2 MB |
| Events in quadrant A | 1,637,350 | 1,440,219 |
| Events in quadrant B | 1,670,628 | 1,597,522 |
| Events in quadrant C | 1,733,606 | 1,595,543 |
| Events in quadrant D | 1,429,384 | 1,349,945 |
| Mode M0 | |||
|---|---|---|---|
| Quadrant | BADHDUFLAG | Total packets | Discarded packets |
| A | 0 | 89633 | 0 |
| B | 0 | 75259 | 0 |
| C | 0 | 63206 | 0 |
| D | 0 | 88360 | 0 |
| Mode SS | |||
|---|---|---|---|
| Quadrant | BADHDUFLAG | Total packets | Discarded packets |
| A | 0 | 626 | 0 |
| B | 0 | 630 | 0 |
| C | 0 | 634 | 0 |
| D | 0 | 630 | 0 |
| Mode M9 | |||
|---|---|---|---|
| Quadrant | BADHDUFLAG | Total packets | Discarded packets |
| A | 0 | 60 | 0 |
| B | 0 | 62 | 0 |
| C | 0 | 61 | 0 |
| D | 0 | 62 | 0 |
| Quadrant | Total seconds | Saturated seconds | Saturation percentage |
|---|---|---|---|
| A | 30711 | 2684 | 8.739540% |
| B | 30847 | 1068 | 3.462249% |
| C | 31028 | 121 | 0.389970% |
| D | 30743 | 1318 | 4.287155% |
Noise dominated data is calculated using 1-second bins in cleaned event files. If a bin has >2000 counts, and if more than 50% of those come from <1% of pixels, then it is considered to be noise-dominated and hence unusable.
| Quadrant | # 1 sec bins | Bins with >0 counts | Bins with >2000 counts | High rate bins dominated by noise | Noise dominated (total time) | Noise dominated (detector-on time) | Marked lightcurve |
|---|---|---|---|---|---|---|---|
| A | 46419 | 31176 | 0 | 0 | 0.00% | 0.00% | 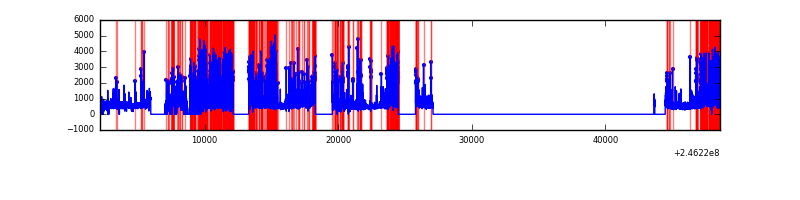 |
| B | 46419 | 31398 | 0 | 0 | 0.00% | 0.00% | 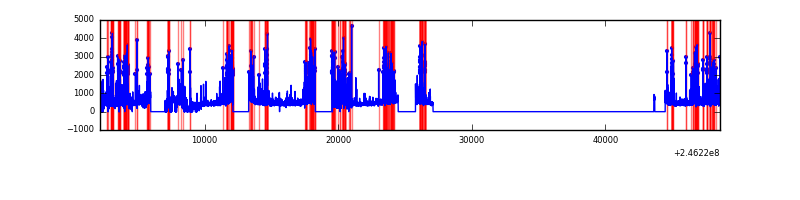 |
| C | 46419 | 31570 | 0 | 0 | 0.00% | 0.00% | 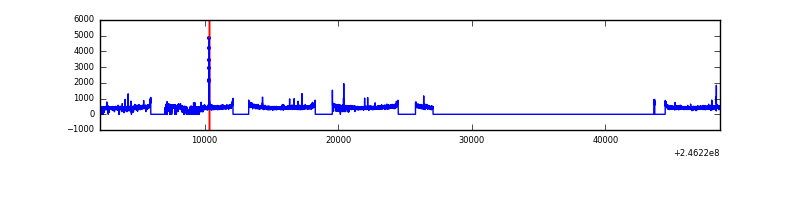 |
| D | 46419 | 31234 | 0 | 0 | 0.00% | 0.00% | 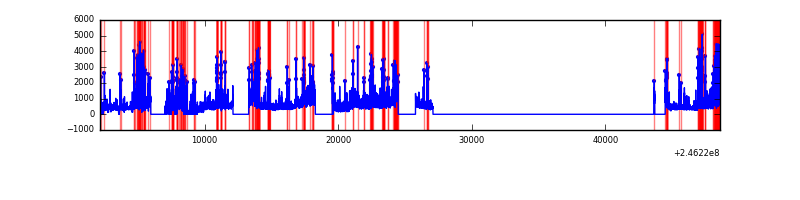 |
Top three noisy pixels from each quadrant. If the there are fewer than three noisy pixels in the level2.evt file, extra rows are filled as -1
| Pixel properties | Quadrant properties | ||||||
|---|---|---|---|---|---|---|---|
| Quadrant | DetID | PixID | Counts | Sigma | Mean | Median | Sigma |
| A | 0 | 29 | 1574 | 10.93 | 427 | 402 | 107.3 |
| A | 7 | 110 | 1297 | 8.34 | 427 | 402 | 107.3 |
| A | 9 | 19 | 1288 | 8.26 | 427 | 402 | 107.3 |
| B | 2 | 9 | 1543 | 12.51 | 442 | 423 | 89.5 |
| B | 12 | 226 | 1136 | 7.96 | 442 | 423 | 89.5 |
| B | 3 | 17 | 1119 | 7.77 | 442 | 423 | 89.5 |
| C | 1 | 81 | 1196 | 6.48 | 457 | 429 | 118.4 |
| C | 1 | 80 | 1187 | 6.4 | 457 | 429 | 118.4 |
| C | 1 | 65 | 1177 | 6.32 | 457 | 429 | 118.4 |
| D | 3 | 14 | 1100 | 6.5 | 407 | 370 | 112.2 |
| D | 6 | 231 | 1072 | 6.25 | 407 | 370 | 112.2 |
| D | 6 | 67 | 1056 | 6.11 | 407 | 370 | 112.2 |
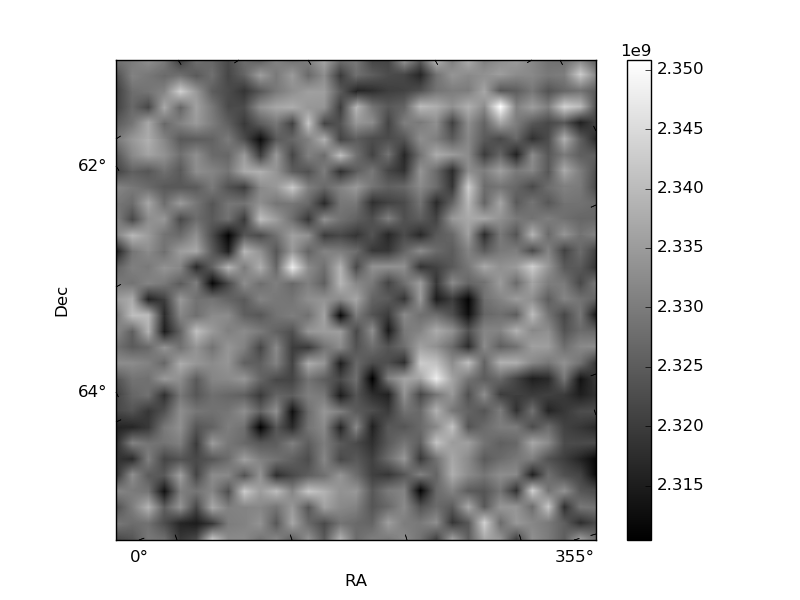
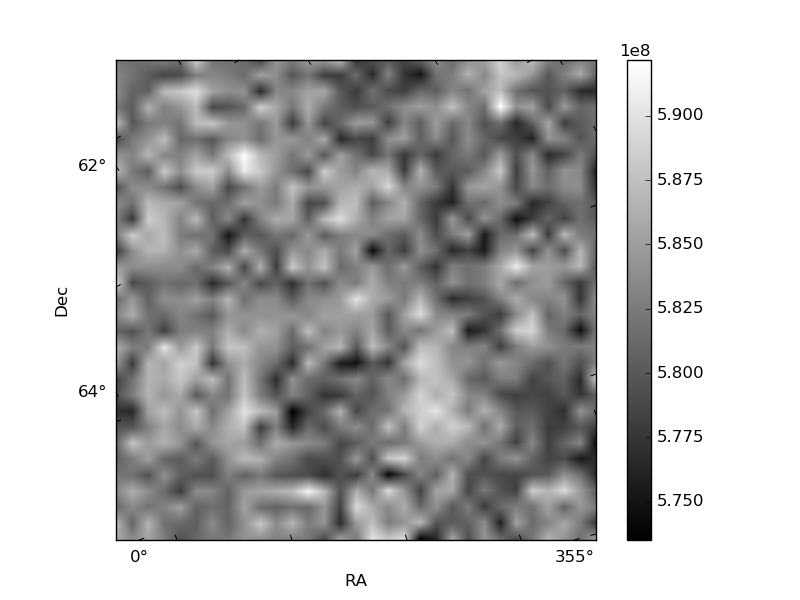
Histogram calculated using DETX and DETY for each event in the final _common_clean file
| Quadrant A | 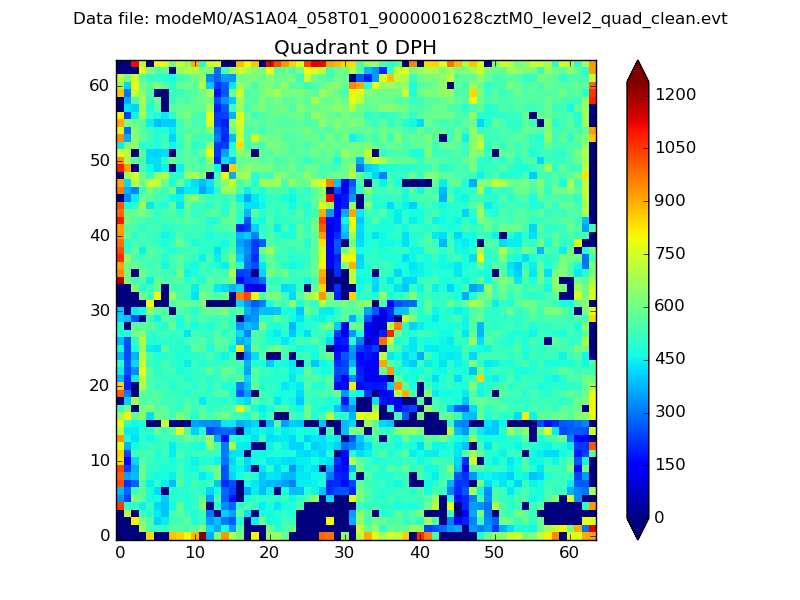 |
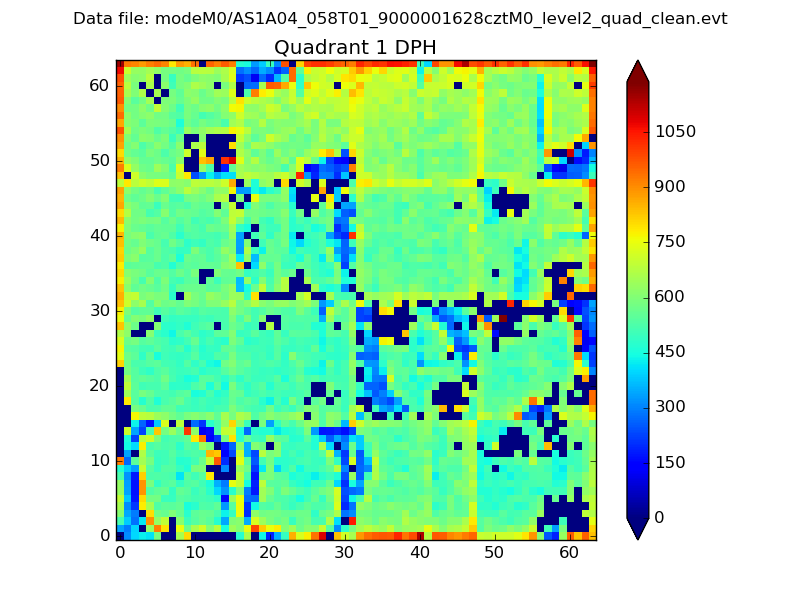 |
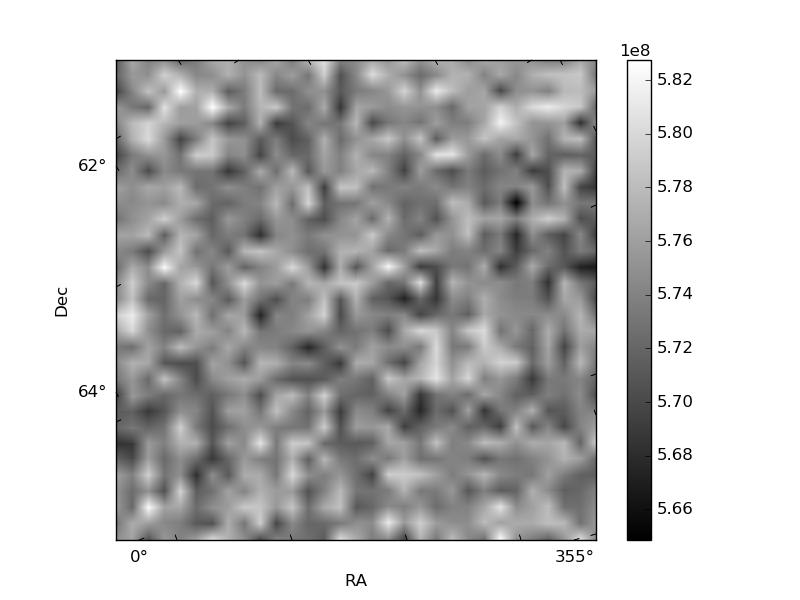
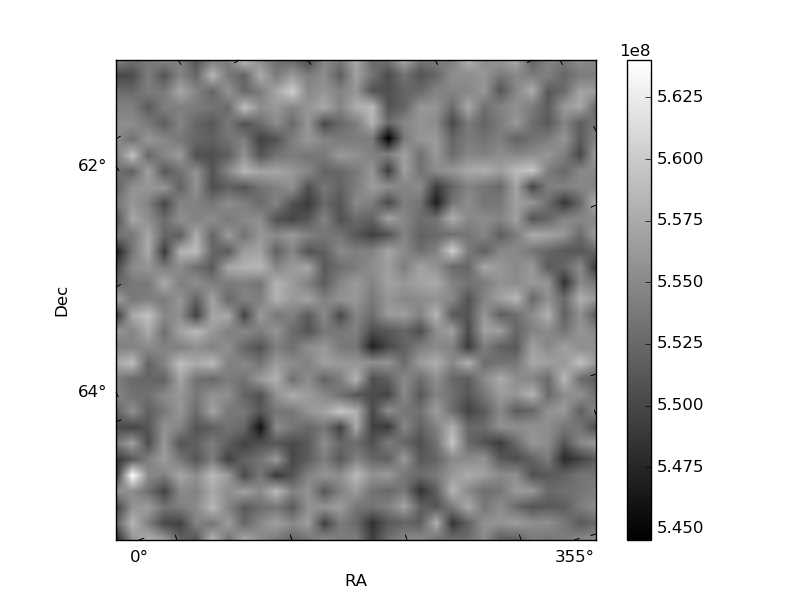
Quadrant B |
|---|---|---|---|
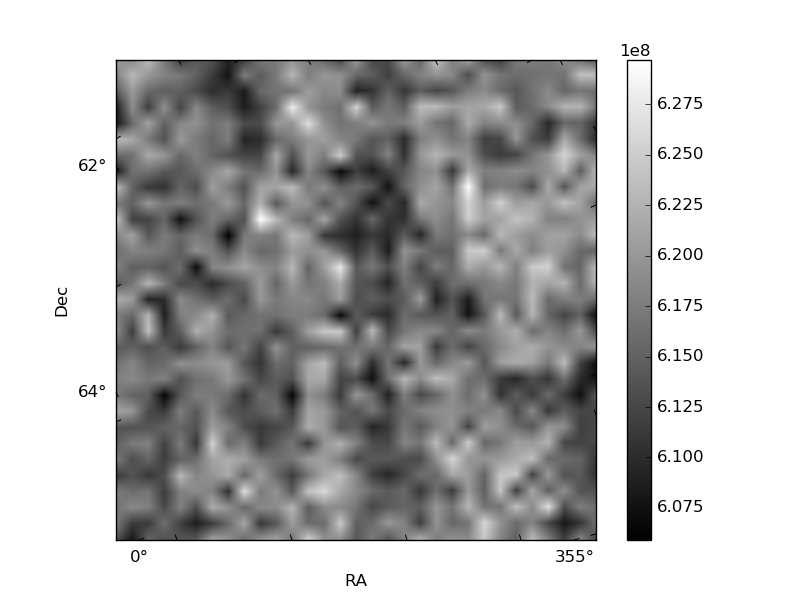
| Quadrant D | 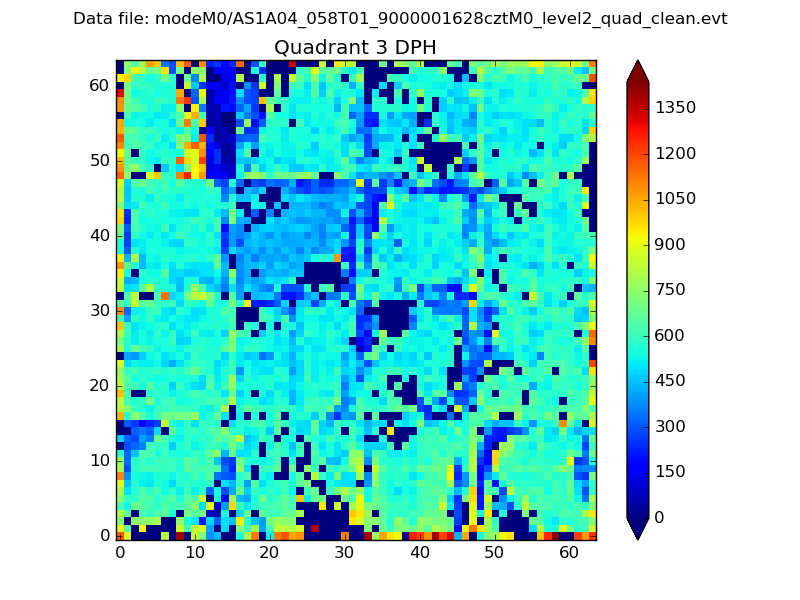 |
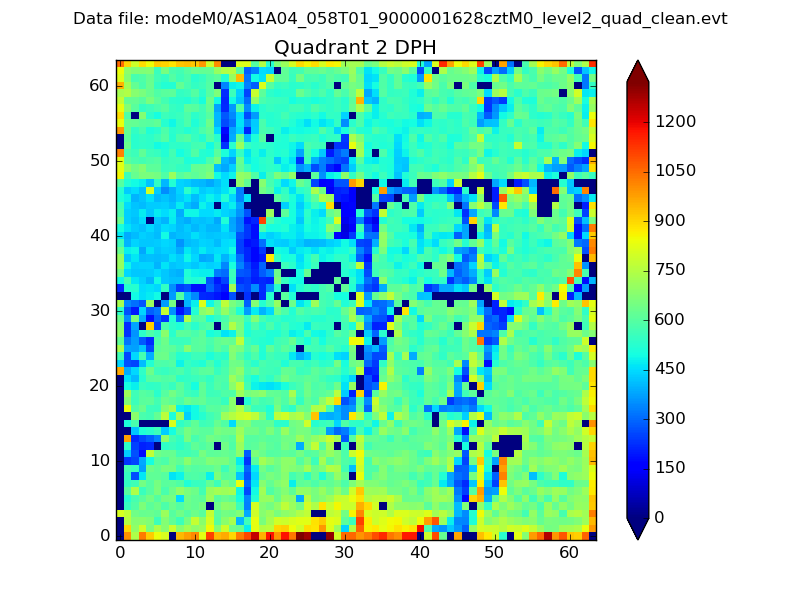 |
Quadrant C |
| Plot type | Count rate plots | Images |
|---|---|---|
| Comparison with Poisson distribution Blue bars denote a histogram of data divided into 1 sec bins. Red curve is a Poisson curve with rate = median count rate of data. |
 |
 |
| Quadrant-wise count rates Data is divided into 100 sec bins |
 |
|
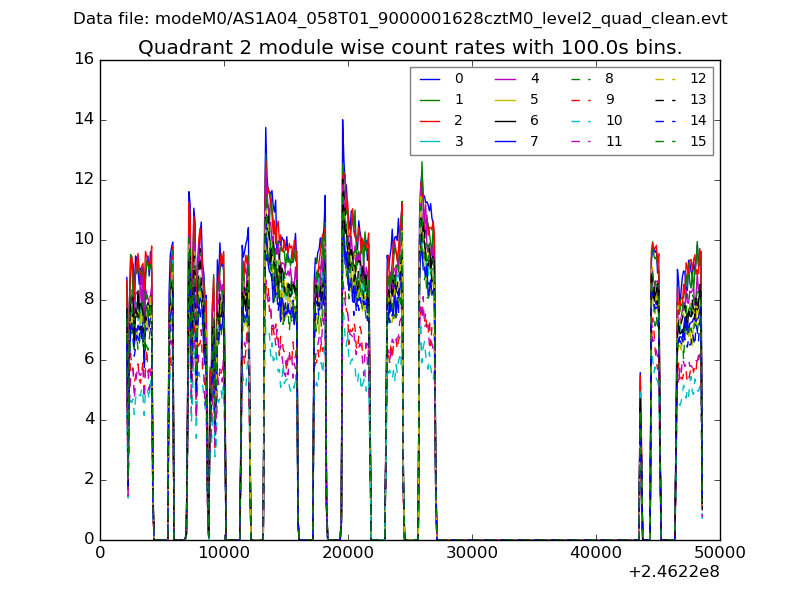
| Module-wise count rates for Quadrant A Data is divided into 100 sec bins |
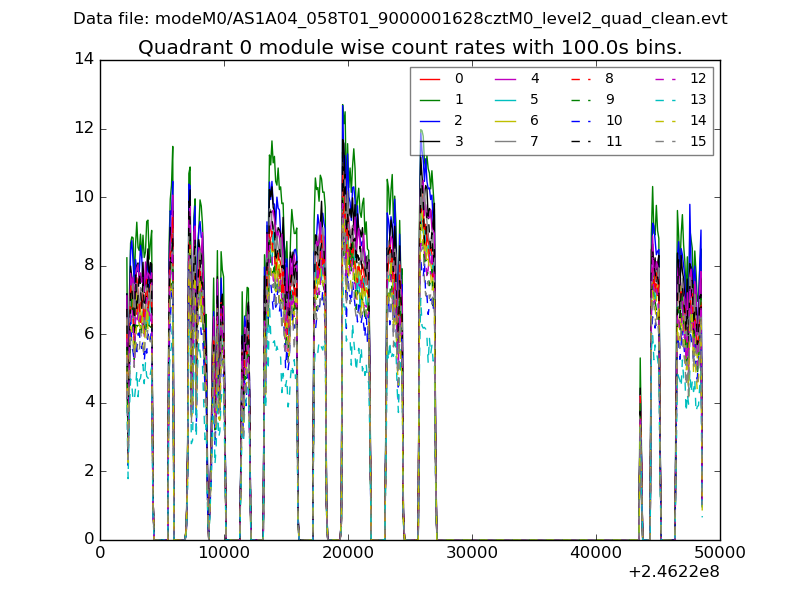 |
 |
| Module-wise count rates for Quadrant B Data is divided into 100 sec bins |
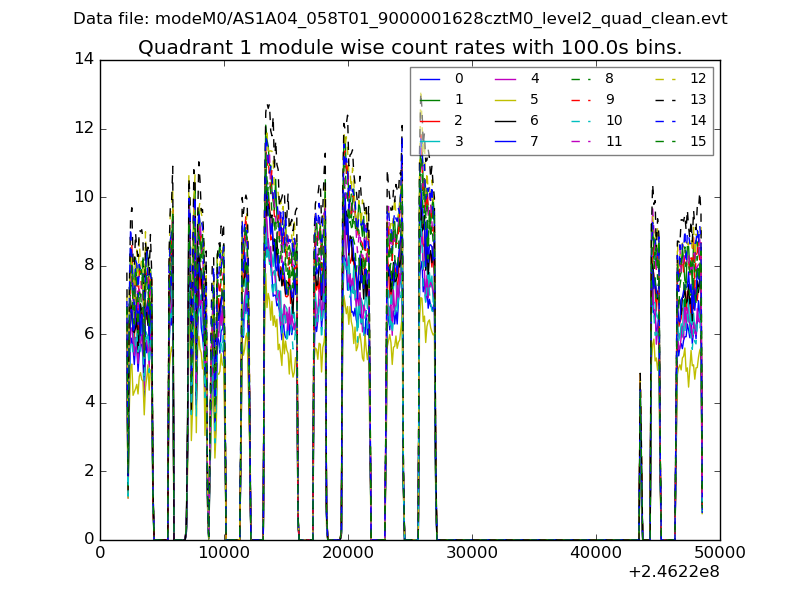 |
 |
| Module-wise count rates for Quadrant C Data is divided into 100 sec bins |
 |
 |
| Module-wise count rates for Quadrant D Data is divided into 100 sec bins |
 |
 |
| Parameter | Plot |
|---|---|
| CZT HV Monitor | 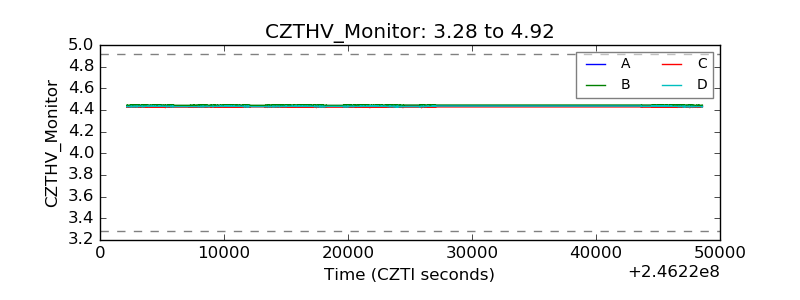 |
| D_VDD | 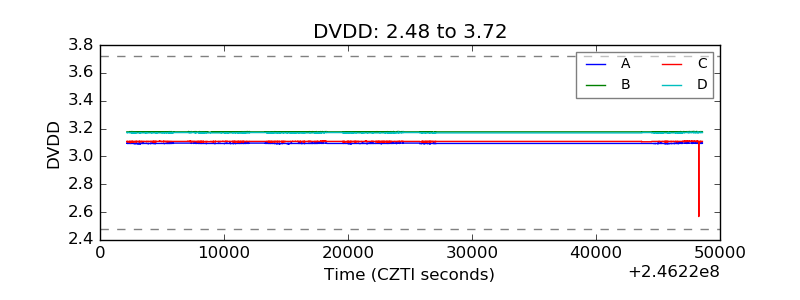 |
| Temperature 1 | 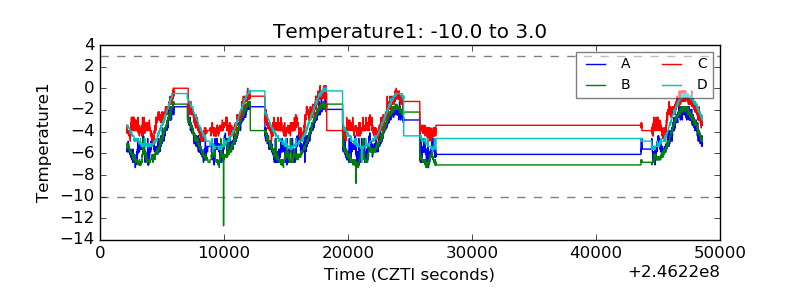 |
| Veto HV Monitor | 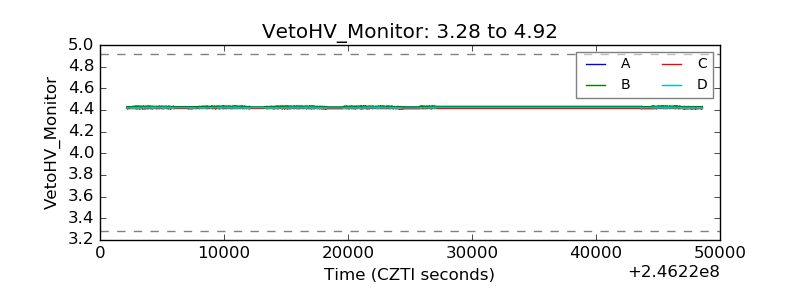 |
| Veto LLD | 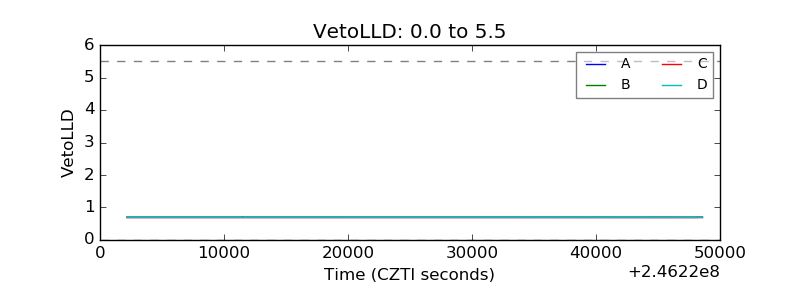 |
| Alpha Counter | 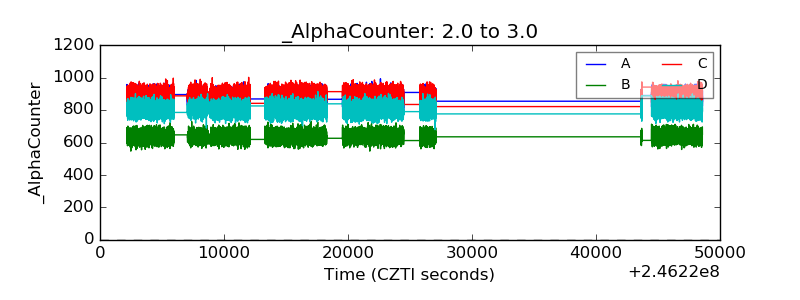 |
| _CPM_Rate | 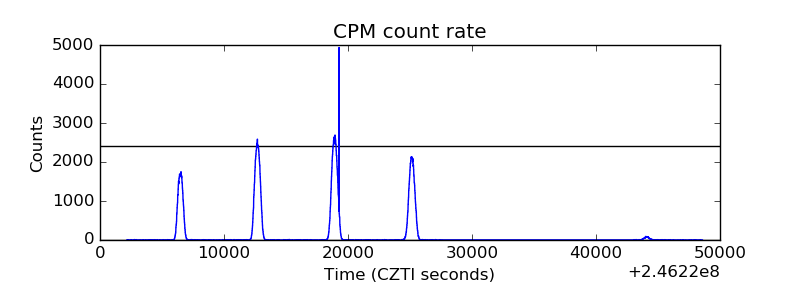 |
| CZT Counter | 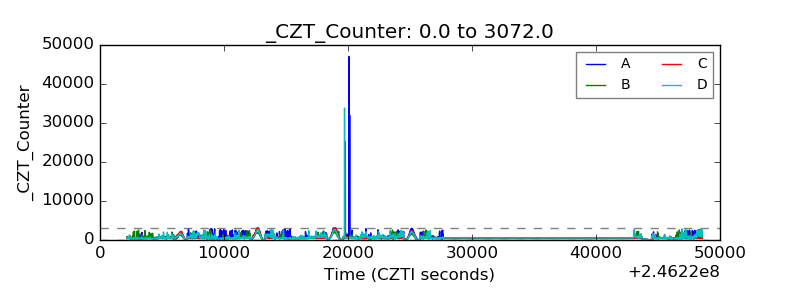 |
| +2.5 Volts monitor |  |
| +5 Volts monitor | 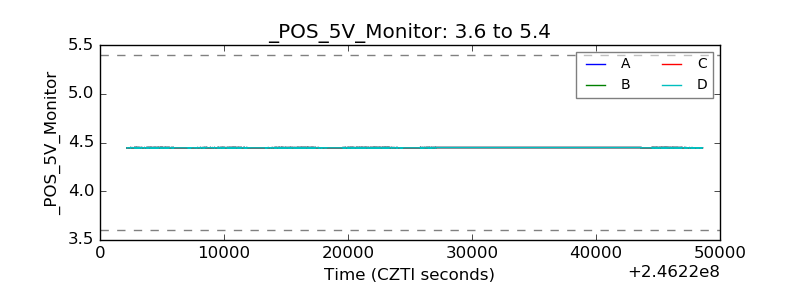 |
| _ROLL_ROT | 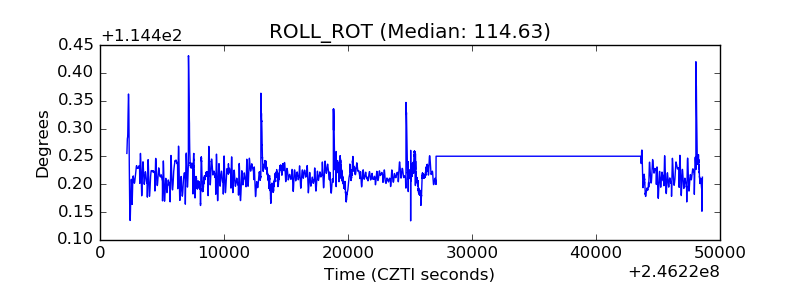 |
| _Roll_DEC |  |
| _Roll_RA | 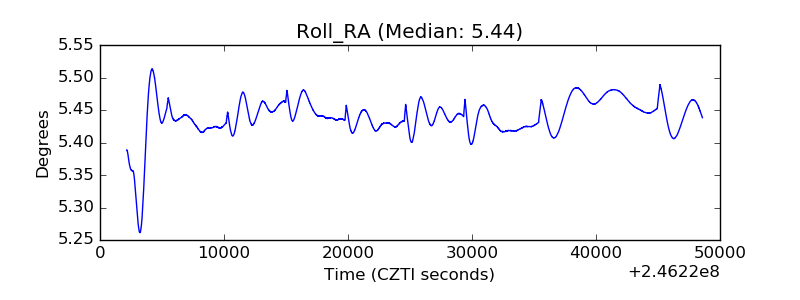 |
| Veto Counter | 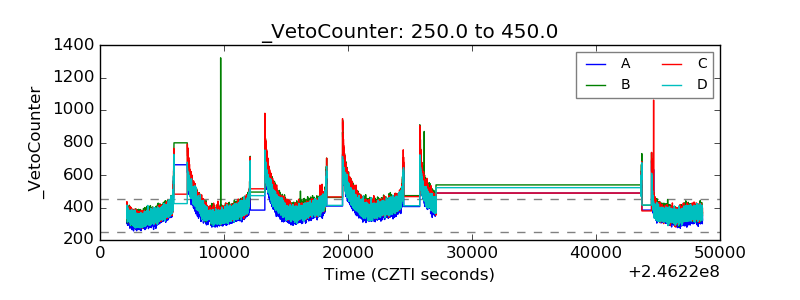 |