| Param | Original file | Final file |
|---|---|---|
| Filename | modeM0/AS1A04_058T01_9000001628_11156cztM0_level2.evt | modeM0/AS1A04_058T01_9000001628_11156cztM0_level2_quad_clean.evt |
| Size (bytes) | 364,213,440 | 64,474,560 |
| Size | 347.3 MB | 61.5 MB |
| Events in quadrant A | 3,015,340 | 395,882 |
| Events in quadrant B | 2,908,702 | 402,656 |
| Events in quadrant C | 2,035,594 | 432,300 |
| Events in quadrant D | 2,755,180 | 395,616 |
| Mode M0 | |||
|---|---|---|---|
| Quadrant | BADHDUFLAG | Total packets | Discarded packets |
| A | 0 | 13484 | 1474 |
| B | 0 | 13019 | 1240 |
| C | 0 | 10305 | 796 |
| D | 0 | 13125 | 1454 |
| Mode SS | |||
|---|---|---|---|
| Quadrant | BADHDUFLAG | Total packets | Discarded packets |
| A | 0 | 102 | 10 |
| B | 0 | 102 | 8 |
| C | 0 | 102 | 6 |
| D | 0 | 102 | 8 |
| Mode M9 | |||
|---|---|---|---|
| Quadrant | BADHDUFLAG | Total packets | Discarded packets |
| A | 0 | 11 | 1 |
| B | 0 | 11 | 0 |
| C | 0 | 11 | 1 |
| D | 0 | 11 | 1 |
| Quadrant | Total seconds | Saturated seconds | Saturation percentage |
|---|---|---|---|
| A | 4617 | 80 | 1.732727% |
| B | 4601 | 174 | 3.781787% |
| C | 4685 | 20 | 0.426894% |
| D | 4622 | 99 | 2.141930% |
Noise dominated data is calculated using 1-second bins in cleaned event files. If a bin has >2000 counts, and if more than 50% of those come from <1% of pixels, then it is considered to be noise-dominated and hence unusable.
| Quadrant | # 1 sec bins | Bins with >0 counts | Bins with >2000 counts | High rate bins dominated by noise | Noise dominated (total time) | Noise dominated (detector-on time) | Marked lightcurve |
|---|---|---|---|---|---|---|---|
| A | 6122 | 4772 | 47 | 47 | 0.77% | 0.98% | 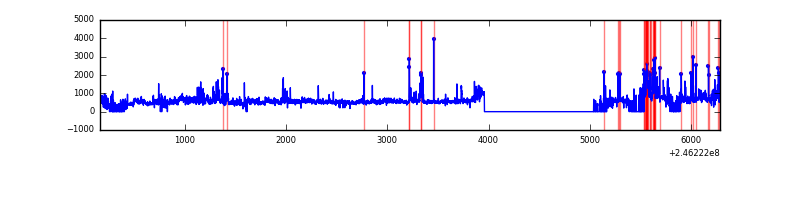 |
| B | 6122 | 4808 | 91 | 91 | 1.49% | 1.89% | 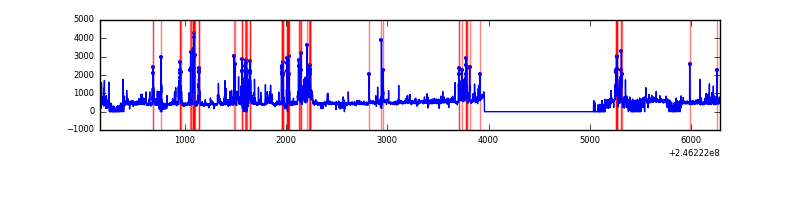 |
| C | 6122 | 4861 | 0 | 0 | 0.00% | 0.00% | 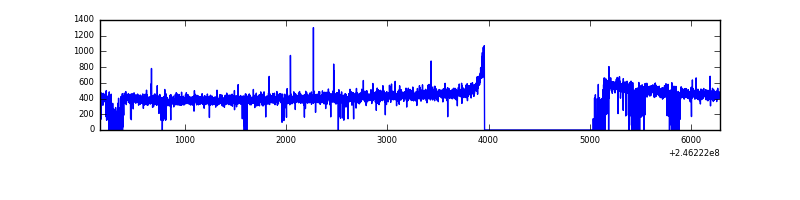 |
| D | 6122 | 4779 | 58 | 58 | 0.95% | 1.21% | 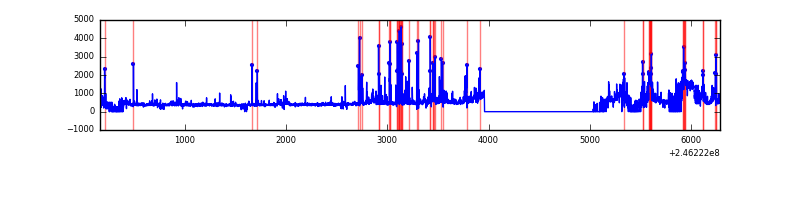 |
Top three noisy pixels from each quadrant. If the there are fewer than three noisy pixels in the level2.evt file, extra rows are filled as -1
| Pixel properties | Quadrant properties | ||||||
|---|---|---|---|---|---|---|---|
| Quadrant | DetID | PixID | Counts | Sigma | Mean | Median | Sigma |
| A | 8 | 15 | 652958 | 6184.03 | 511 | 499 | 105.5 |
| A | 8 | 5 | 306626 | 2901.48 | 511 | 499 | 105.5 |
| A | 14 | 238 | 59926 | 563.25 | 511 | 499 | 105.5 |
| B | 4 | 239 | 678781 | 6931.67 | 514 | 501 | 97.9 |
| B | 15 | 204 | 59819 | 606.2 | 514 | 501 | 97.9 |
| B | 10 | 16 | 50894 | 514.99 | 514 | 501 | 97.9 |
| C | 12 | 4 | 5267 | 39.04 | 520 | 521 | 121.6 |
| C | 13 | 61 | 3886 | 27.68 | 520 | 521 | 121.6 |
| C | 14 | 128 | 1502 | 8.07 | 520 | 521 | 121.6 |
| D | 1 | 52 | 307245 | 2547.69 | 500 | 487 | 120.4 |
| D | 10 | 199 | 190238 | 1575.92 | 500 | 487 | 120.4 |
| D | 13 | 152 | 129568 | 1072.04 | 500 | 487 | 120.4 |
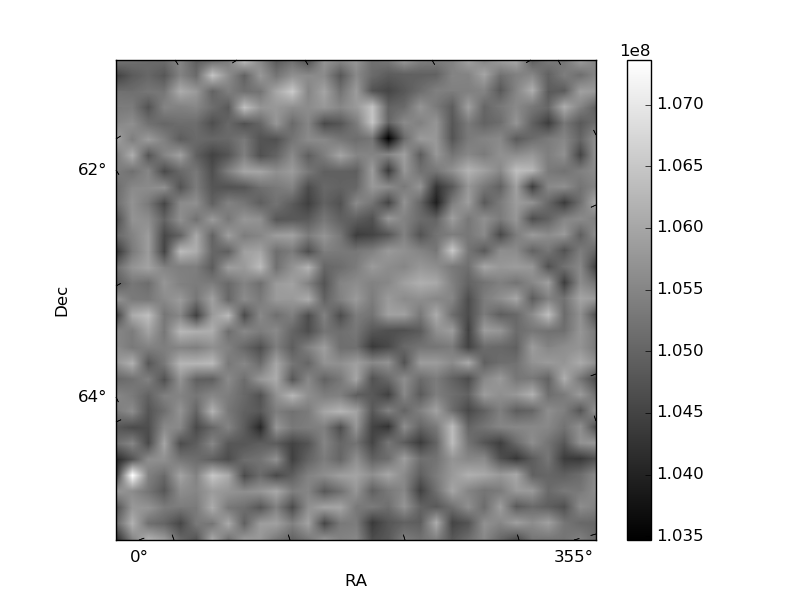
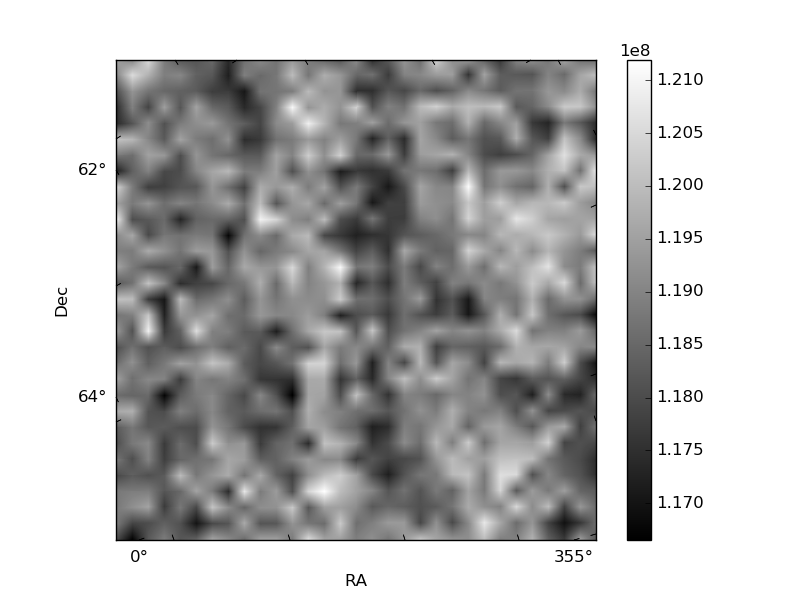
Histogram calculated using DETX and DETY for each event in the final _common_clean file
| Quadrant A | 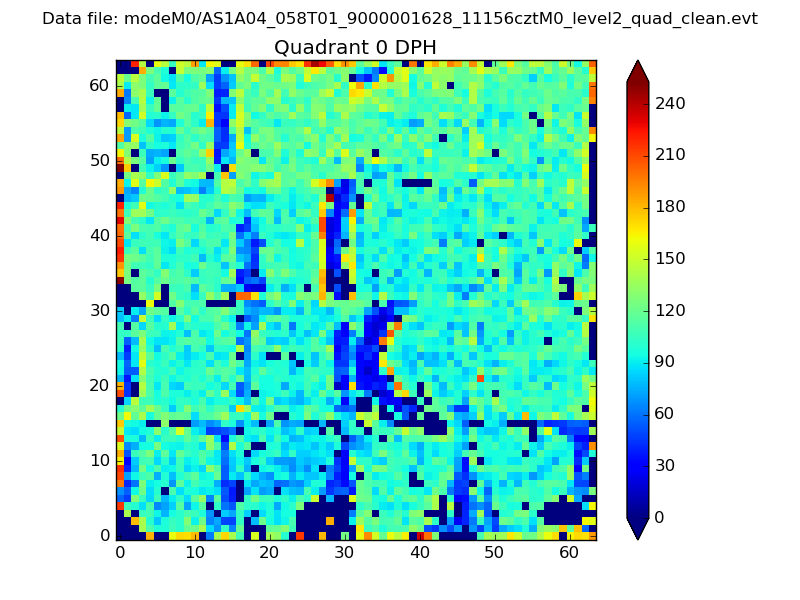 |
 |
Quadrant B |
|---|---|---|---|
| Quadrant D |  |
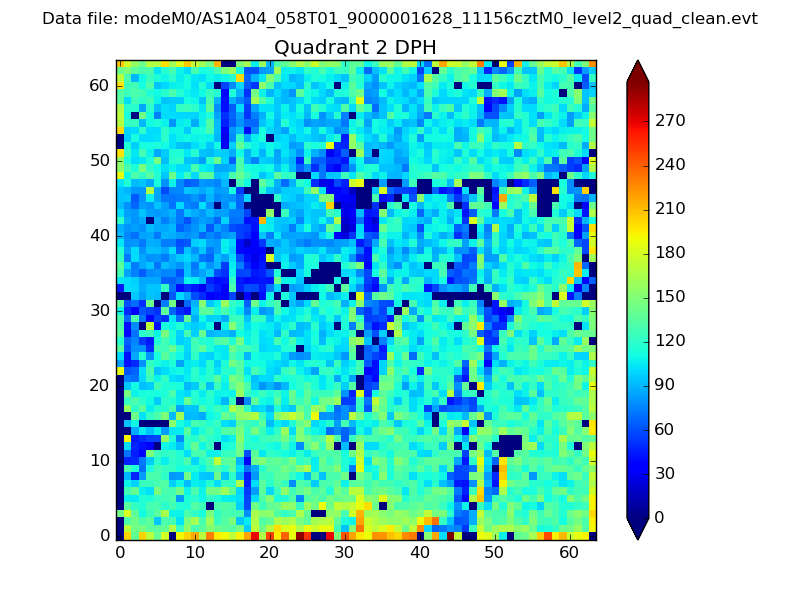 |
Quadrant C |
| Plot type | Count rate plots | Images |
|---|---|---|
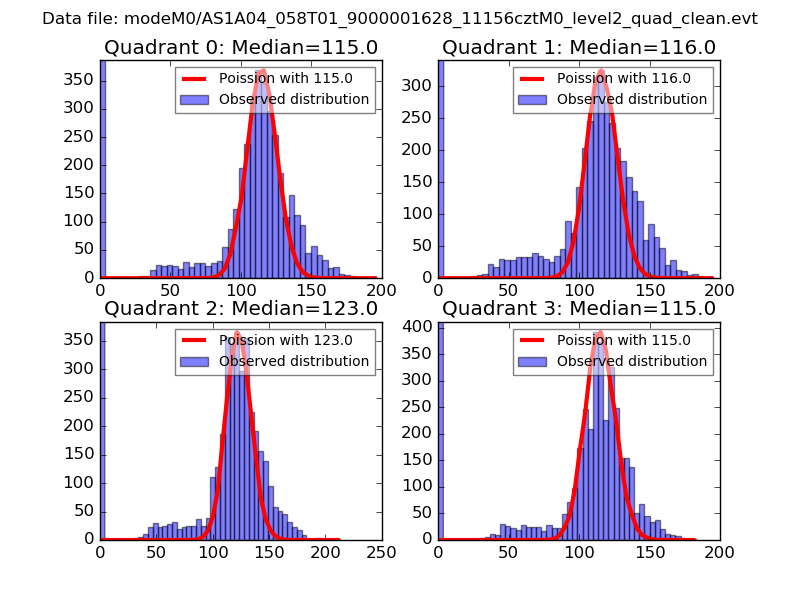
| Comparison with Poisson distribution Blue bars denote a histogram of data divided into 1 sec bins. Red curve is a Poisson curve with rate = median count rate of data. |
 |
 |
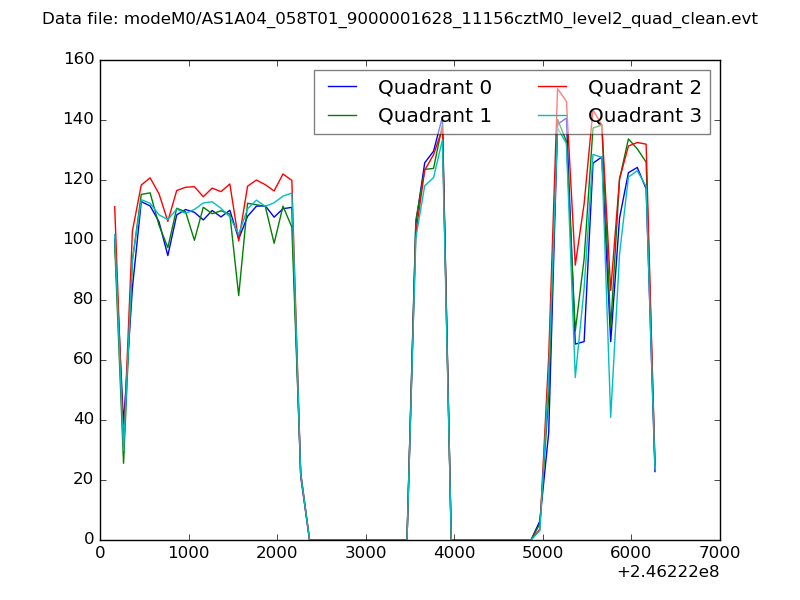
| Quadrant-wise count rates Data is divided into 100 sec bins |
 |
|
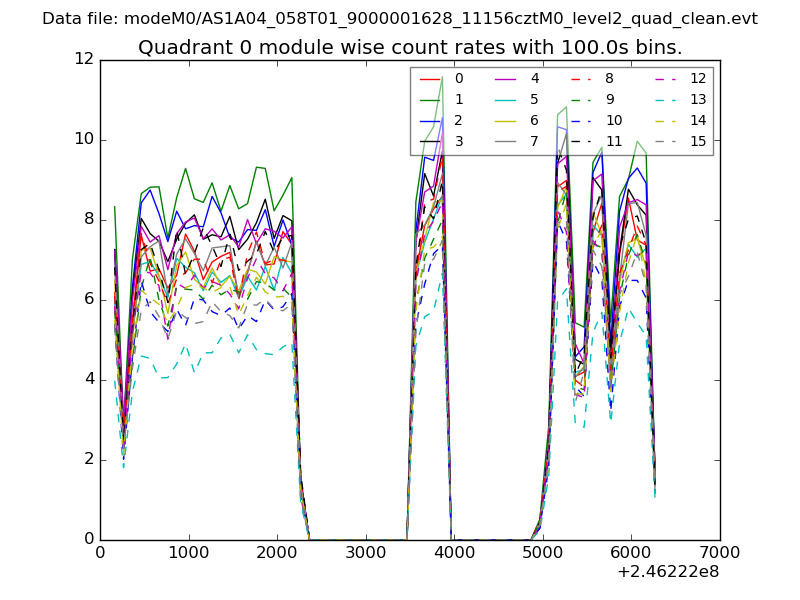
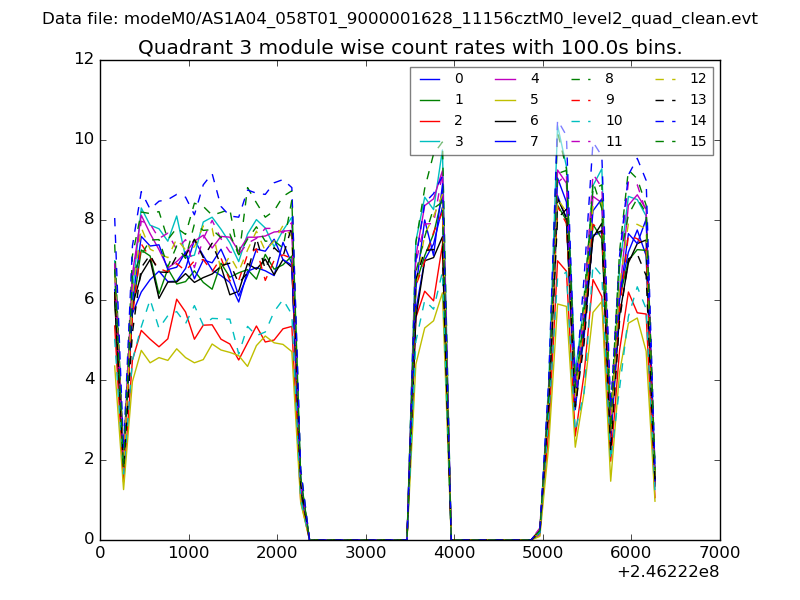
| Module-wise count rates for Quadrant A Data is divided into 100 sec bins |
 |
 |
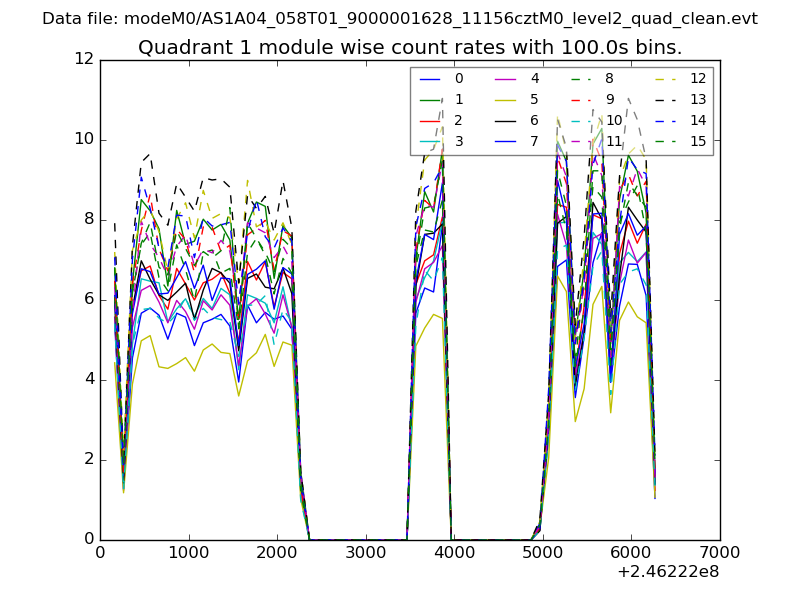
| Module-wise count rates for Quadrant B Data is divided into 100 sec bins |
 |
 |
| Module-wise count rates for Quadrant C Data is divided into 100 sec bins |
 |
 |
| Module-wise count rates for Quadrant D Data is divided into 100 sec bins |
 |
 |
| Parameter | Plot |
|---|---|
| CZT HV Monitor |  |
| D_VDD | 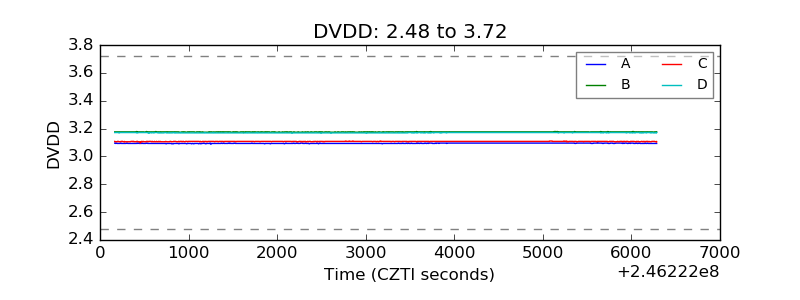 |
| Temperature 1 | 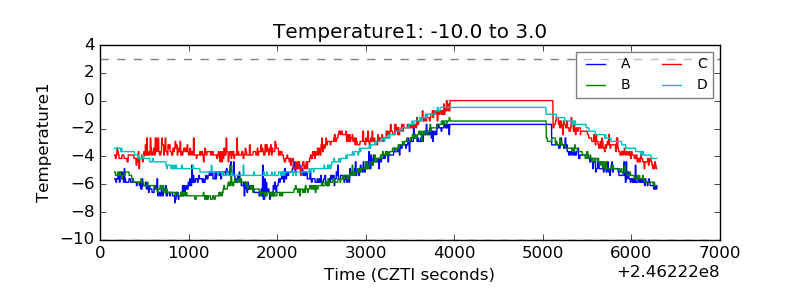 |
| Veto HV Monitor | 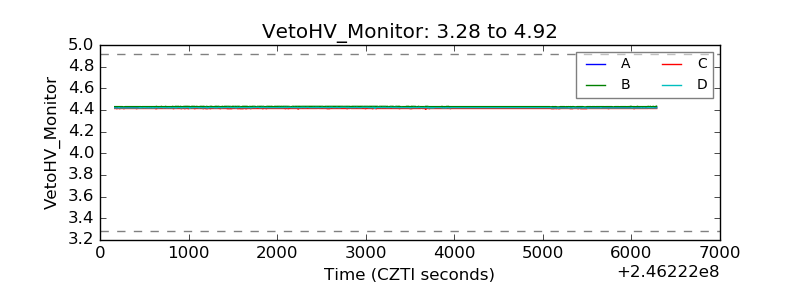 |
| Veto LLD | 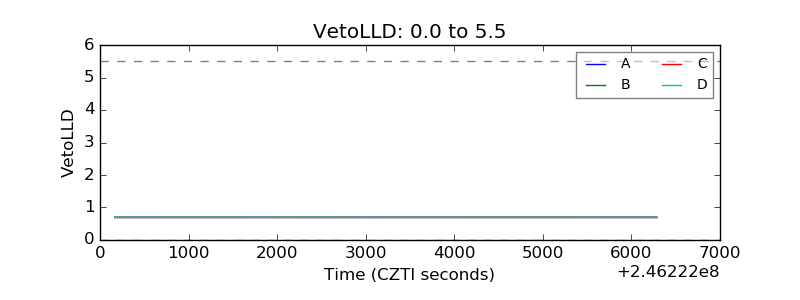 |
| Alpha Counter | 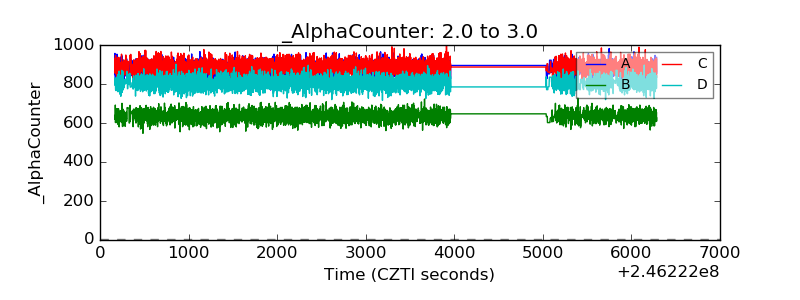 |
| _CPM_Rate | 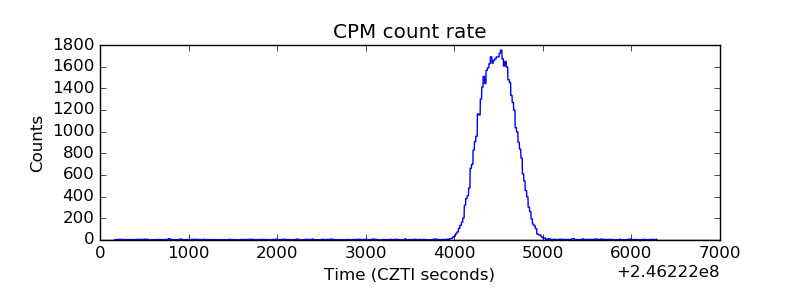 |
| CZT Counter | 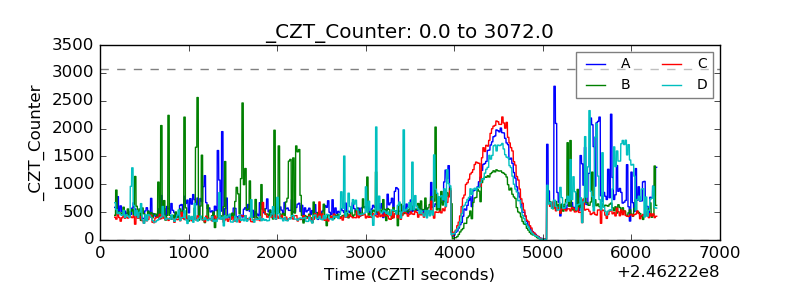 |
| +2.5 Volts monitor |  |
| +5 Volts monitor |  |
| _ROLL_ROT | 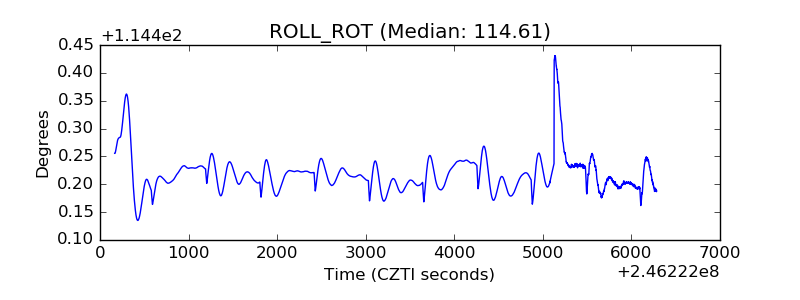 |
| _Roll_DEC | 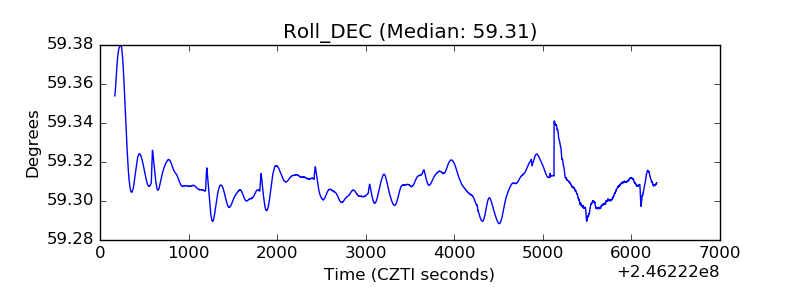 |
| _Roll_RA | 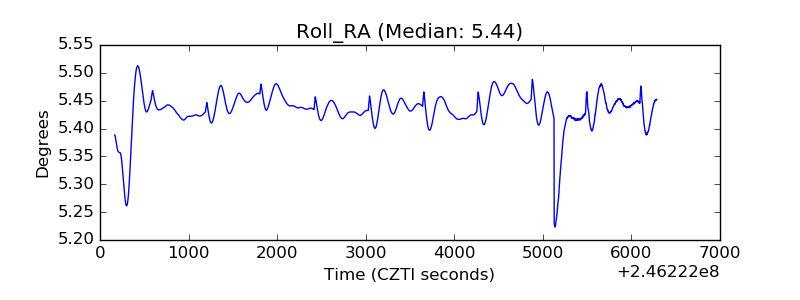 |
| Veto Counter | 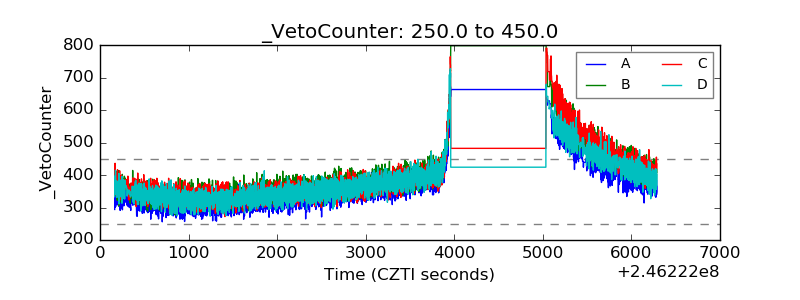 |