| Param | Original file | Final file |
|---|---|---|
| Filename | modeM0/AS1A04_058T01_9000001628_11159cztM0_level2.evt | modeM0/AS1A04_058T01_9000001628_11159cztM0_level2_quad_clean.evt |
| Size (bytes) | 537,943,680 | 101,701,440 |
| Size | 513.0 MB | 97.0 MB |
| Events in quadrant A | 4,372,489 | 635,660 |
| Events in quadrant B | 3,944,687 | 680,363 |
| Events in quadrant C | 2,884,993 | 694,043 |
| Events in quadrant D | 4,666,911 | 634,664 |
| Mode M0 | |||
|---|---|---|---|
| Quadrant | BADHDUFLAG | Total packets | Discarded packets |
| A | 0 | 17211 | 230 |
| B | 0 | 16026 | 200 |
| C | 0 | 12915 | 106 |
| D | 0 | 18381 | 195 |
| Mode SS | |||
|---|---|---|---|
| Quadrant | BADHDUFLAG | Total packets | Discarded packets |
| A | 0 | 130 | 0 |
| B | 0 | 130 | 4 |
| C | 0 | 130 | 2 |
| D | 0 | 130 | 0 |
| Mode M9 | |||
|---|---|---|---|
| Quadrant | BADHDUFLAG | Total packets | Discarded packets |
| A | 0 | 26 | 0 |
| B | 0 | 26 | 0 |
| C | 0 | 26 | 0 |
| D | 0 | 26 | 0 |
| Quadrant | Total seconds | Saturated seconds | Saturation percentage |
|---|---|---|---|
| A | 6223 | 474 | 7.616905% |
| B | 6230 | 301 | 4.831461% |
| C | 6238 | 18 | 0.288554% |
| D | 6223 | 202 | 3.246023% |
Noise dominated data is calculated using 1-second bins in cleaned event files. If a bin has >2000 counts, and if more than 50% of those come from <1% of pixels, then it is considered to be noise-dominated and hence unusable.
| Quadrant | # 1 sec bins | Bins with >0 counts | Bins with >2000 counts | High rate bins dominated by noise | Noise dominated (total time) | Noise dominated (detector-on time) | Marked lightcurve |
|---|---|---|---|---|---|---|---|
| A | 8864 | 6276 | 245 | 245 | 2.76% | 3.90% | 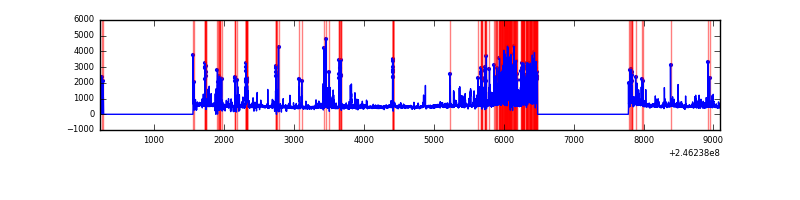 |
| B | 8862 | 6278 | 138 | 138 | 1.56% | 2.20% | 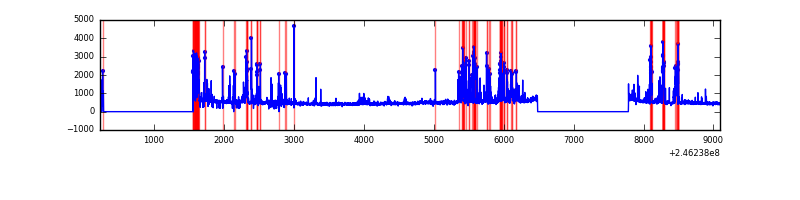 |
| C | 8864 | 6285 | 0 | 0 | 0.00% | 0.00% | 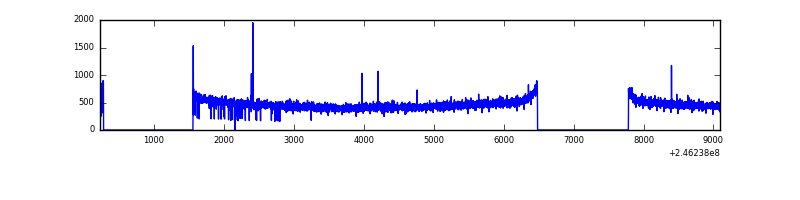 |
| D | 8863 | 6280 | 90 | 90 | 1.02% | 1.43% | 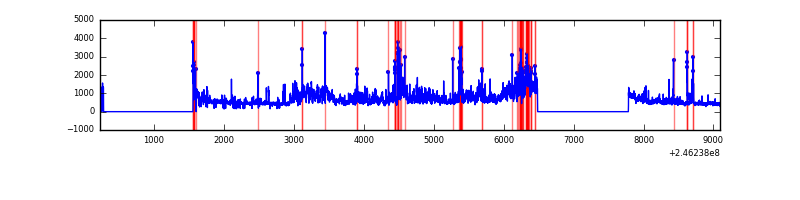 |
Top three noisy pixels from each quadrant. If the there are fewer than three noisy pixels in the level2.evt file, extra rows are filled as -1
| Pixel properties | Quadrant properties | ||||||
|---|---|---|---|---|---|---|---|
| Quadrant | DetID | PixID | Counts | Sigma | Mean | Median | Sigma |
| A | 8 | 5 | 772370 | 5355.93 | 713 | 698 | 144.1 |
| A | 14 | 238 | 651807 | 4519.14 | 713 | 698 | 144.1 |
| A | 8 | 15 | 182967 | 1265.07 | 713 | 698 | 144.1 |
| B | 4 | 239 | 817254 | 5909.68 | 746 | 728 | 138.2 |
| B | 15 | 204 | 53479 | 381.79 | 746 | 728 | 138.2 |
| B | 10 | 16 | 44510 | 316.88 | 746 | 728 | 138.2 |
| C | 9 | 204 | 7290 | 38.96 | 737 | 740 | 168.1 |
| C | 13 | 61 | 5376 | 27.57 | 737 | 740 | 168.1 |
| C | 12 | 4 | 3023 | 13.58 | 737 | 740 | 168.1 |
| D | 10 | 157 | 1283761 | 7744.2 | 703 | 685 | 165.7 |
| D | 10 | 199 | 141220 | 848.22 | 703 | 685 | 165.7 |
| D | 12 | 17 | 116766 | 700.62 | 703 | 685 | 165.7 |
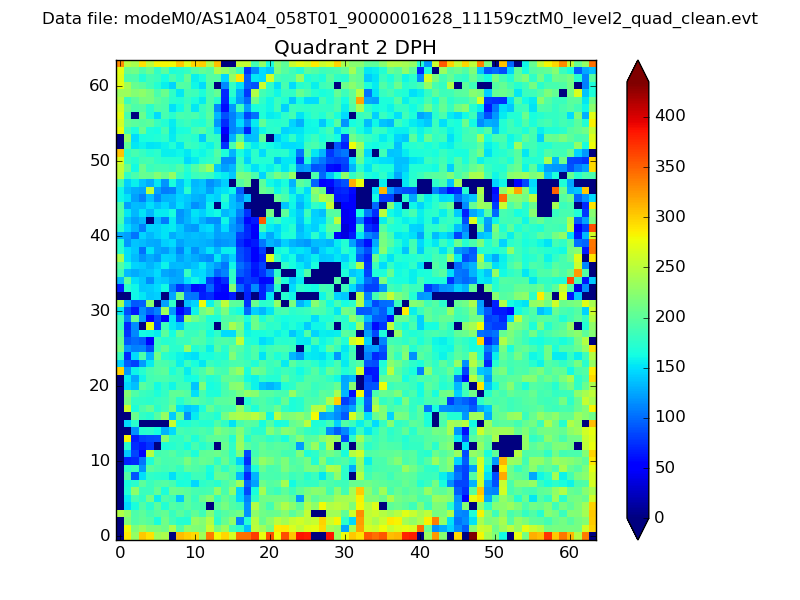
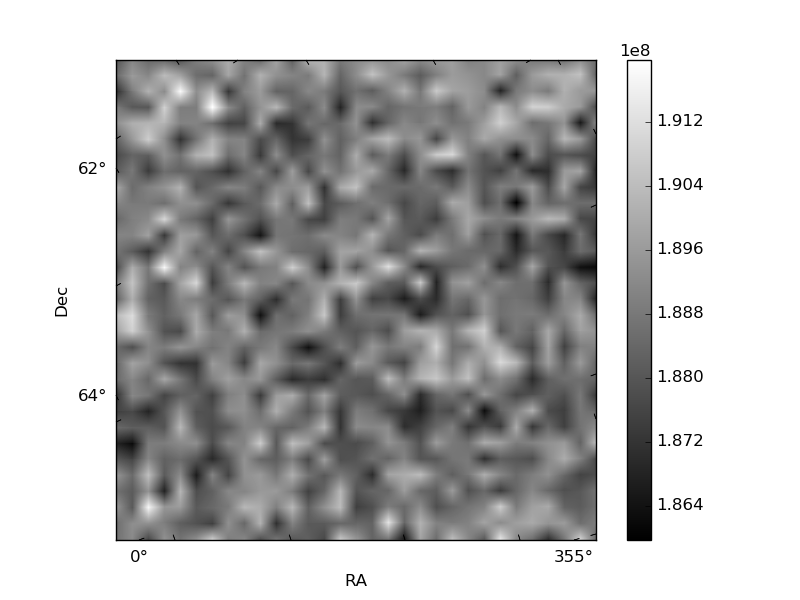
Histogram calculated using DETX and DETY for each event in the final _common_clean file
| Quadrant A |  |
 |
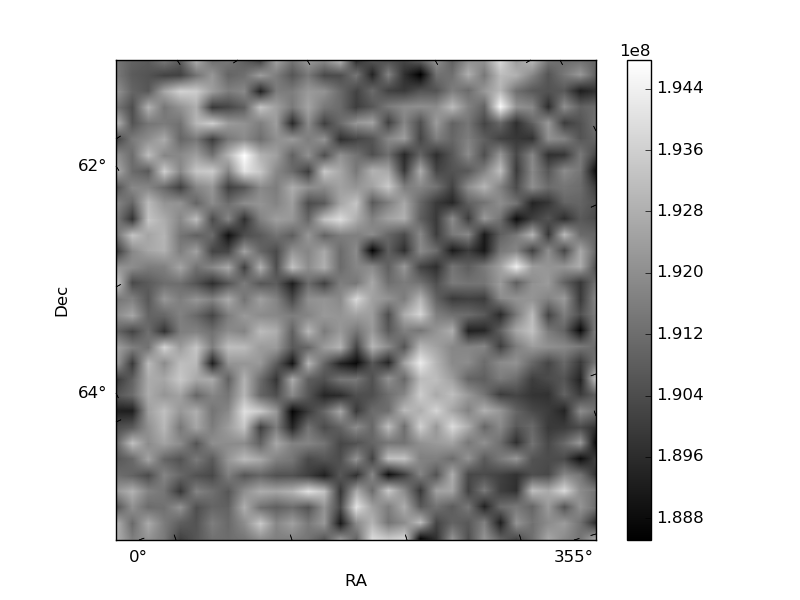
Quadrant B |
|---|---|---|---|
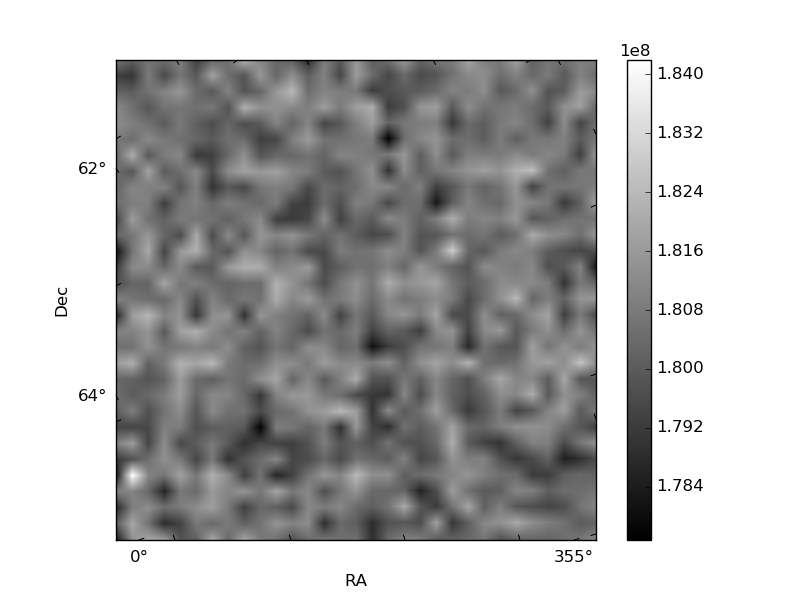
| Quadrant D | 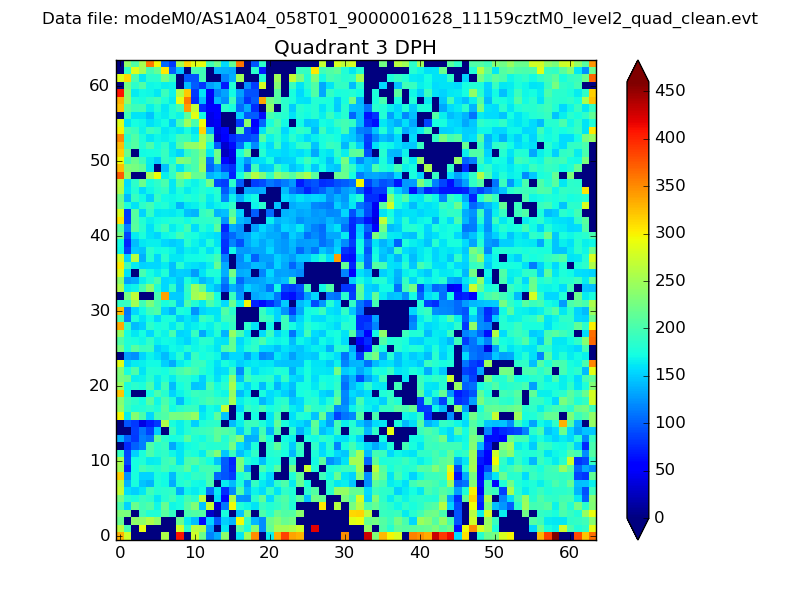 |
 |
Quadrant C |
| Plot type | Count rate plots | Images |
|---|---|---|
| Comparison with Poisson distribution Blue bars denote a histogram of data divided into 1 sec bins. Red curve is a Poisson curve with rate = median count rate of data. |
 |
 |
| Quadrant-wise count rates Data is divided into 100 sec bins |
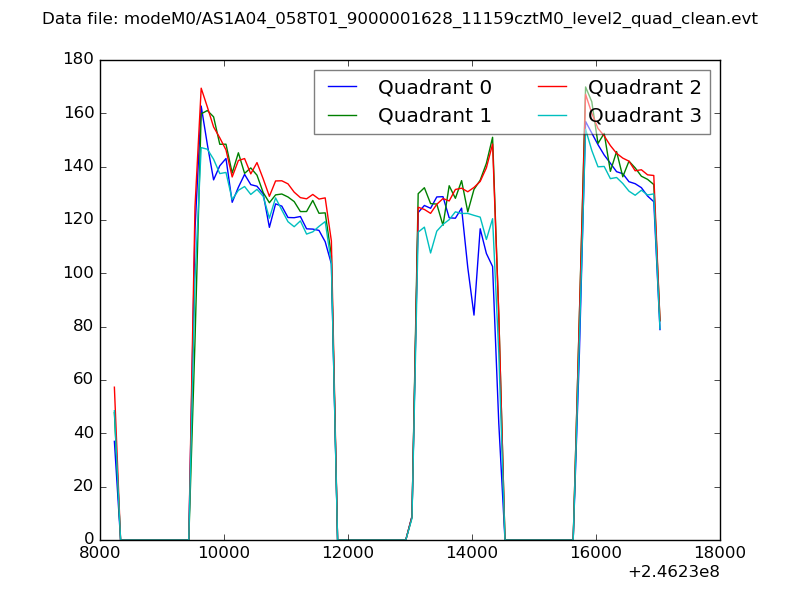 |
|
| Module-wise count rates for Quadrant A Data is divided into 100 sec bins |
 |
 |
| Module-wise count rates for Quadrant B Data is divided into 100 sec bins |
 |
 |
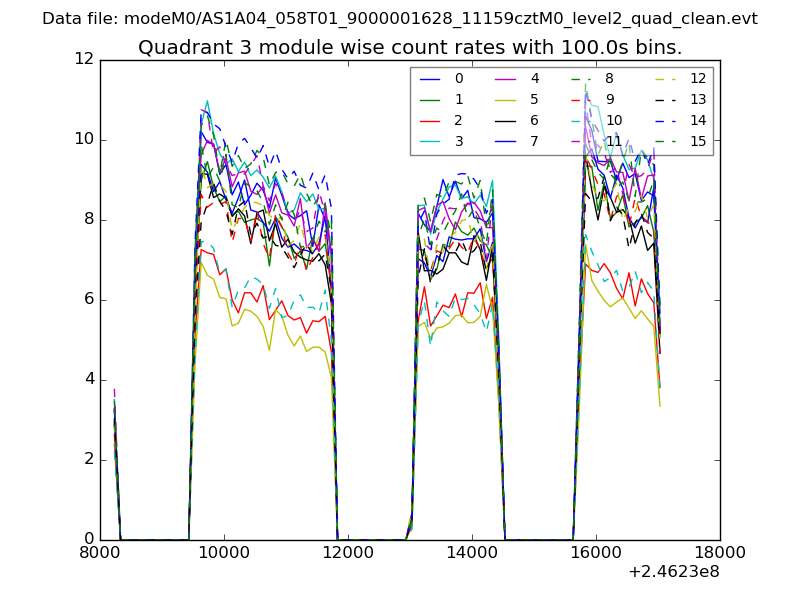
| Module-wise count rates for Quadrant C Data is divided into 100 sec bins |
 |
 |
| Module-wise count rates for Quadrant D Data is divided into 100 sec bins |
 |
 |
| Parameter | Plot |
|---|---|
| CZT HV Monitor |  |
| D_VDD | 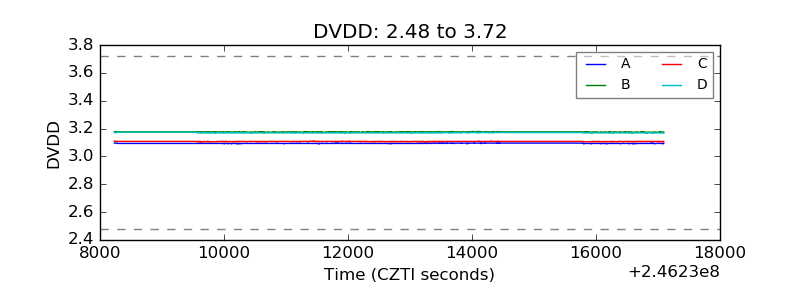 |
| Temperature 1 | 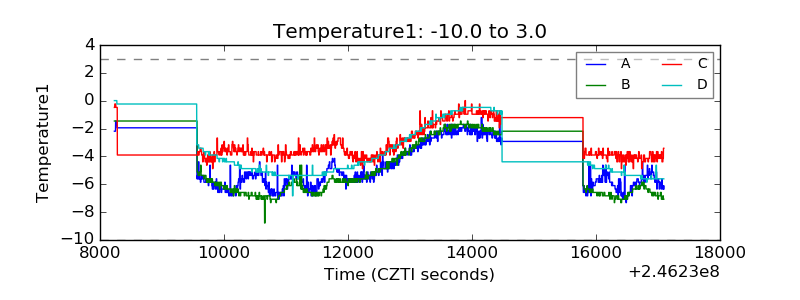 |
| Veto HV Monitor | 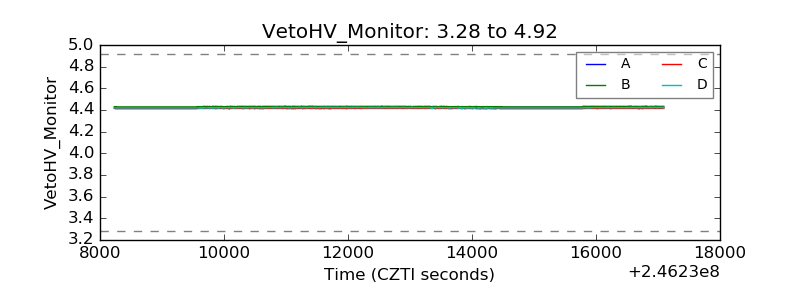 |
| Veto LLD | 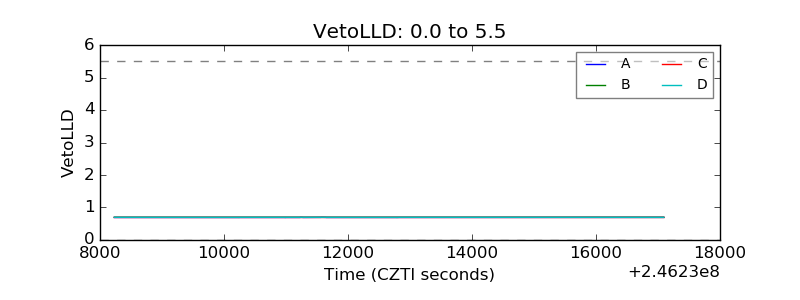 |
| Alpha Counter | 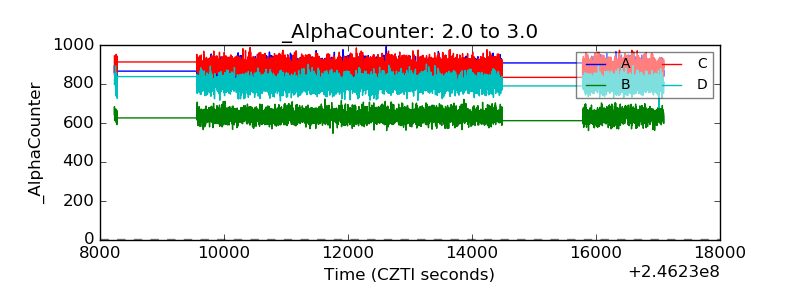 |
| _CPM_Rate | 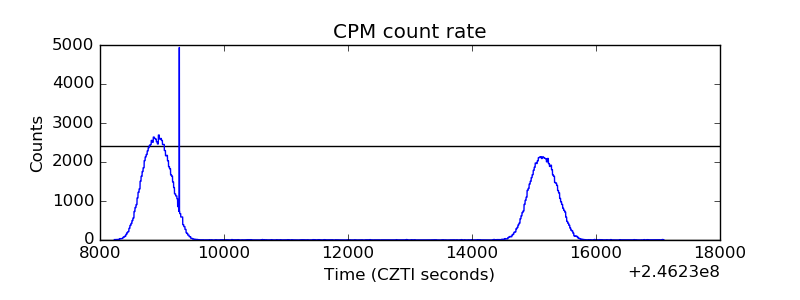 |
| CZT Counter | 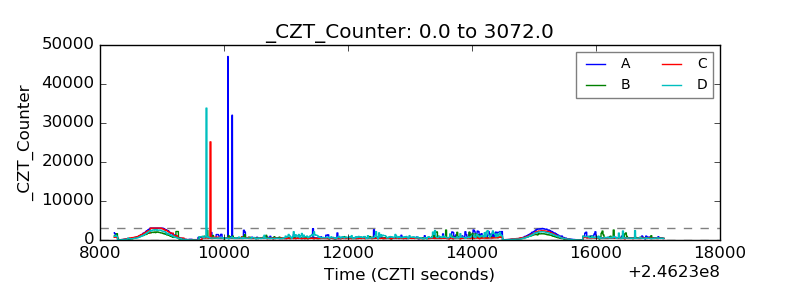 |
| +2.5 Volts monitor |  |
| +5 Volts monitor |  |
| _ROLL_ROT | 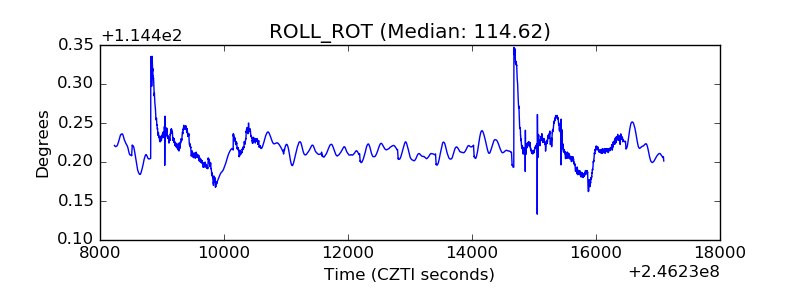 |
| _Roll_DEC | 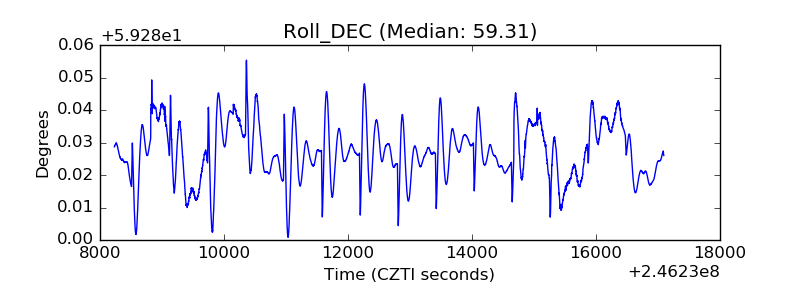 |
| _Roll_RA | 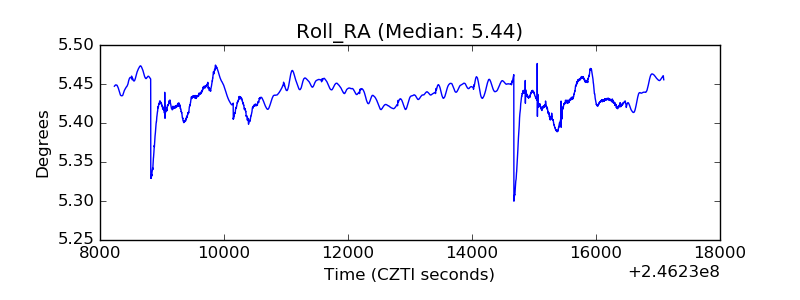 |
| Veto Counter | 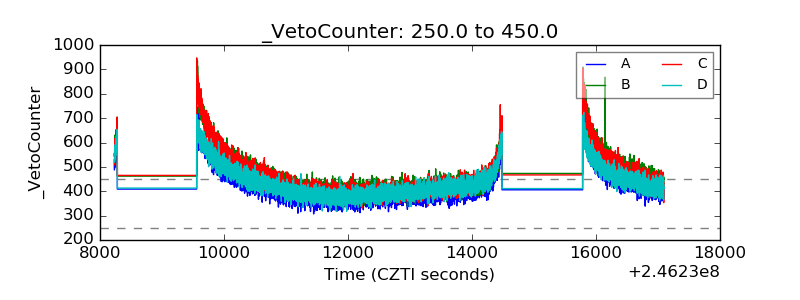 |