| Param | Original file | Final file |
|---|---|---|
| Filename | modeM0/AS1A04_058T01_9000001628_11160cztM0_level2.evt | modeM0/AS1A04_058T01_9000001628_11160cztM0_level2_quad_clean.evt |
| Size (bytes) | 265,656,960 | 46,471,680 |
| Size | 253.4 MB | 44.3 MB |
| Events in quadrant A | 2,337,682 | 282,146 |
| Events in quadrant B | 1,872,097 | 298,320 |
| Events in quadrant C | 1,512,300 | 302,671 |
| Events in quadrant D | 2,086,586 | 278,304 |
| Mode M0 | |||
|---|---|---|---|
| Quadrant | BADHDUFLAG | Total packets | Discarded packets |
| A | 0 | 9391 | 194 |
| B | 0 | 8230 | 334 |
| C | 0 | 7148 | 109 |
| D | 0 | 8883 | 278 |
| Mode SS | |||
|---|---|---|---|
| Quadrant | BADHDUFLAG | Total packets | Discarded packets |
| A | 0 | 72 | 2 |
| B | 0 | 72 | 2 |
| C | 0 | 72 | 2 |
| D | 0 | 72 | 2 |
| Mode M9 | |||
|---|---|---|---|
| Quadrant | BADHDUFLAG | Total packets | Discarded packets |
| A | 0 | 6 | 0 |
| B | 0 | 6 | 0 |
| C | 0 | 6 | 0 |
| D | 0 | 7 | 0 |
| Quadrant | Total seconds | Saturated seconds | Saturation percentage |
|---|---|---|---|
| A | 3462 | 152 | 4.390526% |
| B | 3453 | 78 | 2.258905% |
| C | 3478 | 3 | 0.086256% |
| D | 3449 | 40 | 1.159756% |
Noise dominated data is calculated using 1-second bins in cleaned event files. If a bin has >2000 counts, and if more than 50% of those come from <1% of pixels, then it is considered to be noise-dominated and hence unusable.
| Quadrant | # 1 sec bins | Bins with >0 counts | Bins with >2000 counts | High rate bins dominated by noise | Noise dominated (total time) | Noise dominated (detector-on time) | Marked lightcurve |
|---|---|---|---|---|---|---|---|
| A | 3500 | 3491 | 100 | 100 | 2.86% | 2.86% | 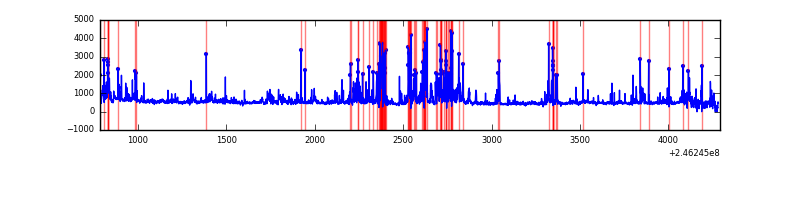 |
| B | 3498 | 3485 | 36 | 36 | 1.03% | 1.03% | 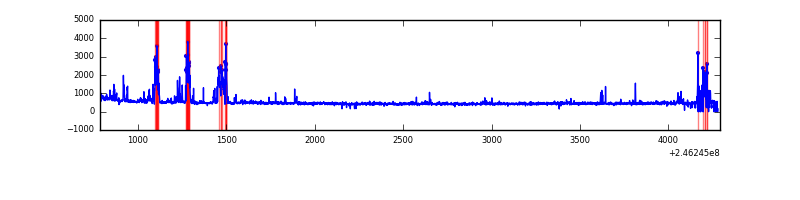 |
| C | 3508 | 3499 | 0 | 0 | 0.00% | 0.00% | 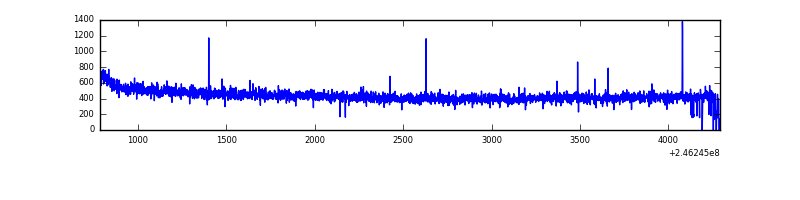 |
| D | 3491 | 3480 | 29 | 29 | 0.83% | 0.83% | 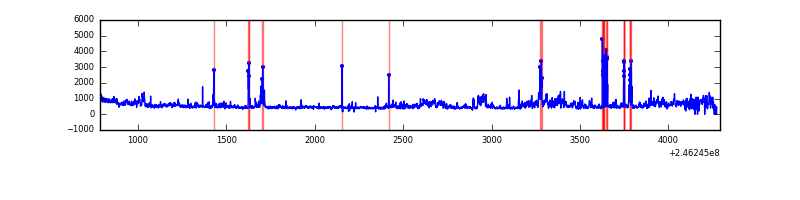 |
Top three noisy pixels from each quadrant. If the there are fewer than three noisy pixels in the level2.evt file, extra rows are filled as -1
| Pixel properties | Quadrant properties | ||||||
|---|---|---|---|---|---|---|---|
| Quadrant | DetID | PixID | Counts | Sigma | Mean | Median | Sigma |
| A | 14 | 238 | 604058 | 7615.87 | 387 | 380 | 79.3 |
| A | 8 | 5 | 150653 | 1895.81 | 387 | 380 | 79.3 |
| A | 8 | 15 | 72970 | 915.78 | 387 | 380 | 79.3 |
| B | 4 | 239 | 250457 | 3362.0 | 397 | 388 | 74.4 |
| B | 15 | 204 | 31063 | 412.4 | 397 | 388 | 74.4 |
| B | 0 | 214 | 10749 | 139.3 | 397 | 388 | 74.4 |
| C | 14 | 234 | 4132 | 41.79 | 386 | 388 | 89.6 |
| C | 13 | 61 | 2946 | 28.55 | 386 | 388 | 89.6 |
| C | 5 | 128 | 1984 | 17.81 | 386 | 388 | 89.6 |
| D | 10 | 157 | 394366 | 4200.88 | 369 | 360 | 93.8 |
| D | 5 | 97 | 81011 | 859.9 | 369 | 360 | 93.8 |
| D | 10 | 199 | 30405 | 320.34 | 369 | 360 | 93.8 |
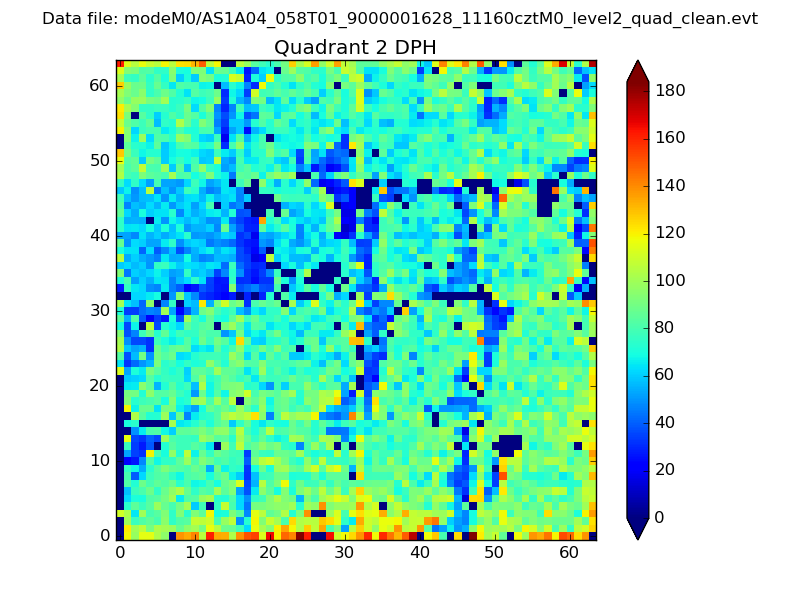
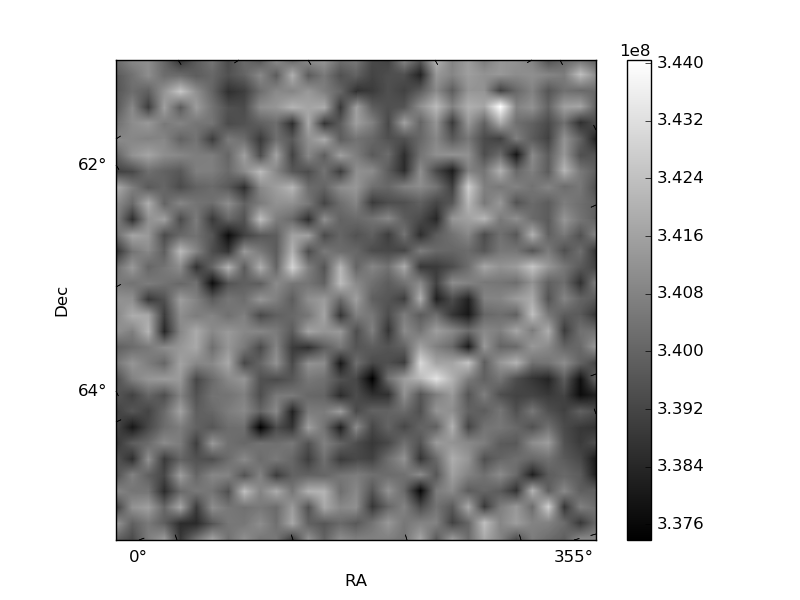
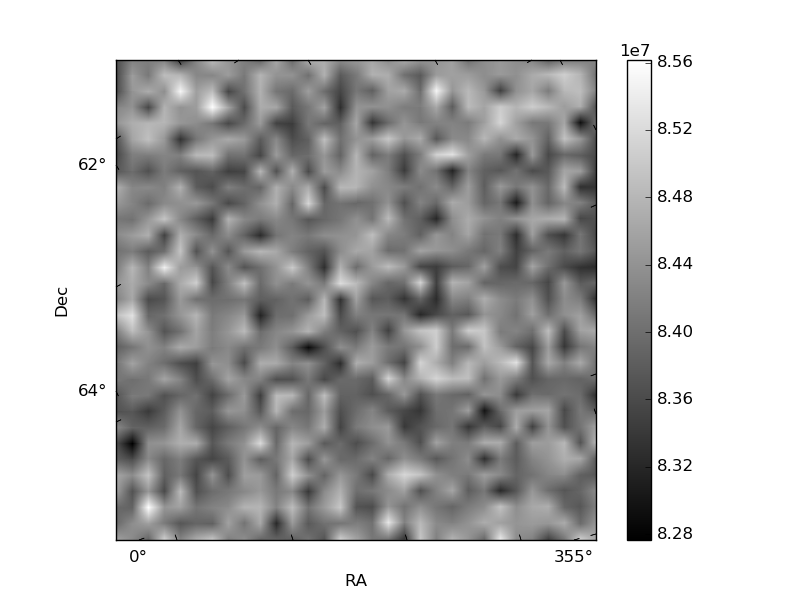
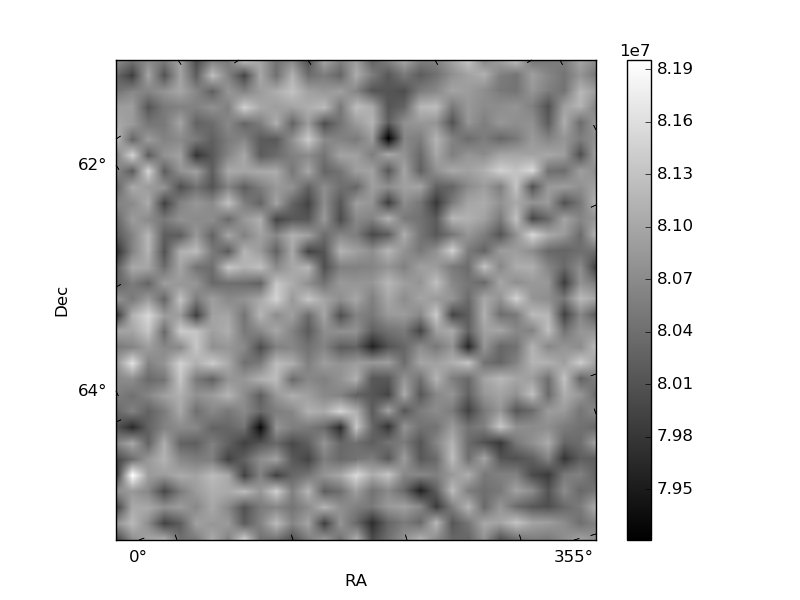
Histogram calculated using DETX and DETY for each event in the final _common_clean file
| Quadrant A | 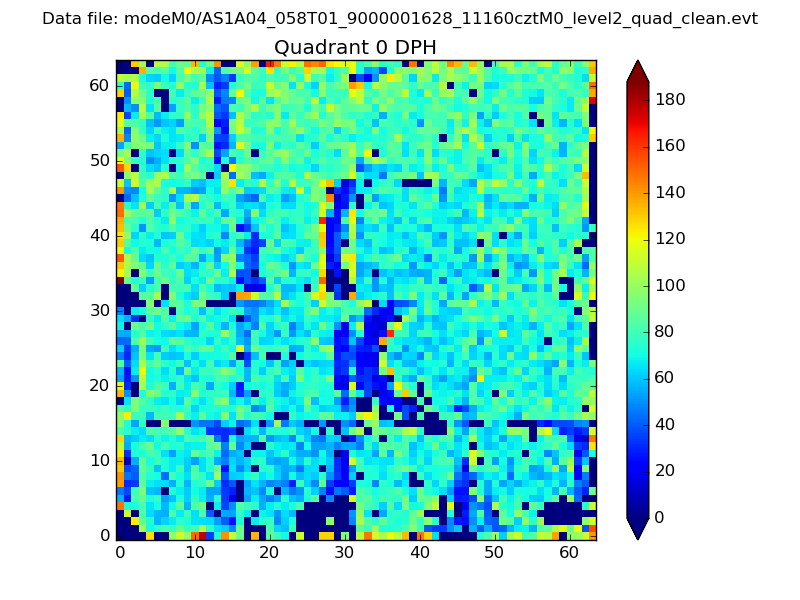 |
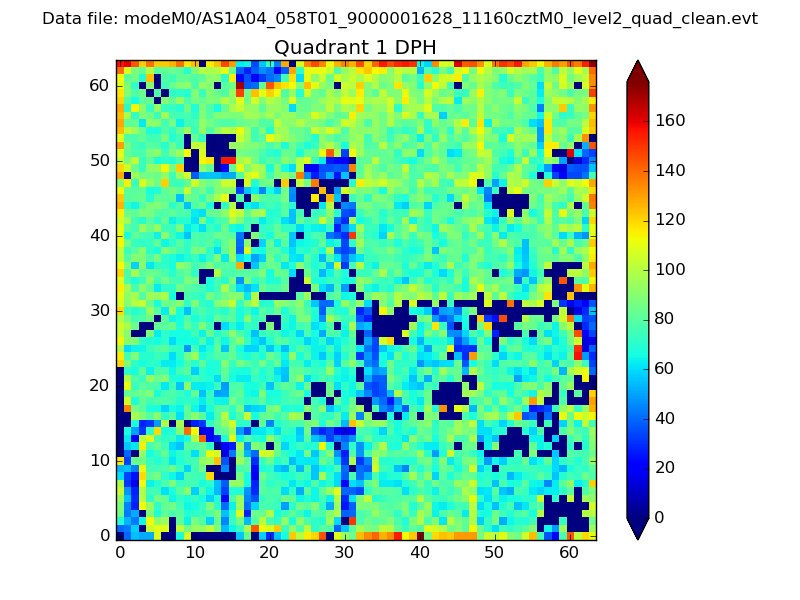 |
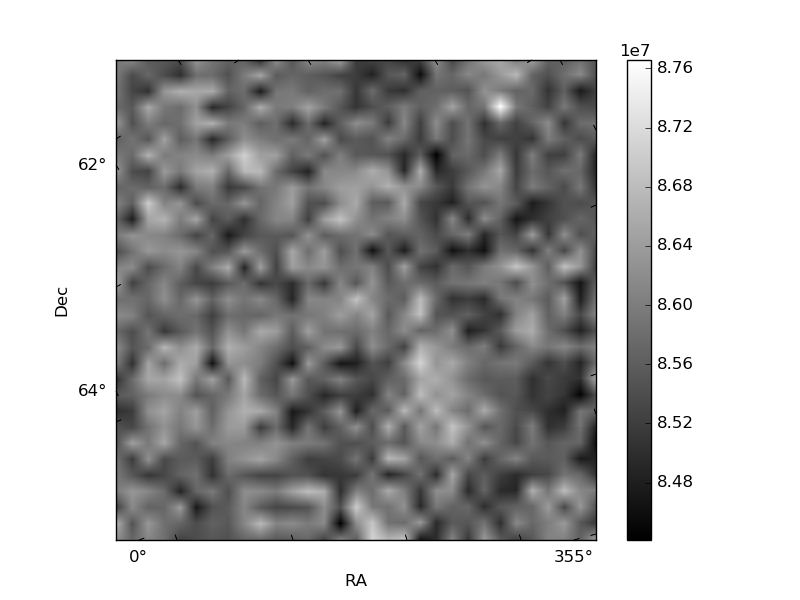
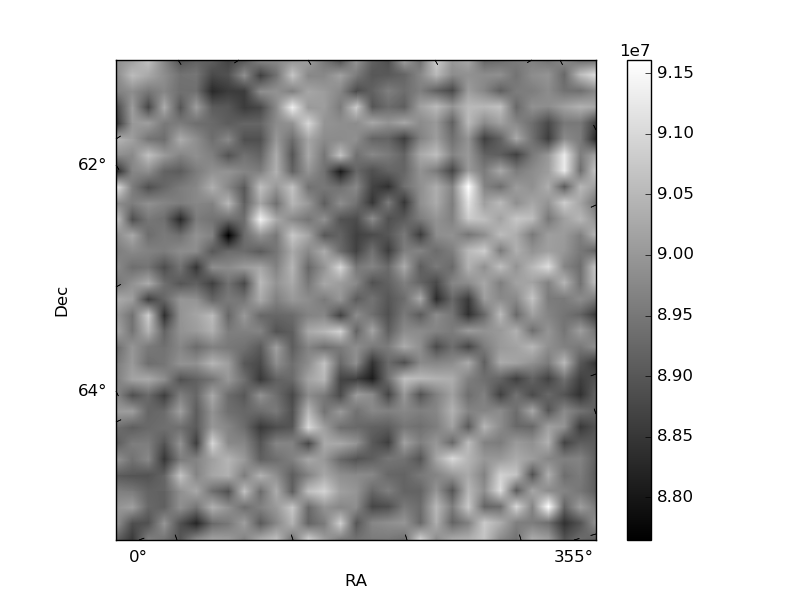
Quadrant B |
|---|---|---|---|
| Quadrant D | 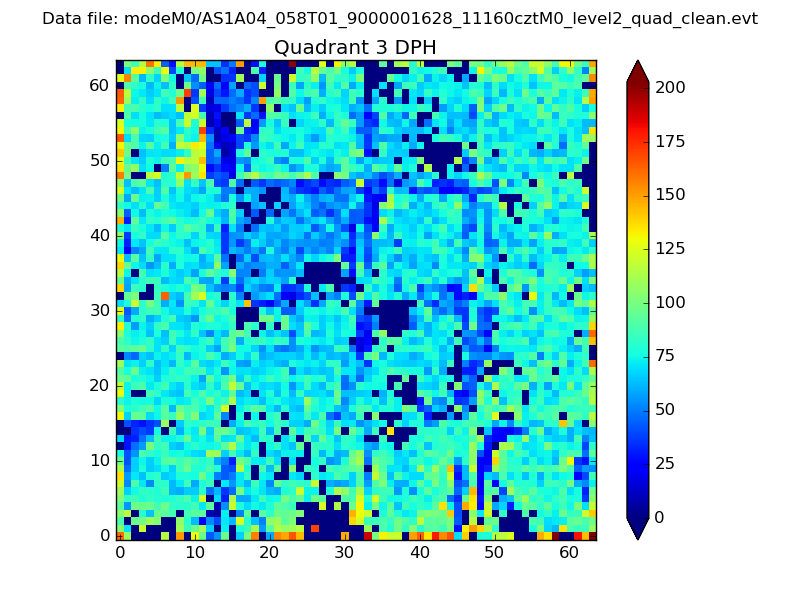 |
 |
Quadrant C |
| Plot type | Count rate plots | Images |
|---|---|---|
| Comparison with Poisson distribution Blue bars denote a histogram of data divided into 1 sec bins. Red curve is a Poisson curve with rate = median count rate of data. |
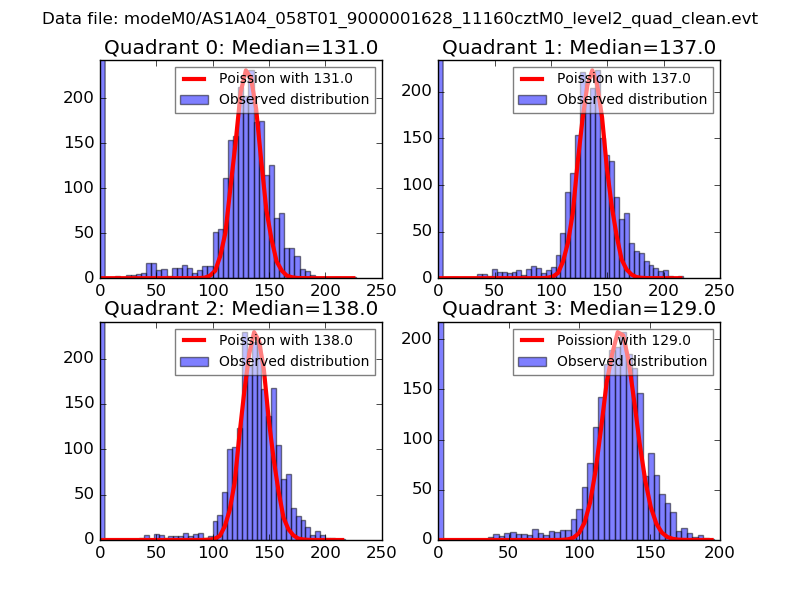 |
 |
| Quadrant-wise count rates Data is divided into 100 sec bins |
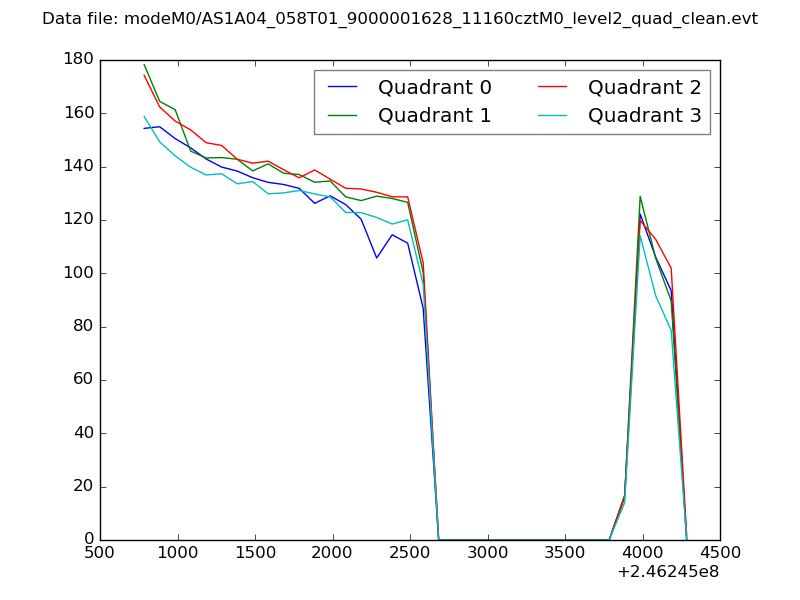 |
|
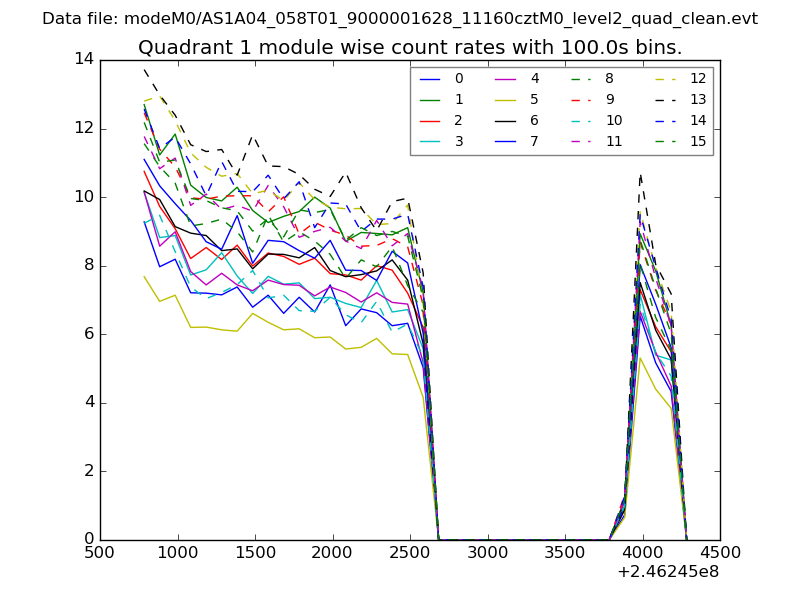
| Module-wise count rates for Quadrant A Data is divided into 100 sec bins |
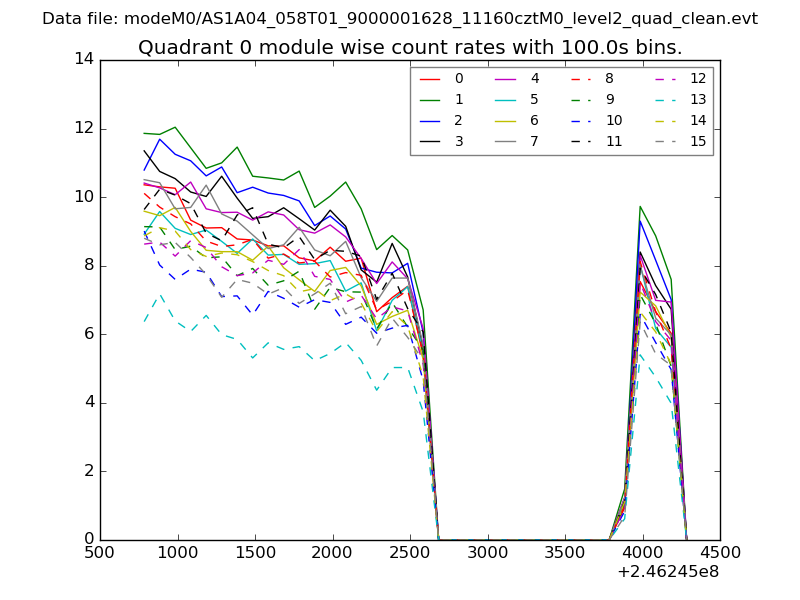 |
 |
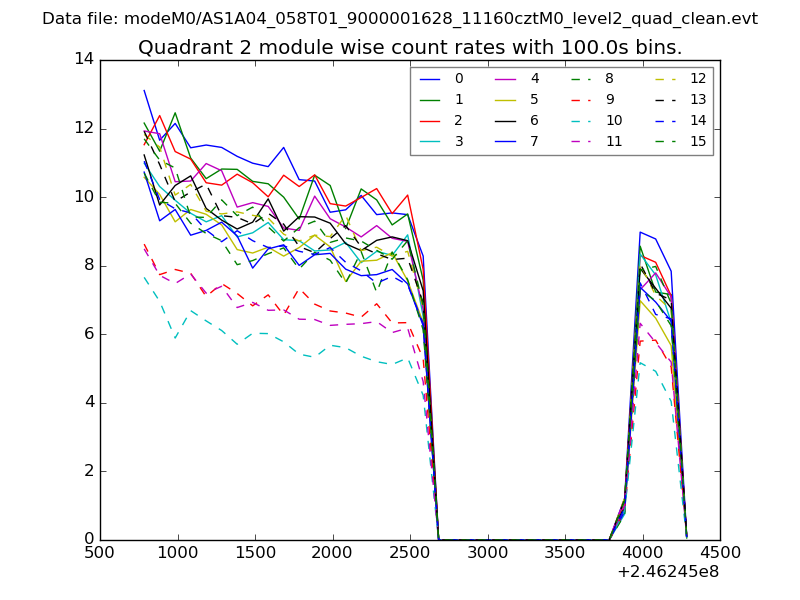
| Module-wise count rates for Quadrant B Data is divided into 100 sec bins |
 |
 |
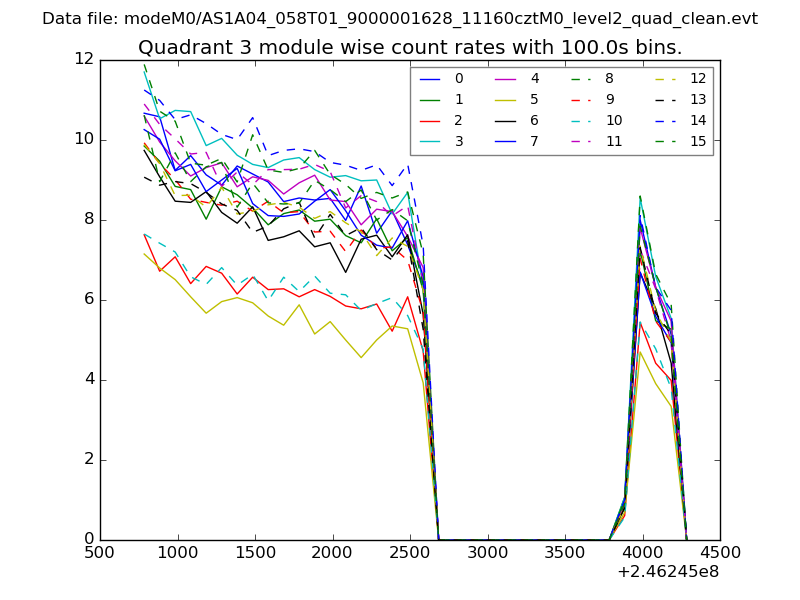
| Module-wise count rates for Quadrant C Data is divided into 100 sec bins |
 |
 |
| Module-wise count rates for Quadrant D Data is divided into 100 sec bins |
 |
 |
| Parameter | Plot |
|---|---|
| CZT HV Monitor | 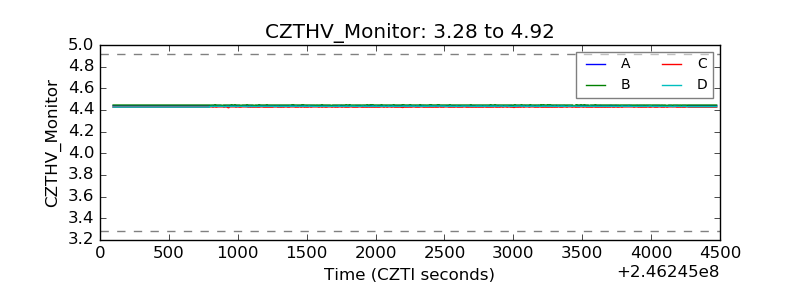 |
| D_VDD | 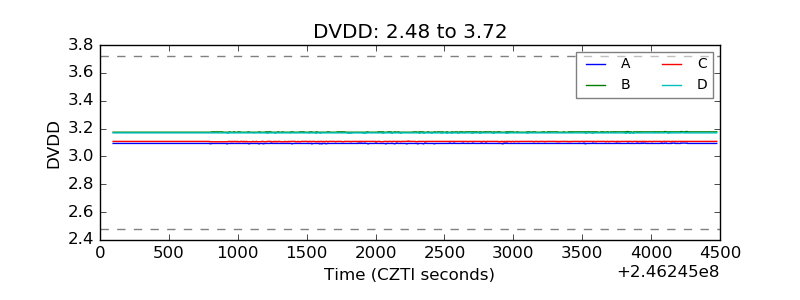 |
| Temperature 1 | 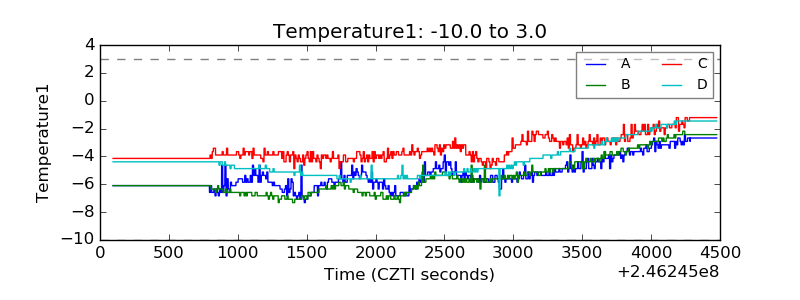 |
| Veto HV Monitor | 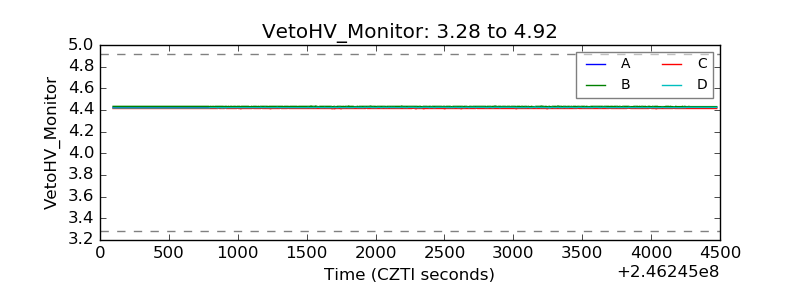 |
| Veto LLD | 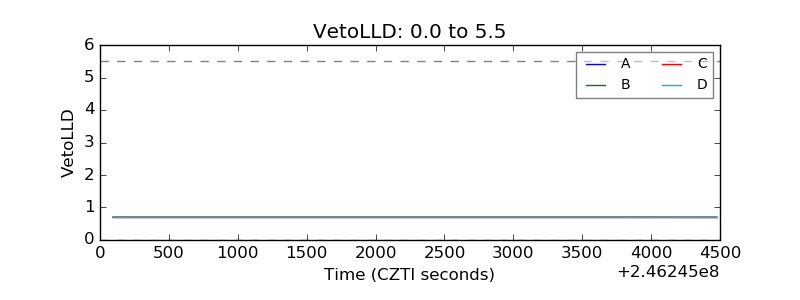 |
| Alpha Counter | 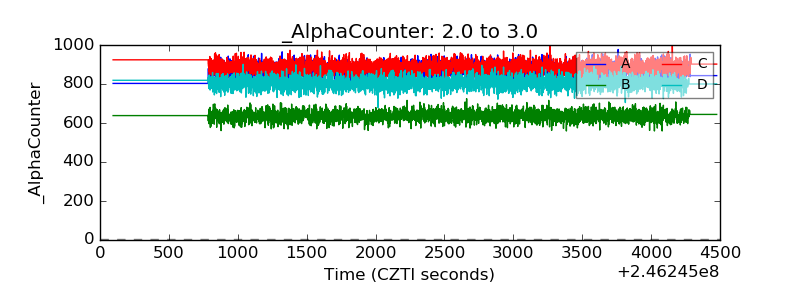 |
| _CPM_Rate | 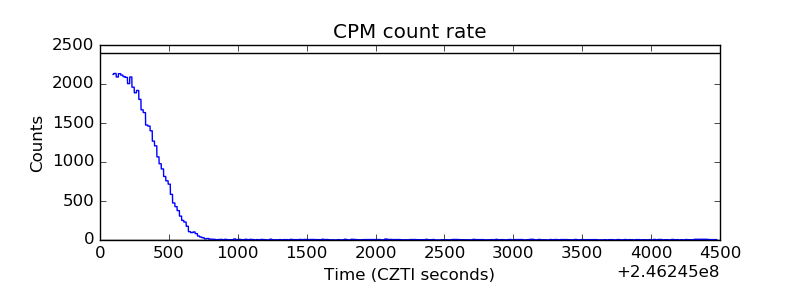 |
| CZT Counter | 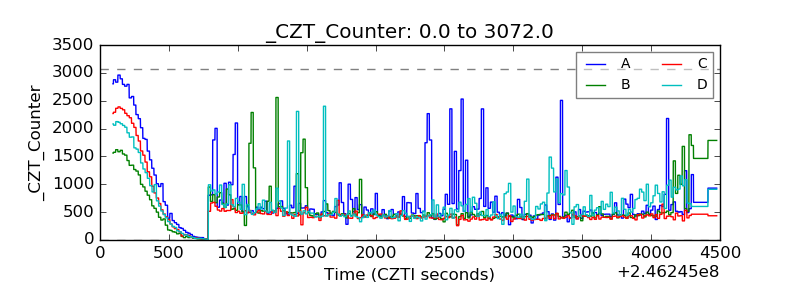 |
| +2.5 Volts monitor |  |
| +5 Volts monitor | 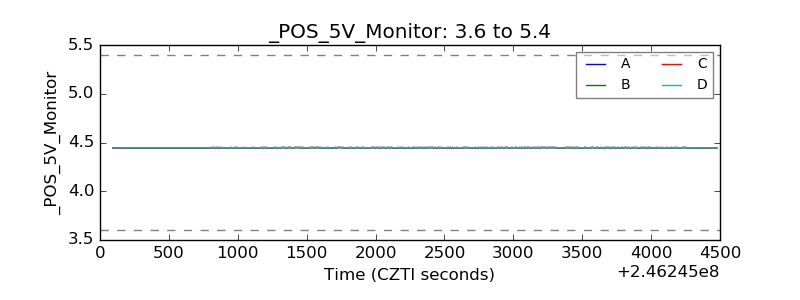 |
| _ROLL_ROT | 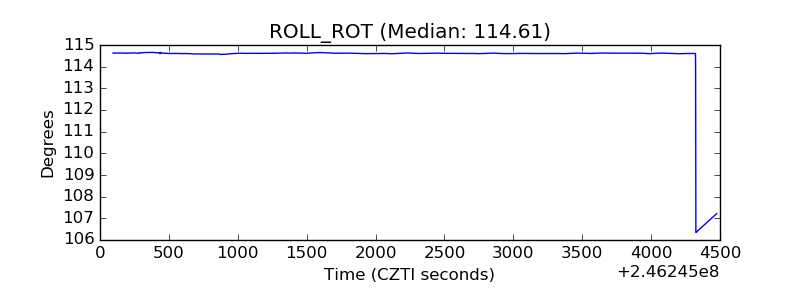 |
| _Roll_DEC | 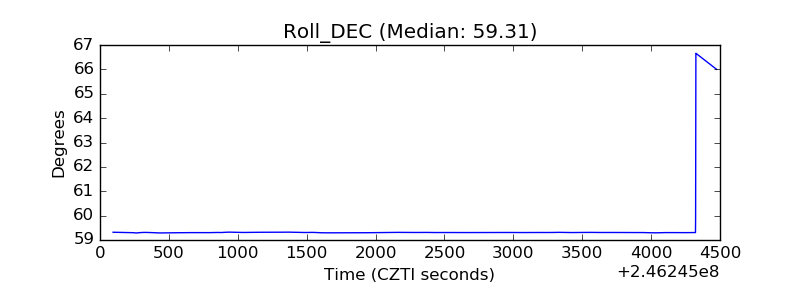 |
| _Roll_RA | 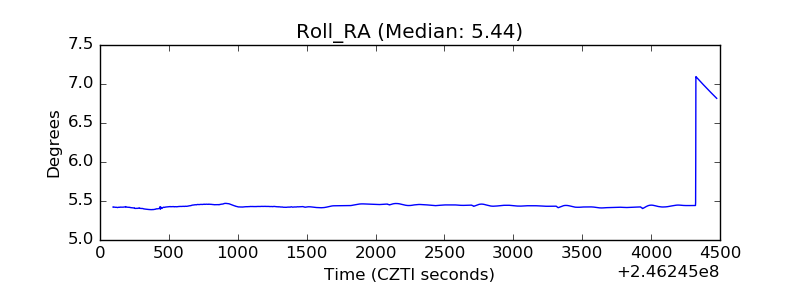 |
| Veto Counter | 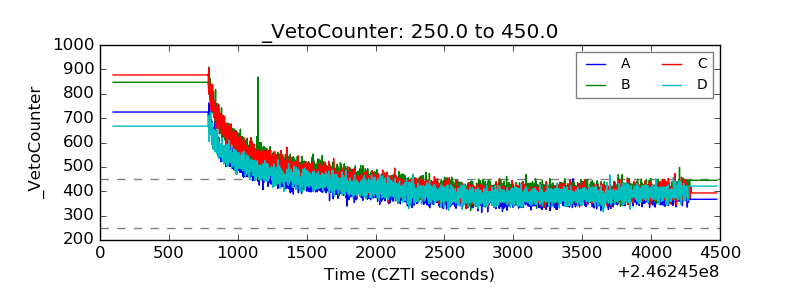 |