| Param | Original file | Final file |
|---|---|---|
| Filename | modeM0/AS1A04_058T01_9000001628_11161cztM0_level2.evt | modeM0/AS1A04_058T01_9000001628_11161cztM0_level2_quad_clean.evt |
| Size (bytes) | 40,386,240 | 3,516,480 |
| Size | 38.5 MB | 3.4 MB |
| Events in quadrant A | 305,130 | 14,500 |
| Events in quadrant B | 290,828 | 15,332 |
| Events in quadrant C | 266,631 | 14,006 |
| Events in quadrant D | 316,674 | 13,159 |
| Mode M0 | |||
|---|---|---|---|
| Quadrant | BADHDUFLAG | Total packets | Discarded packets |
| A | 0 | 3962 | 2693 |
| B | 0 | 3942 | 2708 |
| C | 0 | 3645 | 2409 |
| D | 0 | 4317 | 2990 |
| Mode SS | |||
|---|---|---|---|
| Quadrant | BADHDUFLAG | Total packets | Discarded packets |
| A | 0 | 36 | 24 |
| B | 0 | 35 | 27 |
| C | 0 | 35 | 25 |
| D | 0 | 36 | 22 |
| Mode M9 | |||
|---|---|---|---|
| Quadrant | BADHDUFLAG | Total packets | Discarded packets |
| A | 0 | 12 | 11 |
| B | 0 | 11 | 9 |
| C | 0 | 11 | 9 |
| D | 0 | 12 | 10 |
| Quadrant | Total seconds | Saturated seconds | Saturation percentage |
|---|---|---|---|
| A | 584 | 1 | 0.171233% |
| B | 596 | 2 | 0.335570% |
| C | 612 | 0 | 0.000000% |
| D | 566 | 3 | 0.530035% |
Noise dominated data is calculated using 1-second bins in cleaned event files. If a bin has >2000 counts, and if more than 50% of those come from <1% of pixels, then it is considered to be noise-dominated and hence unusable.
| Quadrant | # 1 sec bins | Bins with >0 counts | Bins with >2000 counts | High rate bins dominated by noise | Noise dominated (total time) | Noise dominated (detector-on time) | Marked lightcurve |
|---|---|---|---|---|---|---|---|
| A | 1390 | 852 | 0 | 0 | 0.00% | 0.00% | 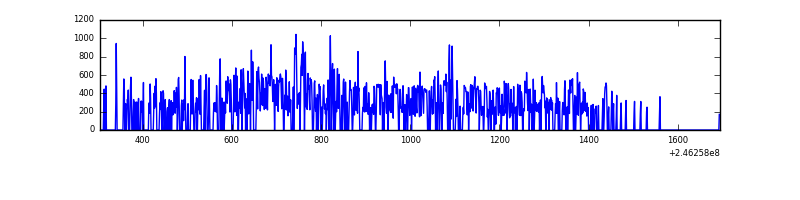 |
| B | 1247 | 849 | 0 | 0 | 0.00% | 0.00% | 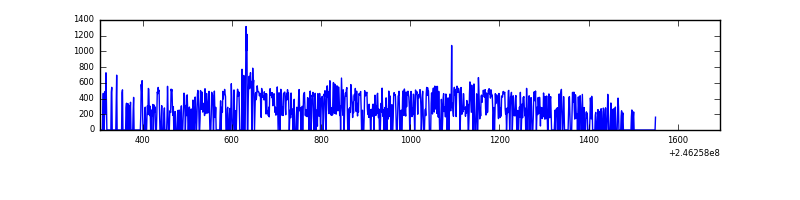 |
| C | 1259 | 903 | 0 | 0 | 0.00% | 0.00% | 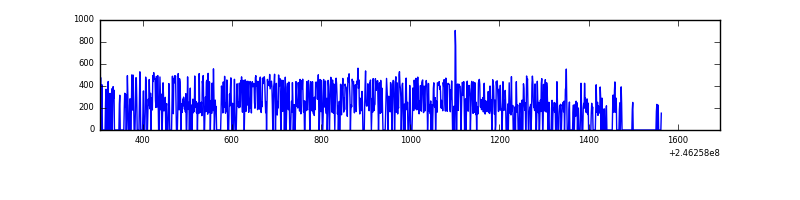 |
| D | 1279 | 841 | 1 | 1 | 0.08% | 0.12% | 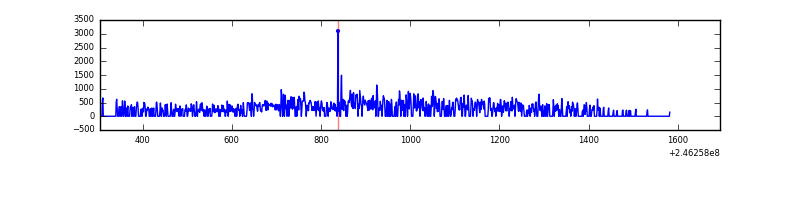 |
Top three noisy pixels from each quadrant. If the there are fewer than three noisy pixels in the level2.evt file, extra rows are filled as -1
| Pixel properties | Quadrant properties | ||||||
|---|---|---|---|---|---|---|---|
| Quadrant | DetID | PixID | Counts | Sigma | Mean | Median | Sigma |
| A | 8 | 15 | 30461 | 1968.89 | 65 | 63 | 15.4 |
| A | 8 | 5 | 14129 | 911.06 | 65 | 63 | 15.4 |
| A | 2 | 79 | 5999 | 384.48 | 65 | 63 | 15.4 |
| B | 4 | 239 | 12724 | 822.79 | 68 | 66 | 15.4 |
| B | 0 | 214 | 6271 | 403.34 | 68 | 66 | 15.4 |
| B | 3 | 189 | 2009 | 126.3 | 68 | 66 | 15.4 |
| C | 5 | 128 | 1259 | 67.12 | 67 | 67 | 17.8 |
| C | 13 | 61 | 517 | 25.34 | 67 | 67 | 17.8 |
| C | 3 | 202 | 162 | 5.35 | 67 | 67 | 17.8 |
| D | 10 | 157 | 68941 | 4147.1 | 60 | 58 | 16.6 |
| D | 13 | 249 | 6262 | 373.51 | 60 | 58 | 16.6 |
| D | 1 | 52 | 2396 | 140.76 | 60 | 58 | 16.6 |
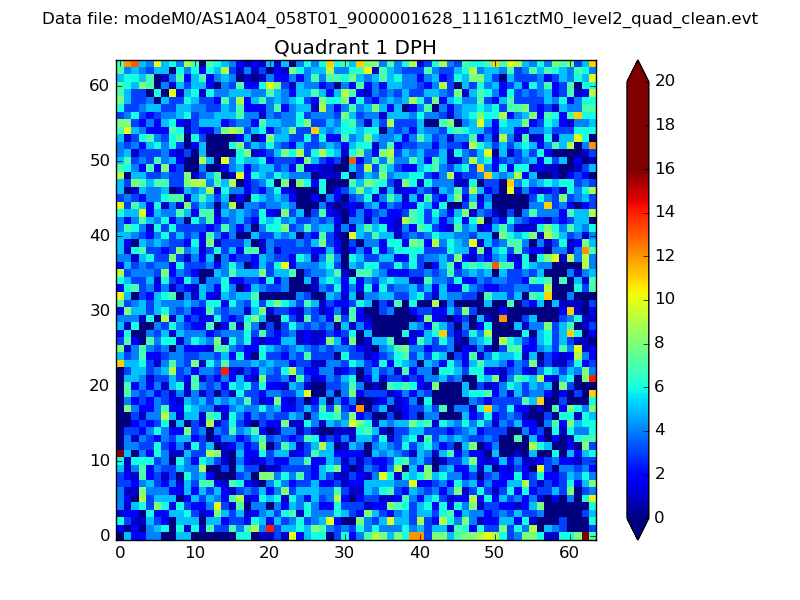
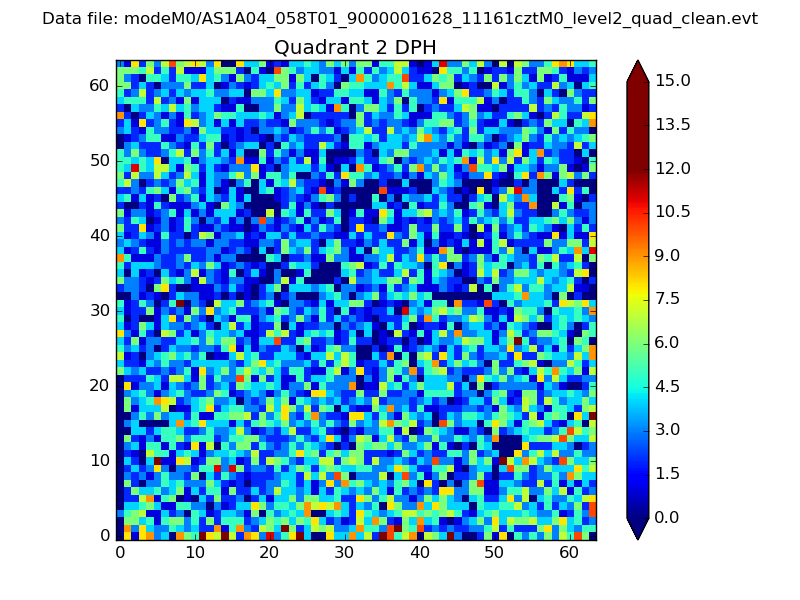
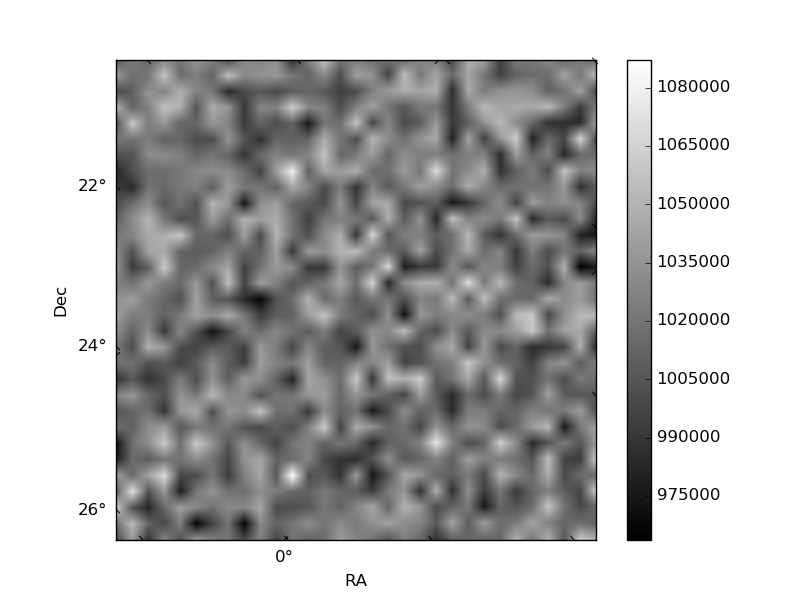
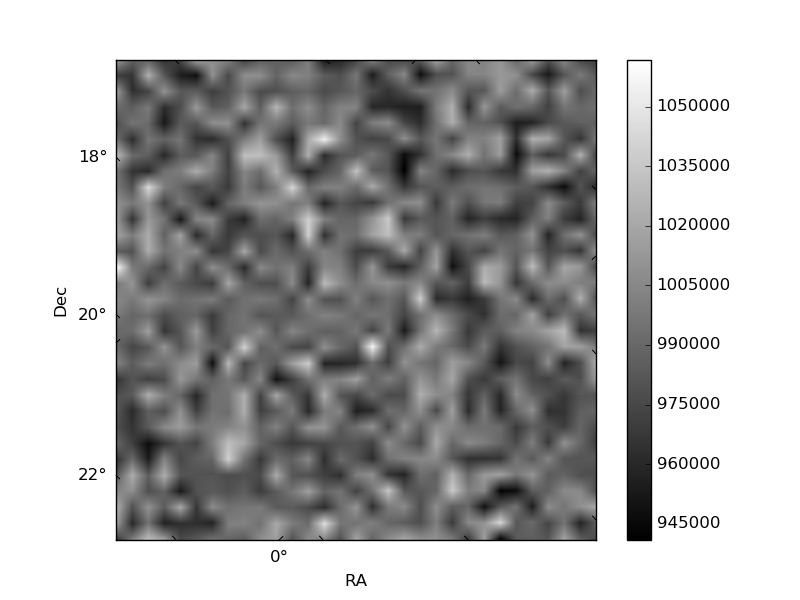
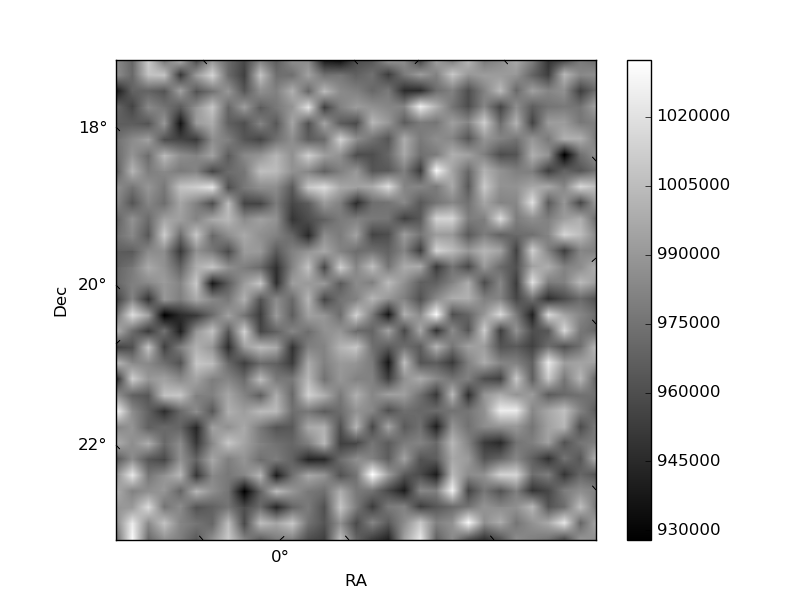
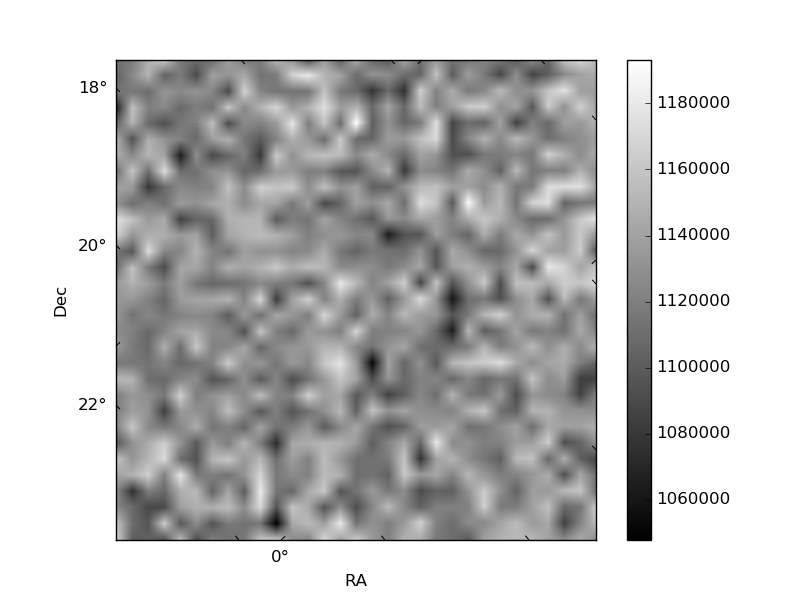
Histogram calculated using DETX and DETY for each event in the final _common_clean file
| Quadrant A |  |
 |
Quadrant B |
|---|---|---|---|
| Quadrant D |  |
 |
Quadrant C |
| Plot type | Count rate plots | Images |
|---|---|---|
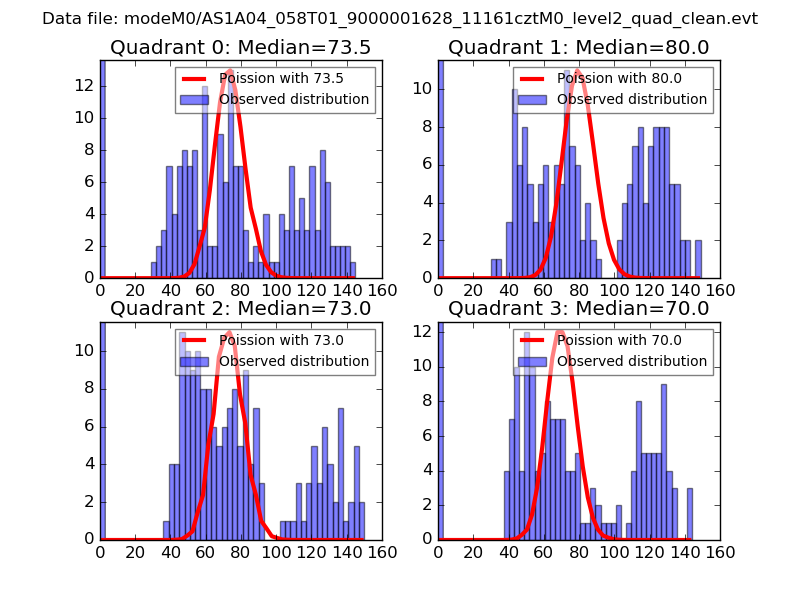
| Comparison with Poisson distribution Blue bars denote a histogram of data divided into 1 sec bins. Red curve is a Poisson curve with rate = median count rate of data. |
 |
 |
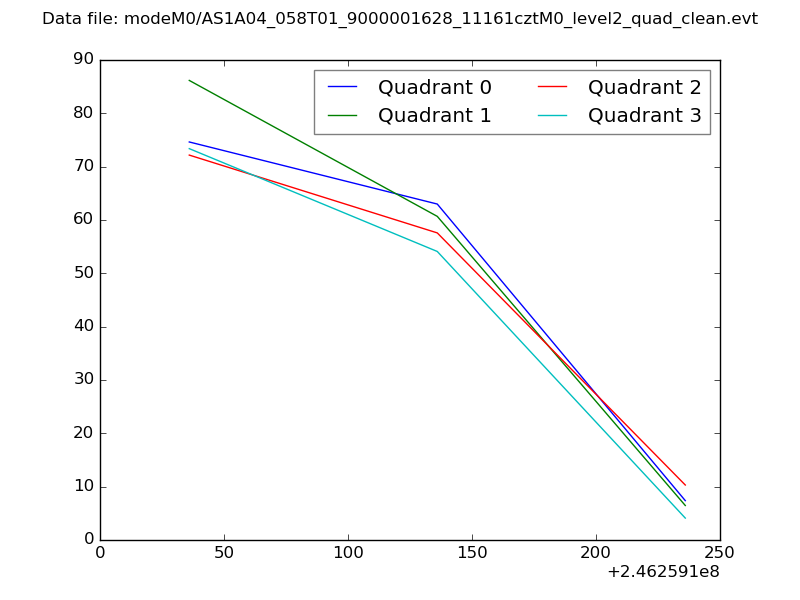
| Quadrant-wise count rates Data is divided into 100 sec bins |
 |
|
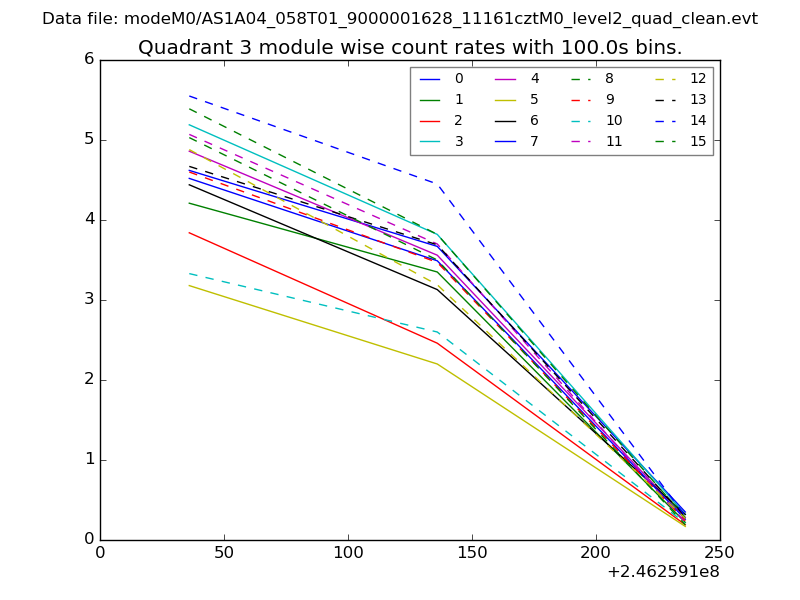
| Module-wise count rates for Quadrant A Data is divided into 100 sec bins |
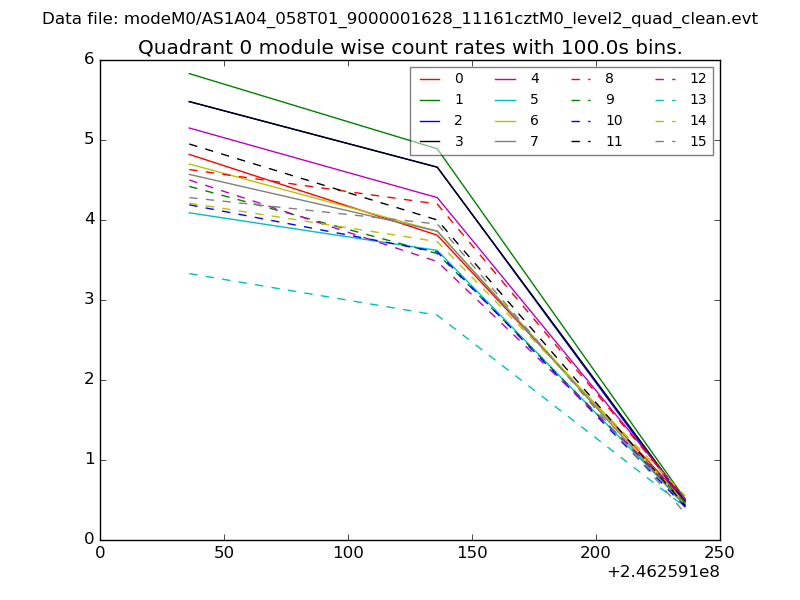 |
 |
| Module-wise count rates for Quadrant B Data is divided into 100 sec bins |
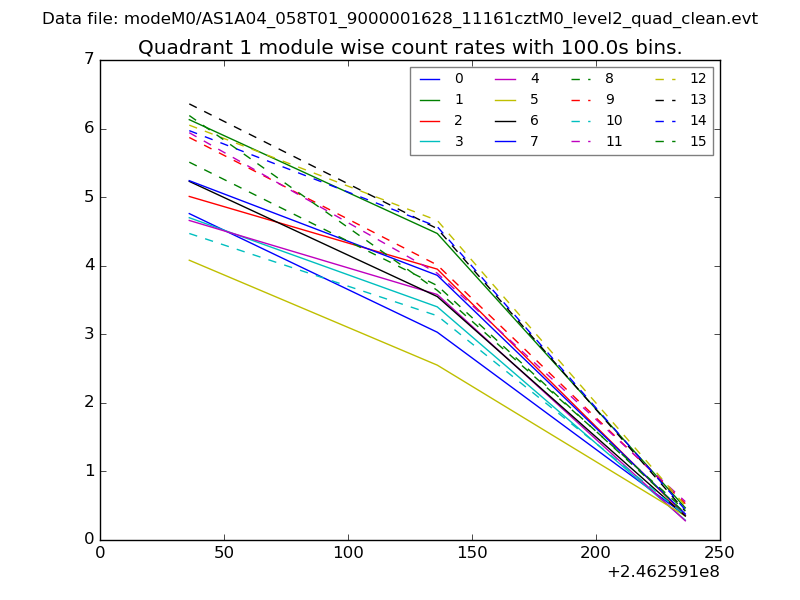 |
 |
| Module-wise count rates for Quadrant C Data is divided into 100 sec bins |
 |
 |
| Module-wise count rates for Quadrant D Data is divided into 100 sec bins |
 |
 |
| Parameter | Plot |
|---|---|
| CZT HV Monitor | 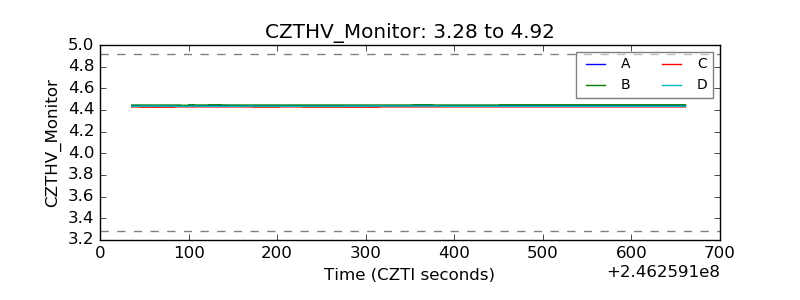 |
| D_VDD | 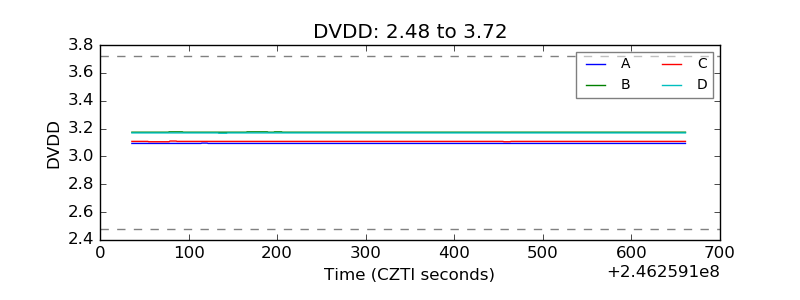 |
| Temperature 1 | 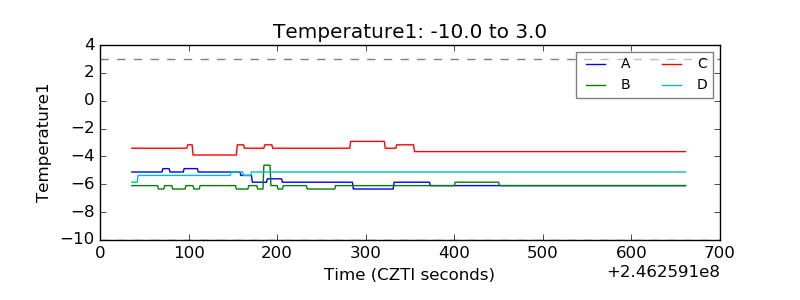 |
| Veto HV Monitor | 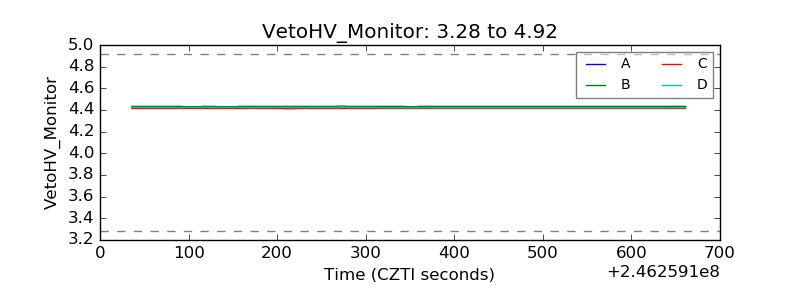 |
| Veto LLD | 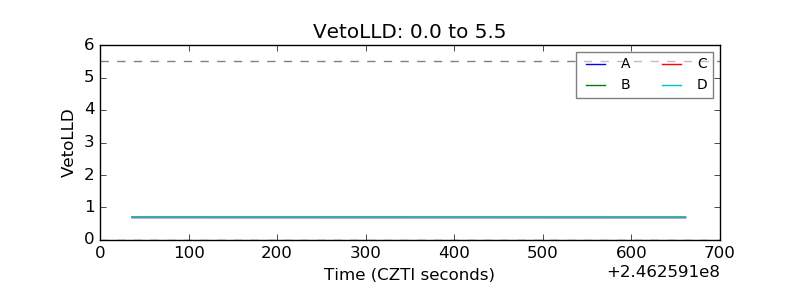 |
| Alpha Counter | 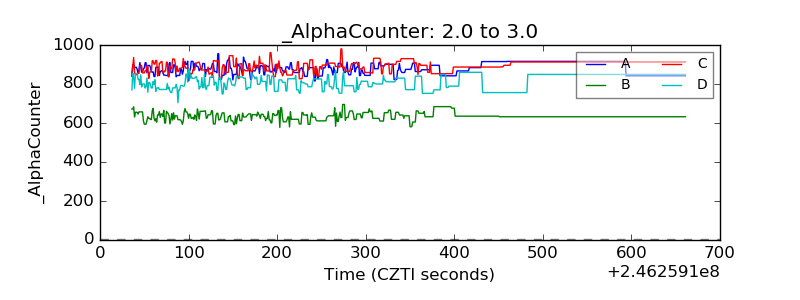 |
| _CPM_Rate | 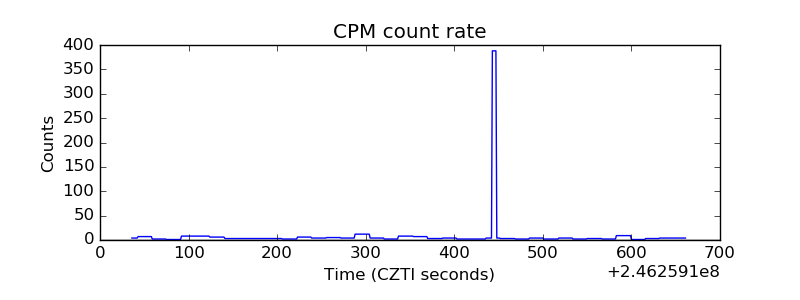 |
| CZT Counter | 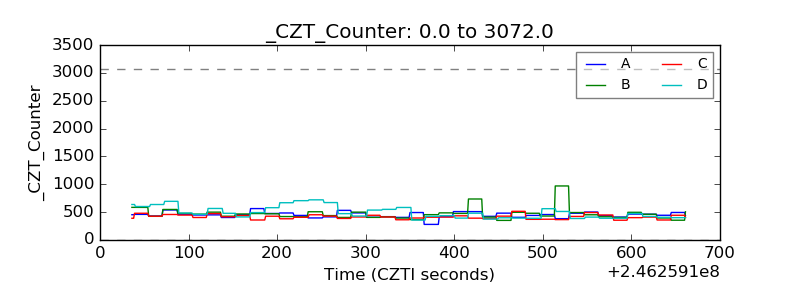 |
| +2.5 Volts monitor |  |
| +5 Volts monitor | 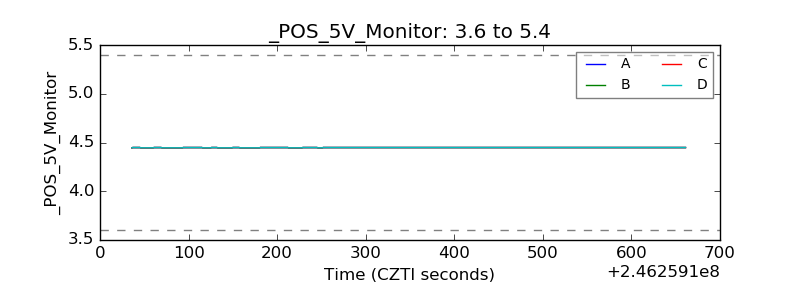 |
| _ROLL_ROT | 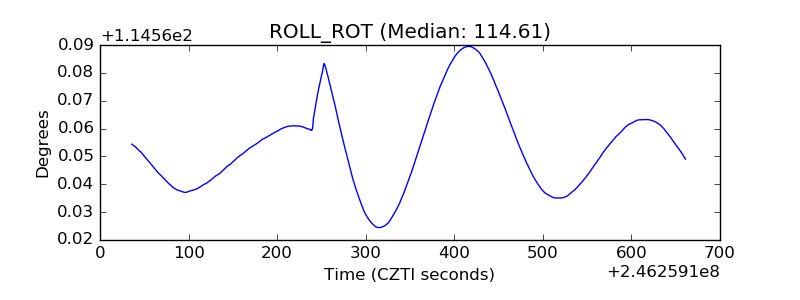 |
| _Roll_DEC | 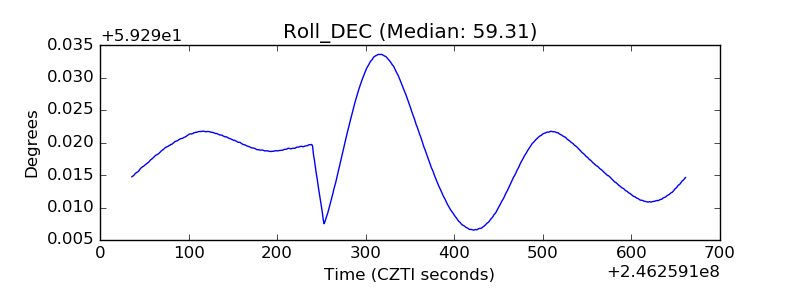 |
| _Roll_RA | 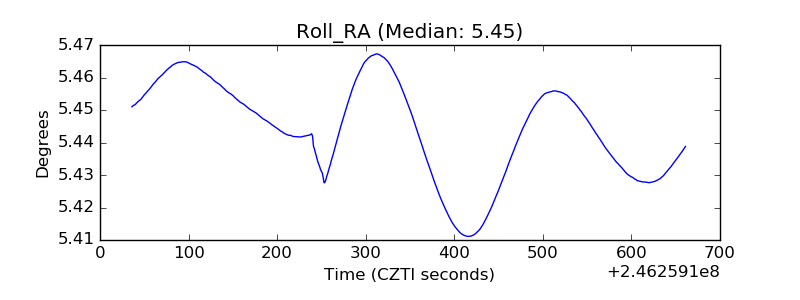 |
| Veto Counter | 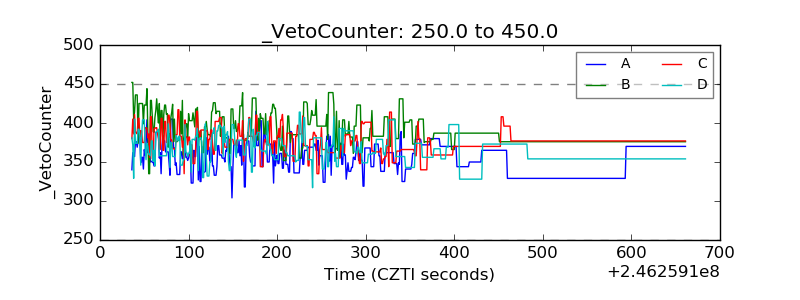 |