| Param | Original file | Final file |
|---|---|---|
| Filename | modeM0/AS1A04_058T01_9000001628_11162cztM0_level2.evt | modeM0/AS1A04_058T01_9000001628_11162cztM0_level2_quad_clean.evt |
| Size (bytes) | 2,149,018,560 | 133,905,600 |
| Size | 2.0 GB | 127.7 MB |
| Events in quadrant A | 18,464,335 | 581,677 |
| Events in quadrant B | 14,782,795 | 595,149 |
| Events in quadrant C | 11,366,769 | 603,377 |
| Events in quadrant D | 18,760,451 | 529,399 |
| Mode M0 | |||
|---|---|---|---|
| Quadrant | BADHDUFLAG | Total packets | Discarded packets |
| A | 0 | 92435 | 21089 |
| B | 0 | 75761 | 14770 |
| C | 0 | 63061 | 10949 |
| D | 0 | 90839 | 17099 |
| Mode SS | |||
|---|---|---|---|
| Quadrant | BADHDUFLAG | Total packets | Discarded packets |
| A | 0 | 632 | 112 |
| B | 0 | 637 | 115 |
| C | 0 | 632 | 122 |
| D | 0 | 631 | 115 |
| Mode M9 | |||
|---|---|---|---|
| Quadrant | BADHDUFLAG | Total packets | Discarded packets |
| A | 0 | 75 | 17 |
| B | 0 | 76 | 16 |
| C | 0 | 75 | 14 |
| D | 0 | 75 | 14 |
| Quadrant | Total seconds | Saturated seconds | Saturation percentage |
|---|---|---|---|
| A | 25161 | 1908 | 7.583164% |
| B | 25398 | 856 | 3.370344% |
| C | 25526 | 105 | 0.411345% |
| D | 25279 | 1075 | 4.252542% |
Noise dominated data is calculated using 1-second bins in cleaned event files. If a bin has >2000 counts, and if more than 50% of those come from <1% of pixels, then it is considered to be noise-dominated and hence unusable.
| Quadrant | # 1 sec bins | Bins with >0 counts | Bins with >2000 counts | High rate bins dominated by noise | Noise dominated (total time) | Noise dominated (detector-on time) | Marked lightcurve |
|---|---|---|---|---|---|---|---|
| A | 43277 | 25666 | 1138 | 1138 | 2.63% | 4.43% | 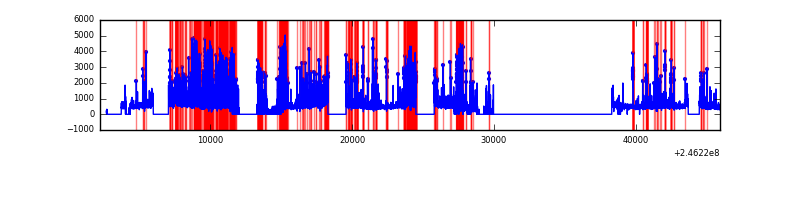 |
| B | 42237 | 25957 | 372 | 372 | 0.88% | 1.43% | 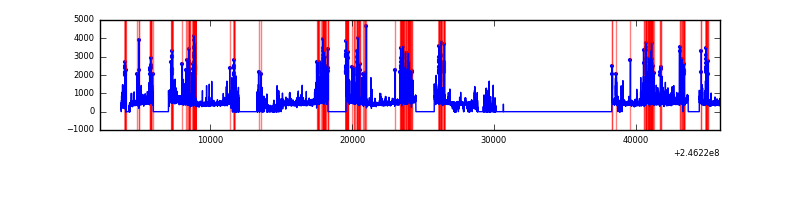 |
| C | 43734 | 26089 | 6 | 6 | 0.01% | 0.02% | 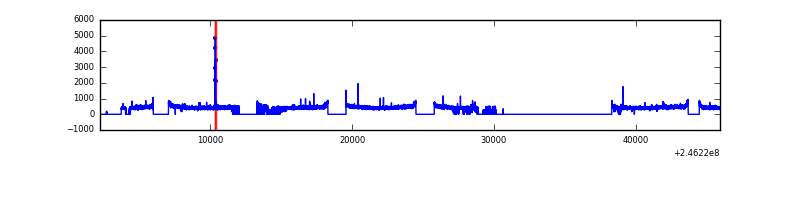 |
| D | 43723 | 25810 | 705 | 705 | 1.61% | 2.73% | 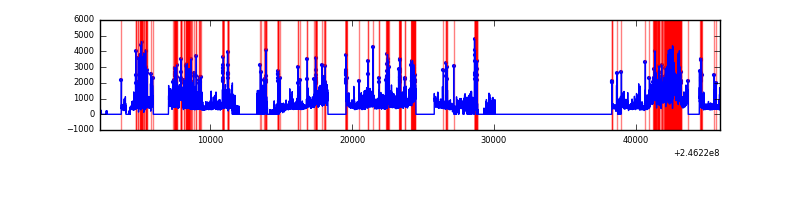 |
Top three noisy pixels from each quadrant. If the there are fewer than three noisy pixels in the level2.evt file, extra rows are filled as -1
| Pixel properties | Quadrant properties | ||||||
|---|---|---|---|---|---|---|---|
| Quadrant | DetID | PixID | Counts | Sigma | Mean | Median | Sigma |
| A | 14 | 238 | 3125567 | 5552.28 | 2811 | 2748 | 562.4 |
| A | 8 | 5 | 3057517 | 5431.29 | 2811 | 2748 | 562.4 |
| A | 8 | 15 | 1235048 | 2190.99 | 2811 | 2748 | 562.4 |
| B | 4 | 239 | 2307742 | 4261.79 | 2945 | 2871 | 540.8 |
| B | 15 | 204 | 231422 | 422.6 | 2945 | 2871 | 540.8 |
| B | 0 | 214 | 165908 | 301.46 | 2945 | 2871 | 540.8 |
| C | 5 | 128 | 33110 | 45.7 | 2899 | 2908 | 660.8 |
| C | 13 | 61 | 21724 | 28.47 | 2899 | 2908 | 660.8 |
| C | 9 | 204 | 18881 | 24.17 | 2899 | 2908 | 660.8 |
| D | 10 | 157 | 3646271 | 5138.28 | 2757 | 2698 | 709.1 |
| D | 1 | 52 | 832317 | 1169.95 | 2757 | 2698 | 709.1 |
| D | 12 | 16 | 719870 | 1011.38 | 2757 | 2698 | 709.1 |
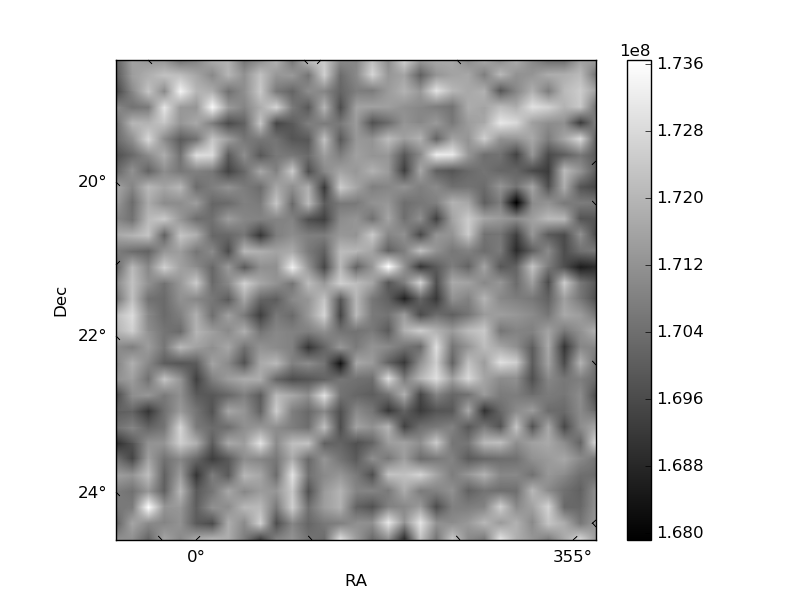
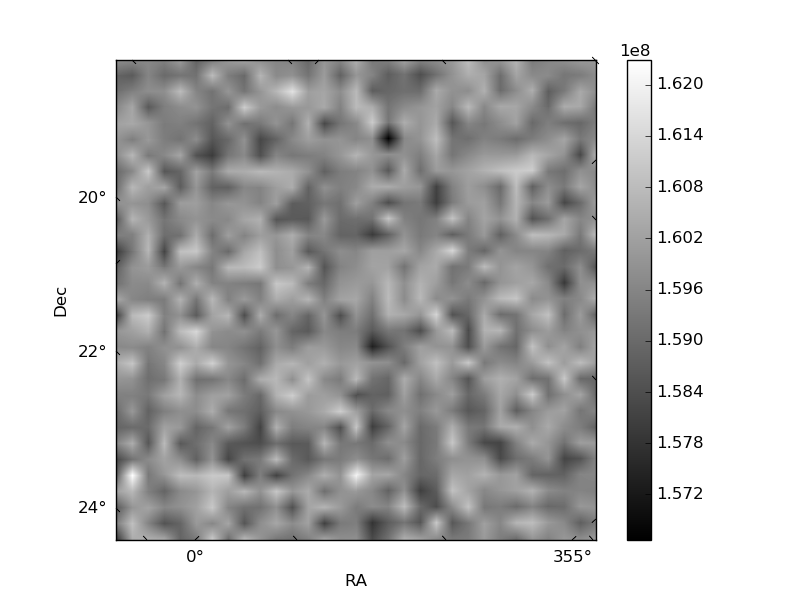
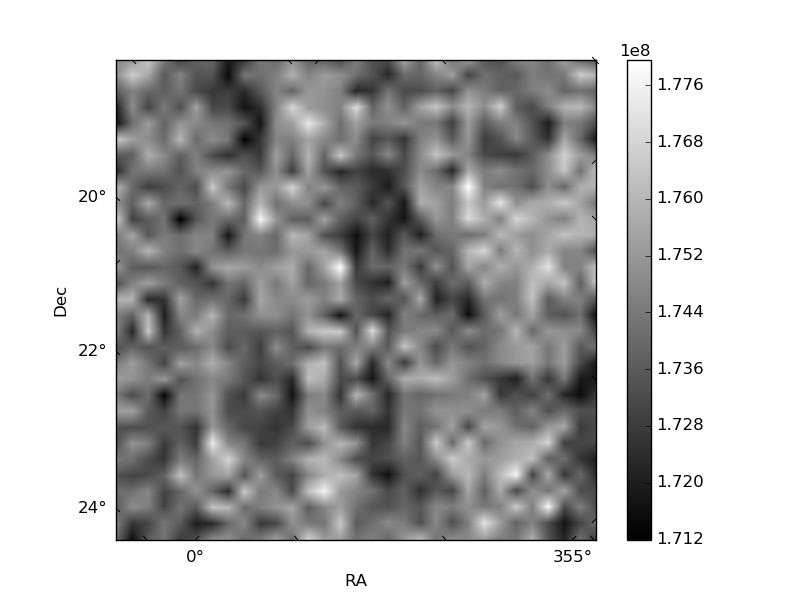
Histogram calculated using DETX and DETY for each event in the final _common_clean file
| Quadrant A | 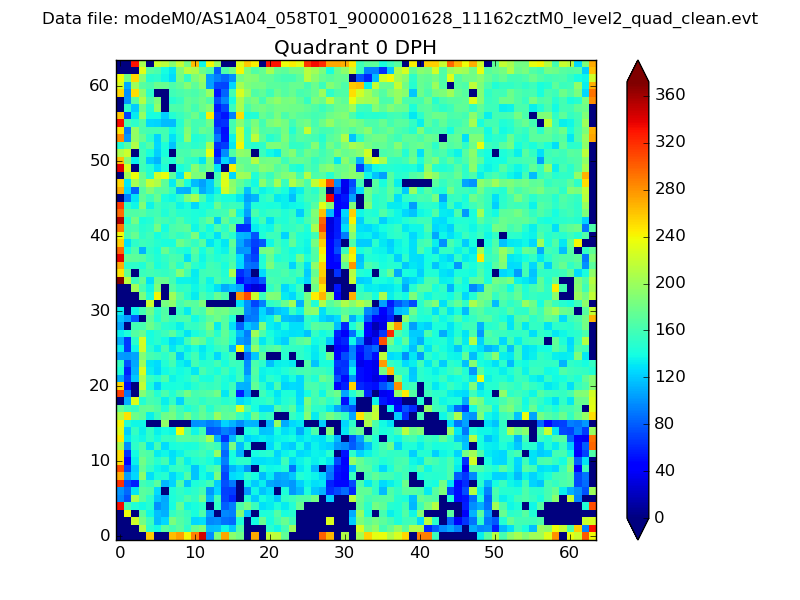 |
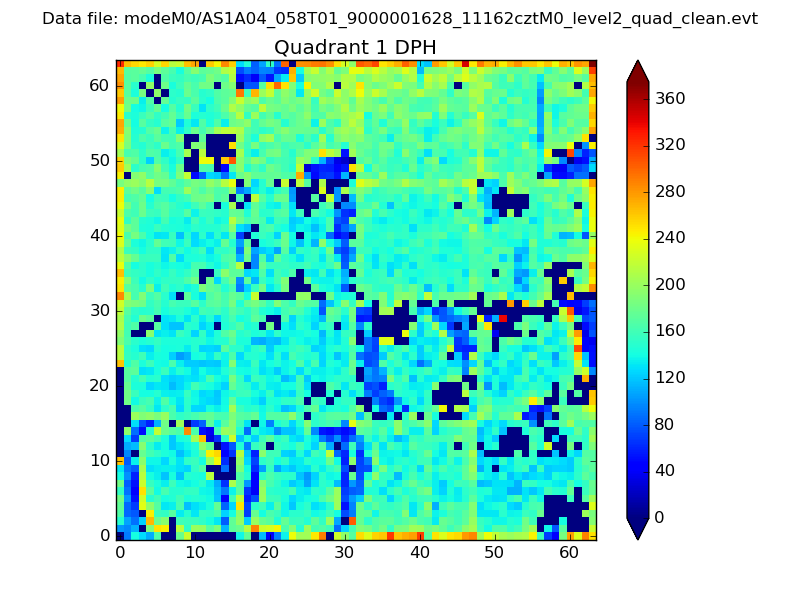 |
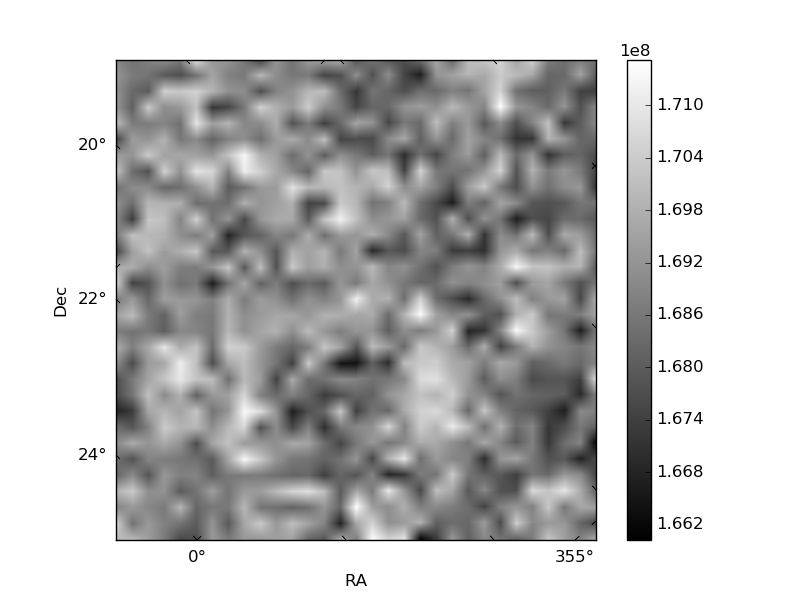
Quadrant B |
|---|---|---|---|
| Quadrant D | 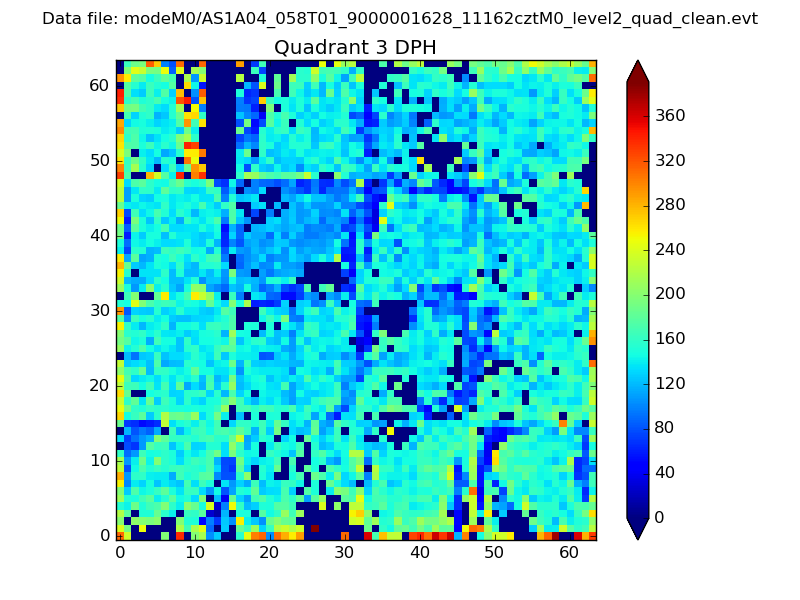 |
 |
Quadrant C |
| Plot type | Count rate plots | Images |
|---|---|---|
| Comparison with Poisson distribution Blue bars denote a histogram of data divided into 1 sec bins. Red curve is a Poisson curve with rate = median count rate of data. |
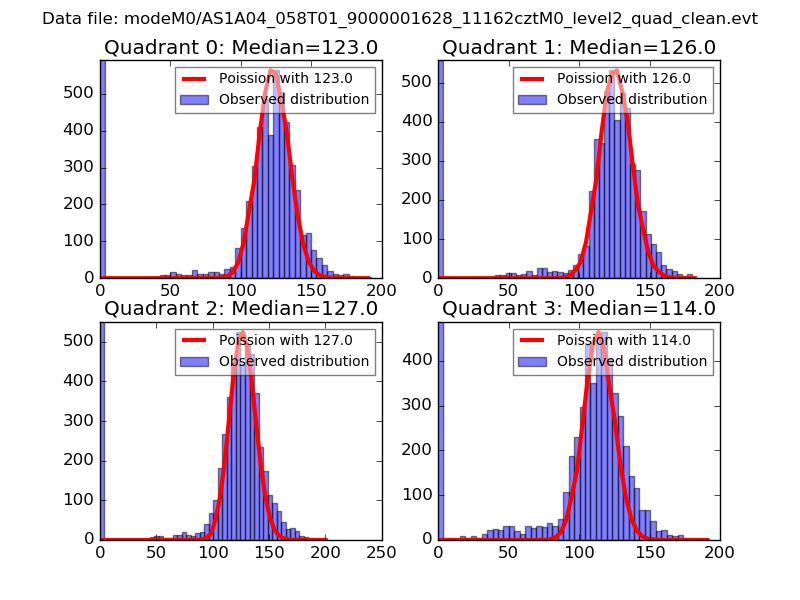 |
 |
| Quadrant-wise count rates Data is divided into 100 sec bins |
 |
|
| Module-wise count rates for Quadrant A Data is divided into 100 sec bins |
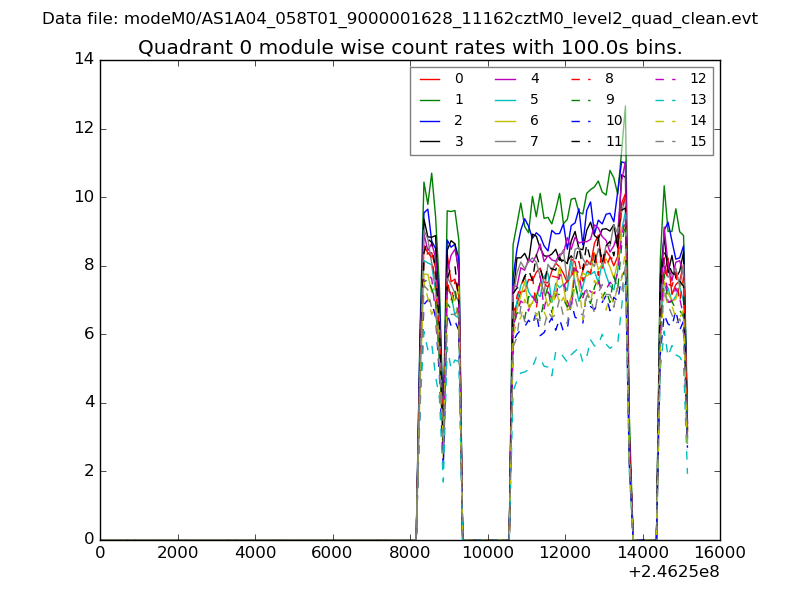 |
 |
| Module-wise count rates for Quadrant B Data is divided into 100 sec bins |
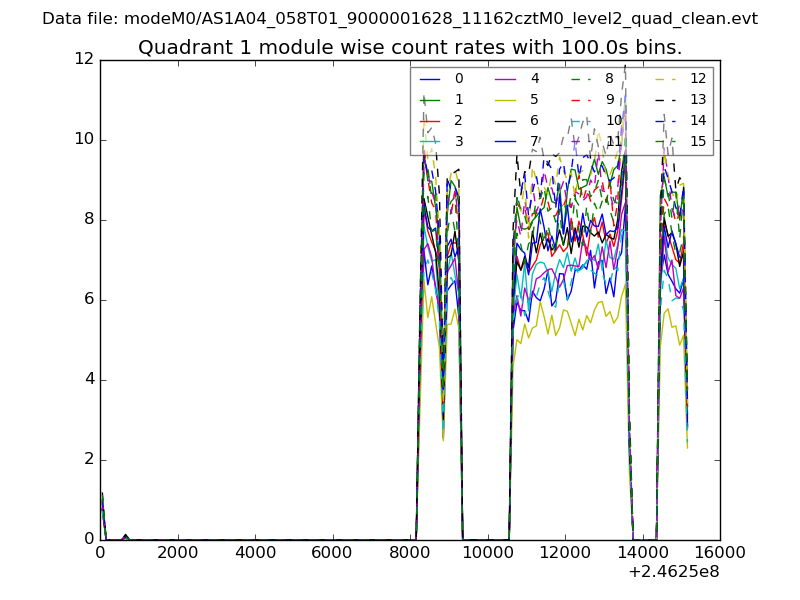 |
 |
| Module-wise count rates for Quadrant C Data is divided into 100 sec bins |
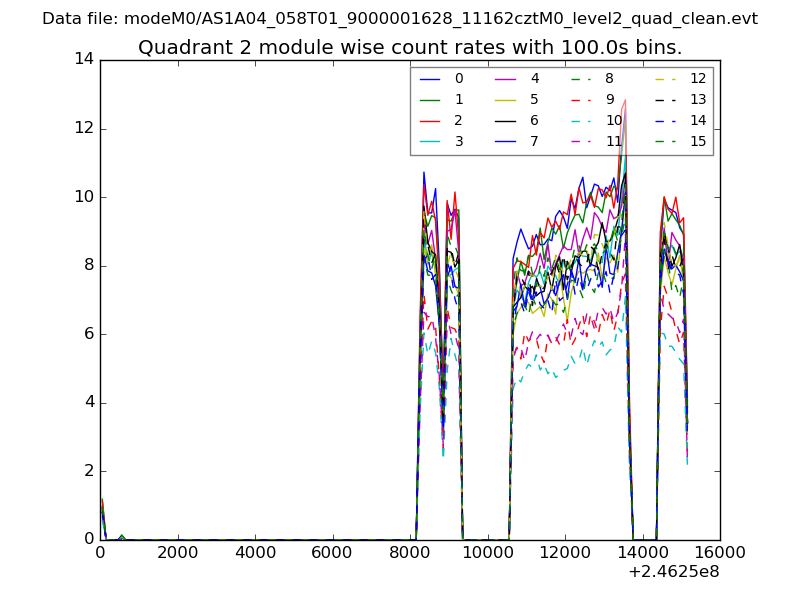 |
 |
| Module-wise count rates for Quadrant D Data is divided into 100 sec bins |
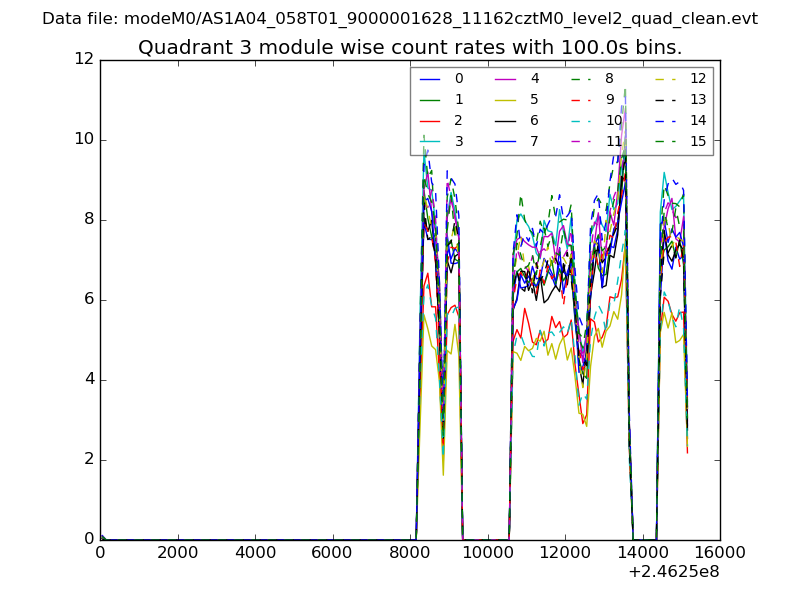 |
 |
| Parameter | Plot |
|---|---|
| CZT HV Monitor | 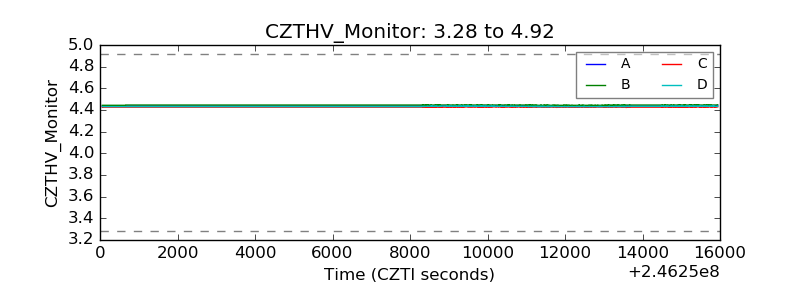 |
| D_VDD | 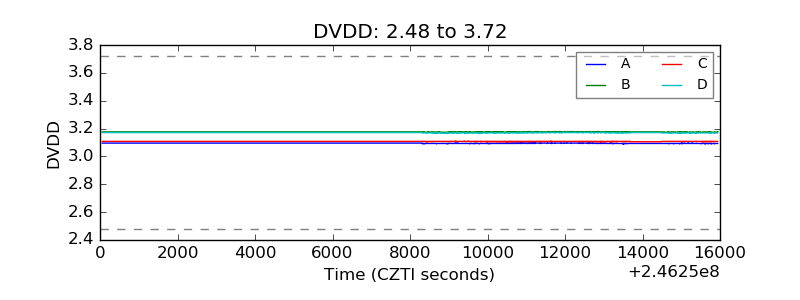 |
| Temperature 1 | 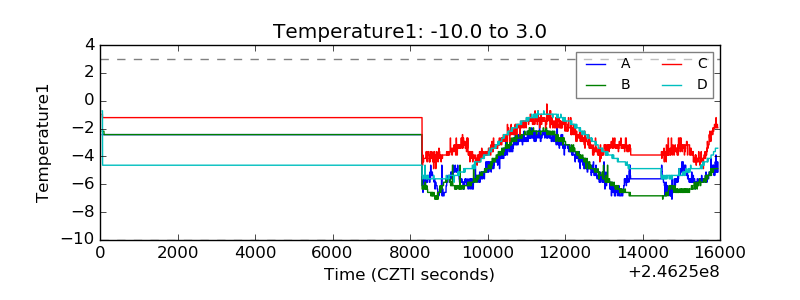 |
| Veto HV Monitor | 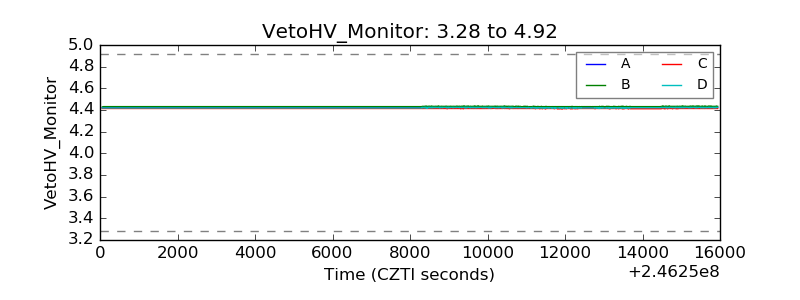 |
| Veto LLD | 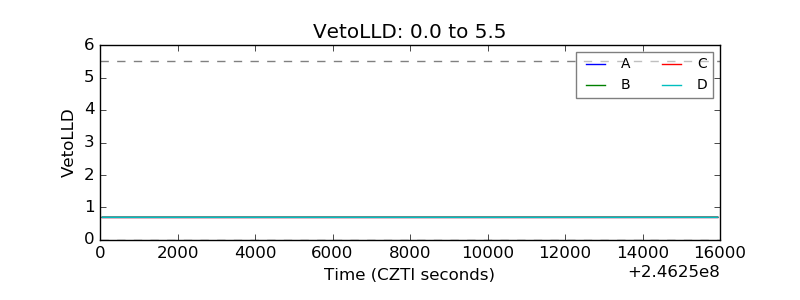 |
| Alpha Counter | 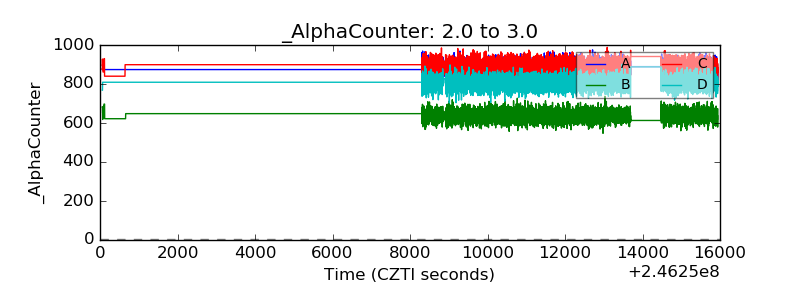 |
| _CPM_Rate |  |
| CZT Counter | 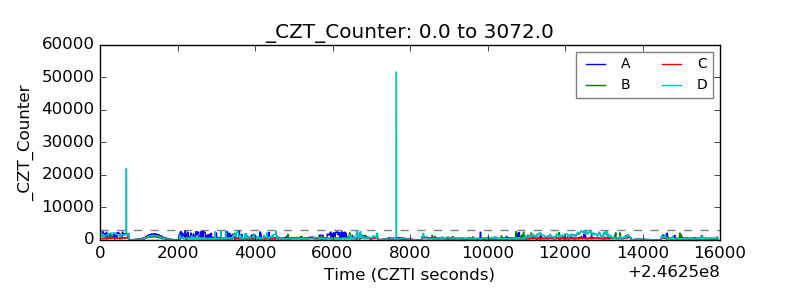 |
| +2.5 Volts monitor |  |
| +5 Volts monitor |  |
| _ROLL_ROT | 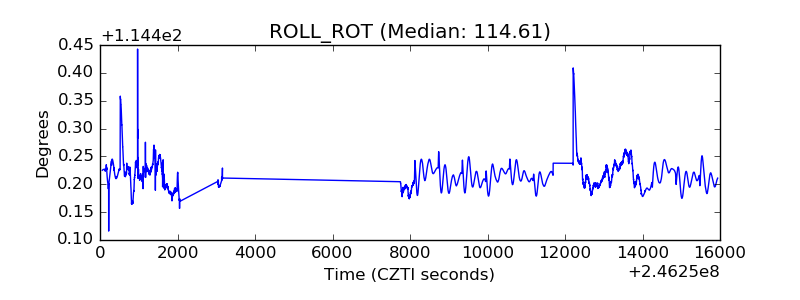 |
| _Roll_DEC | 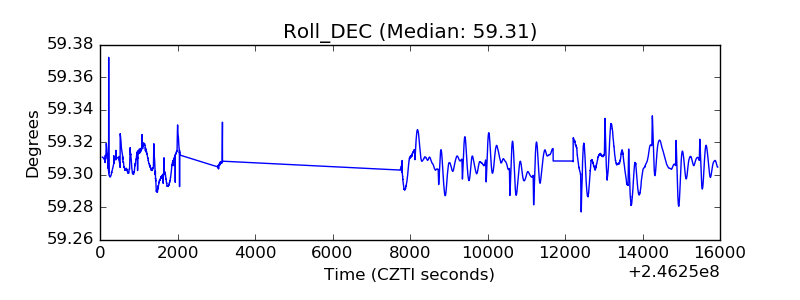 |
| _Roll_RA |  |
| Veto Counter | 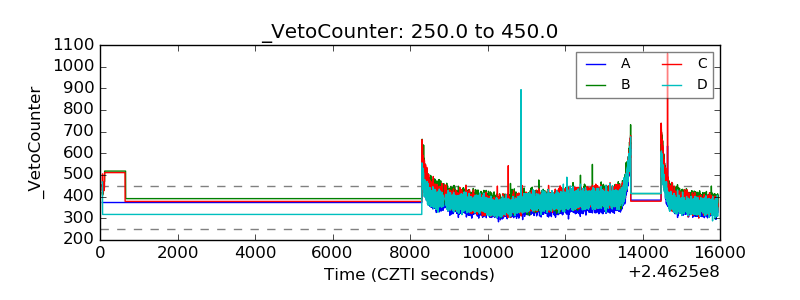 |