| Param | Original file | Final file |
|---|---|---|
| Filename | modeM0/AS1A04_058T02_9000001626_11153cztM0_level2.evt | modeM0/AS1A04_058T02_9000001626_11153cztM0_level2_quad_clean.evt |
| Size (bytes) | 1,185,189,120 | 184,884,480 |
| Size | 1.1 GB | 176.3 MB |
| Events in quadrant A | 11,658,685 | 1,132,538 |
| Events in quadrant B | 8,905,581 | 1,201,511 |
| Events in quadrant C | 5,665,306 | 1,252,958 |
| Events in quadrant D | 8,834,118 | 1,160,913 |
| Mode SS | |||
|---|---|---|---|
| Quadrant | BADHDUFLAG | Total packets | Discarded packets |
| A | 0 | 254 | 6 |
| B | 0 | 254 | 4 |
| C | 0 | 254 | 4 |
| D | 0 | 254 | 4 |
| Mode M9 | |||
|---|---|---|---|
| Quadrant | BADHDUFLAG | Total packets | Discarded packets |
| A | 0 | 14 | 0 |
| B | 0 | 14 | 0 |
| C | 0 | 14 | 0 |
| D | 0 | 14 | 0 |
| Mode M0 | |||
|---|---|---|---|
| Quadrant | BADHDUFLAG | Total packets | Discarded packets |
| A | 0 | 44025 | 739 |
| B | 0 | 35346 | 667 |
| C | 0 | 25983 | 467 |
| D | 0 | 35144 | 465 |
| Quadrant | Total seconds | Saturated seconds | Saturation percentage |
|---|---|---|---|
| A | 12309 | 1713 | 13.916646% |
| B | 12293 | 968 | 7.874400% |
| C | 12311 | 114 | 0.926001% |
| D | 12317 | 637 | 5.171714% |
Noise dominated data is calculated using 1-second bins in cleaned event files. If a bin has >2000 counts, and if more than 50% of those come from <1% of pixels, then it is considered to be noise-dominated and hence unusable.
| Quadrant | # 1 sec bins | Bins with >0 counts | Bins with >2000 counts | High rate bins dominated by noise | Noise dominated (total time) | Noise dominated (detector-on time) | Marked lightcurve |
|---|---|---|---|---|---|---|---|
| A | 13860 | 12369 | 1185 | 1185 | 8.55% | 9.58% | 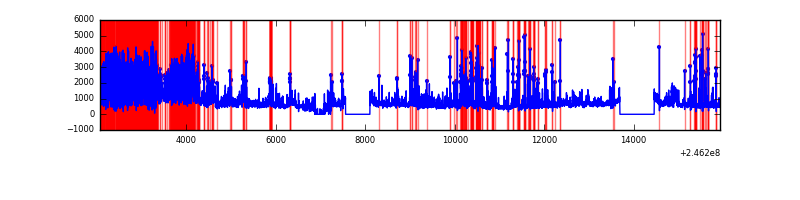 |
| B | 13860 | 12357 | 572 | 572 | 4.13% | 4.63% | 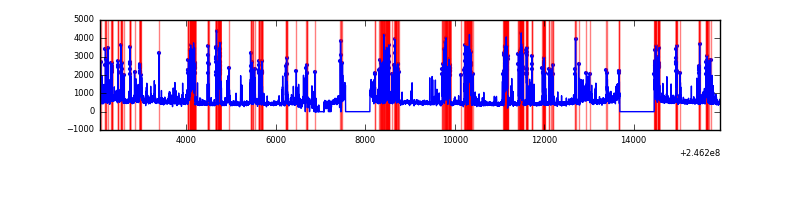 |
| C | 13860 | 12363 | 36 | 36 | 0.26% | 0.29% | 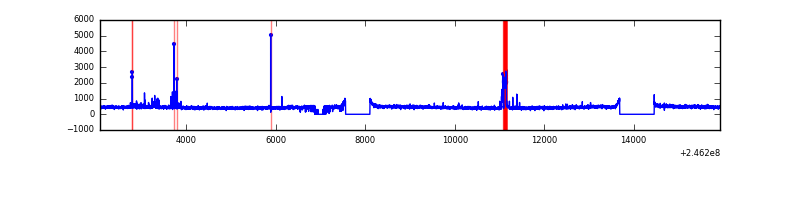 |
| D | 13860 | 12371 | 467 | 467 | 3.37% | 3.77% | 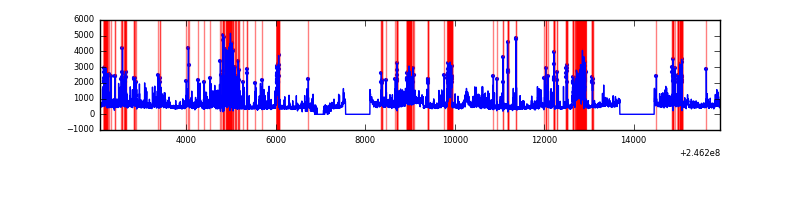 |
Top three noisy pixels from each quadrant. If the there are fewer than three noisy pixels in the level2.evt file, extra rows are filled as -1
| Pixel properties | Quadrant properties | ||||||
|---|---|---|---|---|---|---|---|
| Quadrant | DetID | PixID | Counts | Sigma | Mean | Median | Sigma |
| A | 8 | 5 | 2468290 | 9127.94 | 1333 | 1303 | 270.3 |
| A | 0 | 23 | 1931617 | 7142.23 | 1333 | 1303 | 270.3 |
| A | 8 | 15 | 1259957 | 4657.07 | 1333 | 1303 | 270.3 |
| B | 4 | 239 | 2777440 | 10578.65 | 1385 | 1349 | 262.4 |
| B | 15 | 204 | 297492 | 1128.49 | 1385 | 1349 | 262.4 |
| B | 0 | 219 | 156322 | 590.54 | 1385 | 1349 | 262.4 |
| C | 9 | 204 | 157437 | 485.46 | 1386 | 1393 | 321.4 |
| C | 0 | 207 | 72050 | 219.82 | 1386 | 1393 | 321.4 |
| C | 13 | 61 | 10288 | 27.67 | 1386 | 1393 | 321.4 |
| D | 1 | 52 | 655463 | 2005.21 | 1357 | 1314 | 326.2 |
| D | 2 | 14 | 654134 | 2001.14 | 1357 | 1314 | 326.2 |
| D | 13 | 104 | 446218 | 1363.8 | 1357 | 1314 | 326.2 |
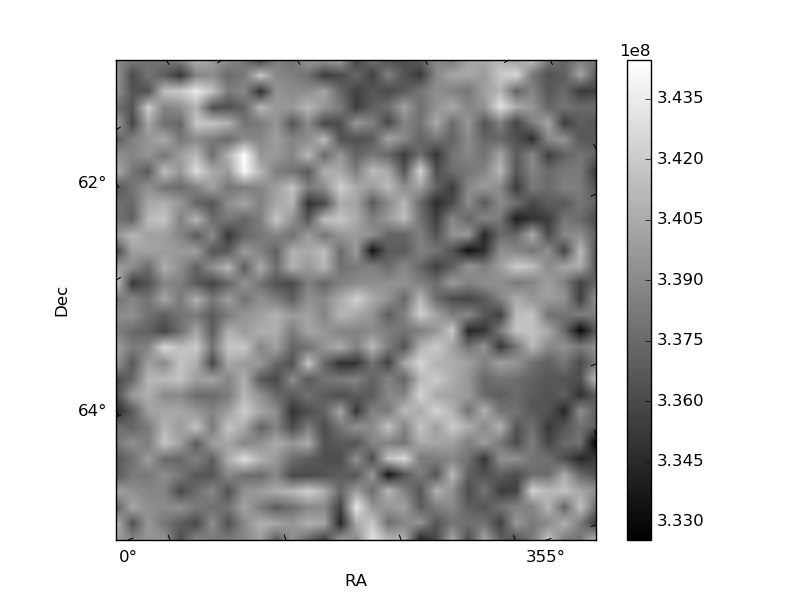
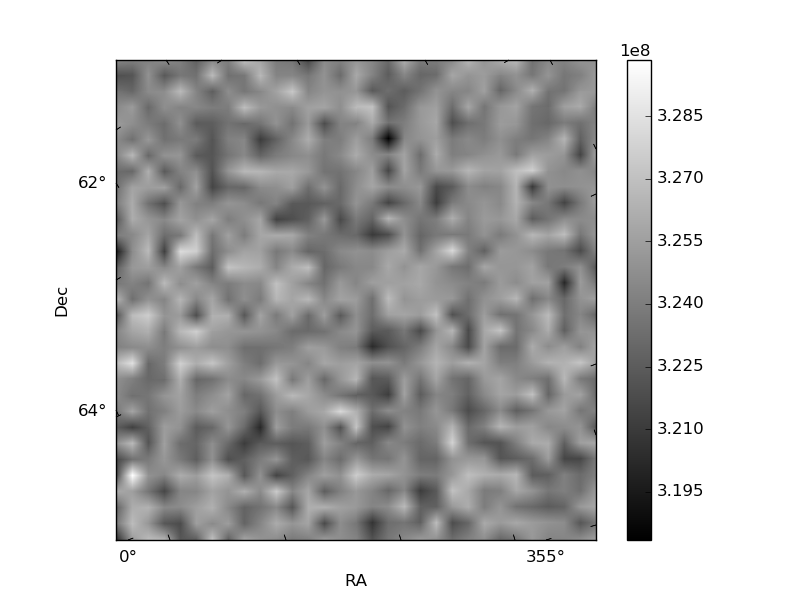
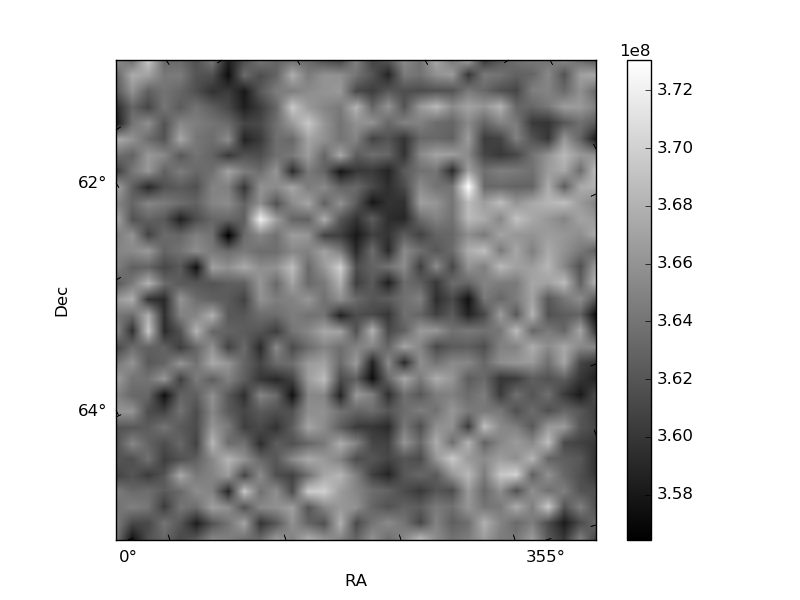
Histogram calculated using DETX and DETY for each event in the final _common_clean file
| Quadrant A | 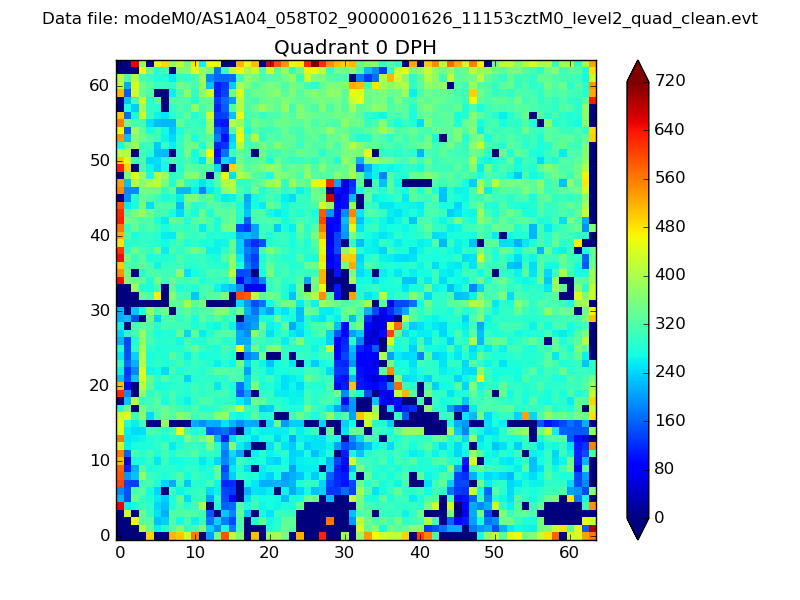 |
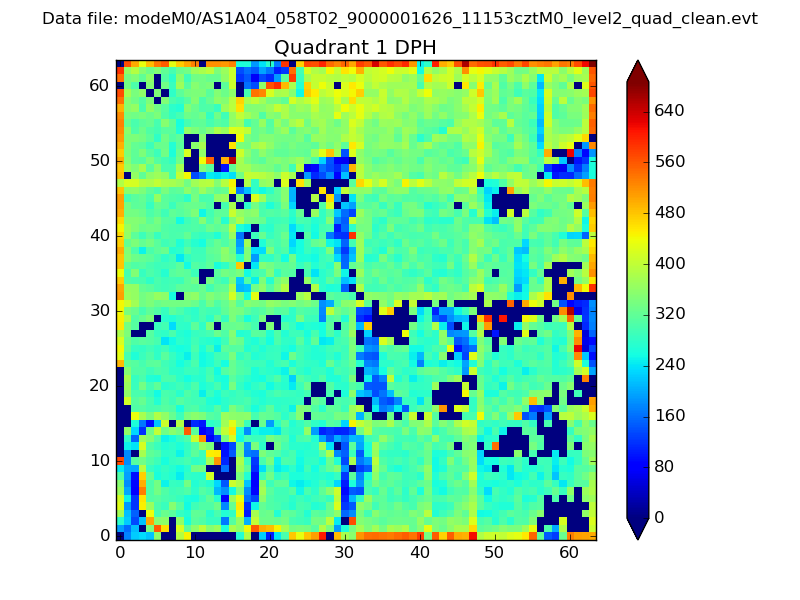 |
Quadrant B |
|---|---|---|---|
| Quadrant D | 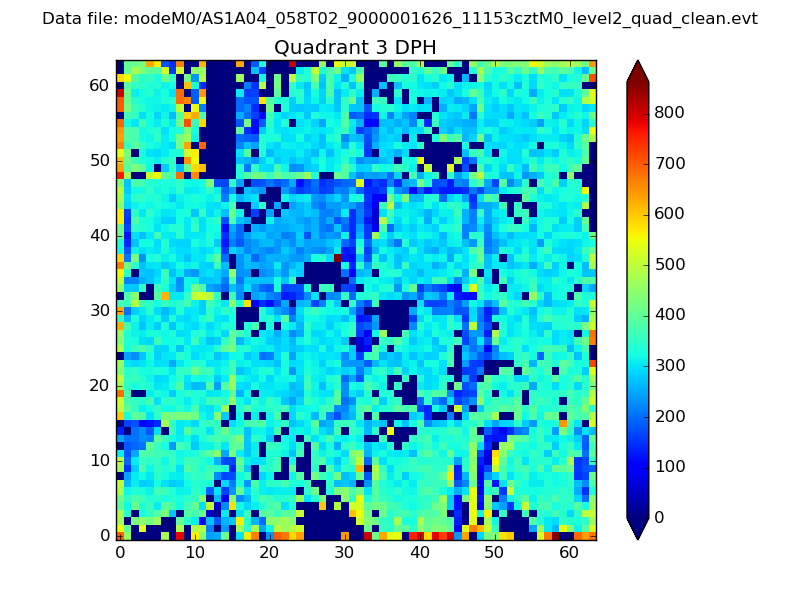 |
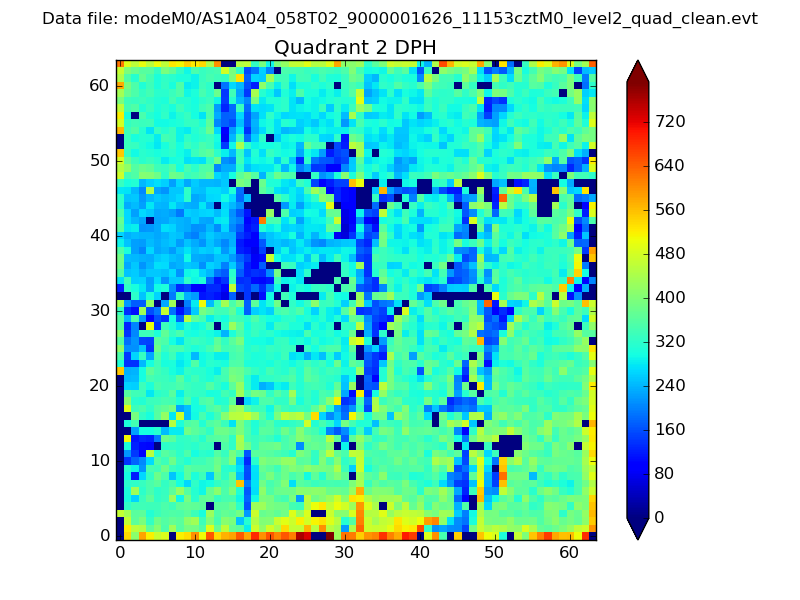 |
Quadrant C |
| Plot type | Count rate plots | Images |
|---|---|---|
| Comparison with Poisson distribution Blue bars denote a histogram of data divided into 1 sec bins. Red curve is a Poisson curve with rate = median count rate of data. |
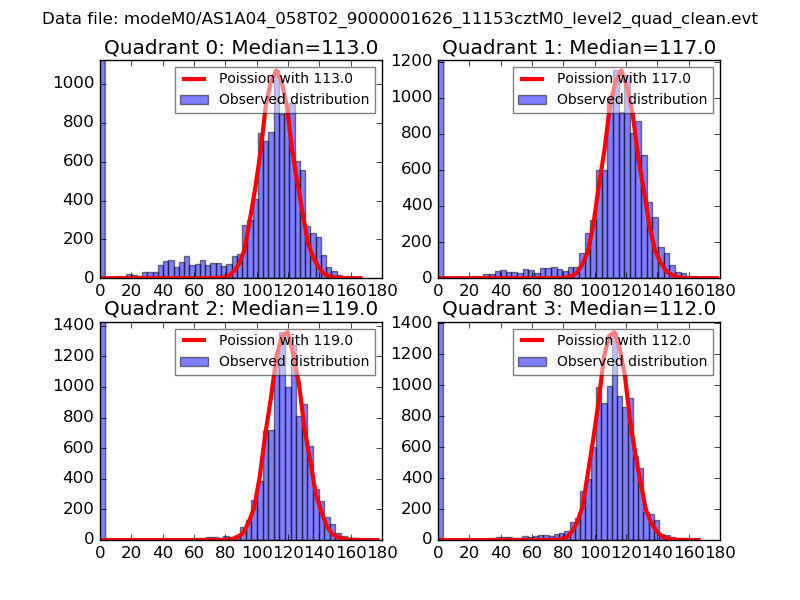 |
 |
| Quadrant-wise count rates Data is divided into 100 sec bins |
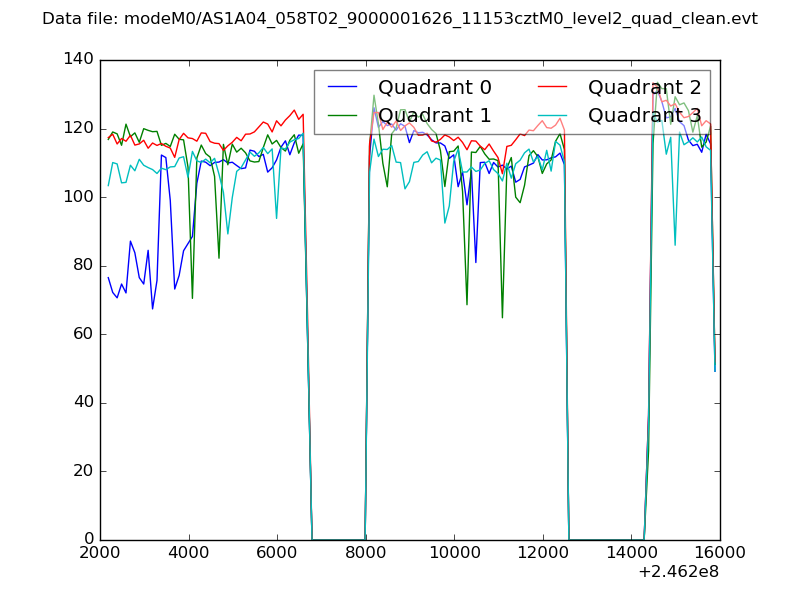 |
|
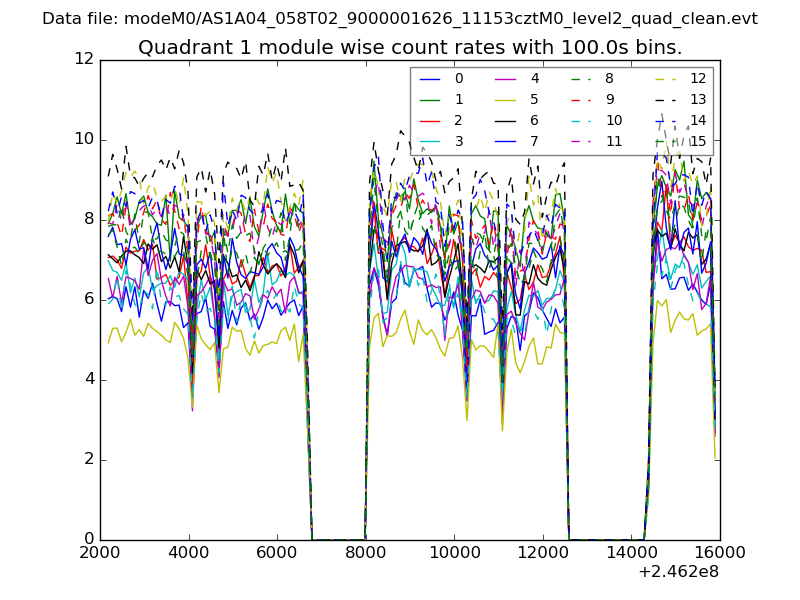
| Module-wise count rates for Quadrant A Data is divided into 100 sec bins |
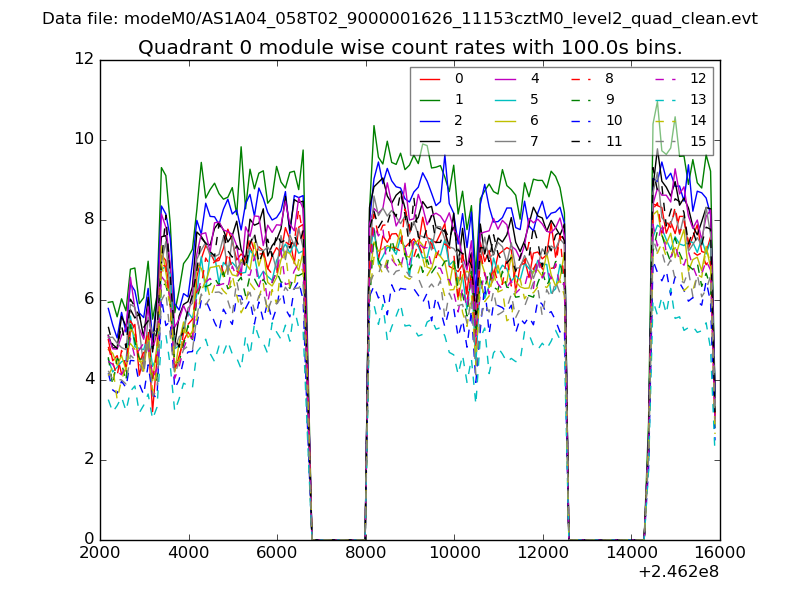 |
 |
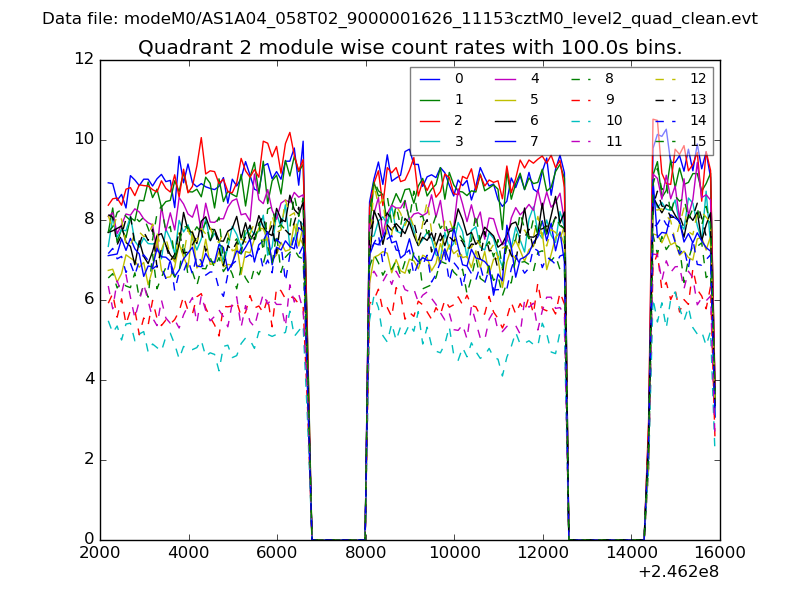
| Module-wise count rates for Quadrant B Data is divided into 100 sec bins |
 |
 |
| Module-wise count rates for Quadrant C Data is divided into 100 sec bins |
 |
 |
| Module-wise count rates for Quadrant D Data is divided into 100 sec bins |
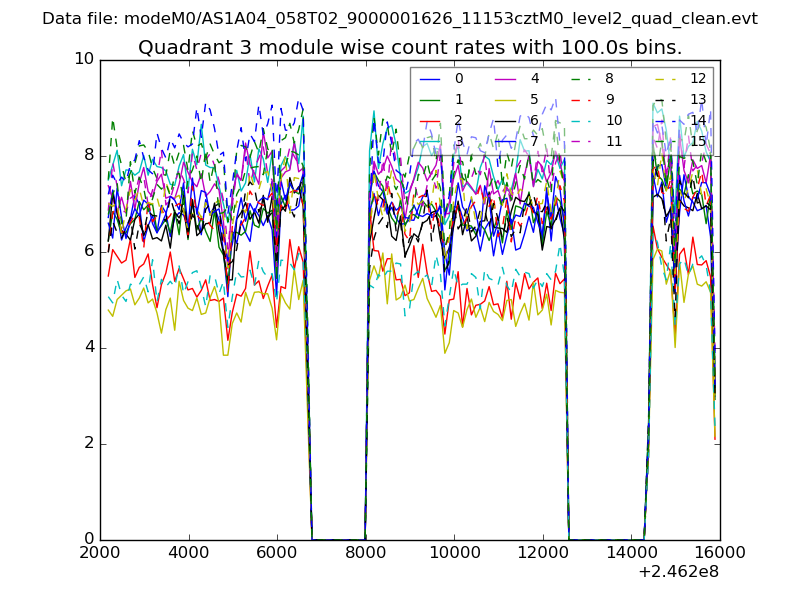 |
 |
| Parameter | Plot |
|---|---|
| CZT HV Monitor | 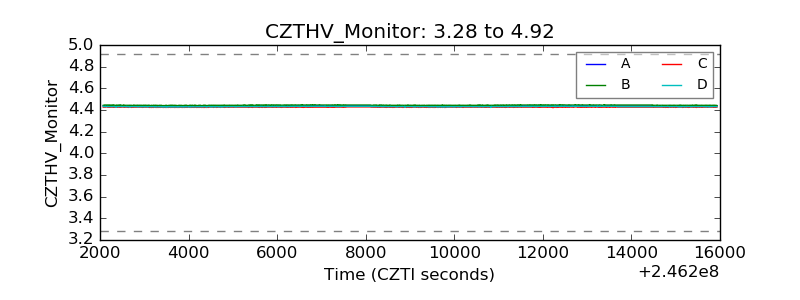 |
| D_VDD | 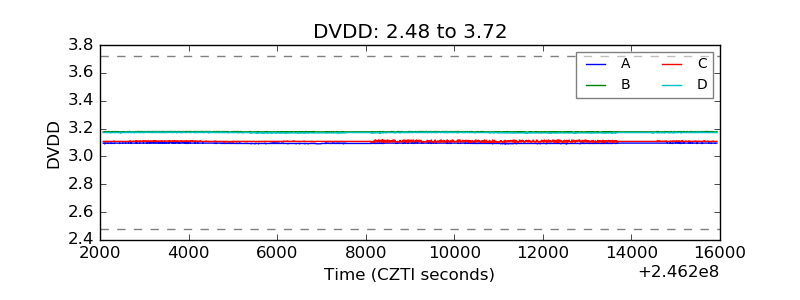 |
| Temperature 1 | 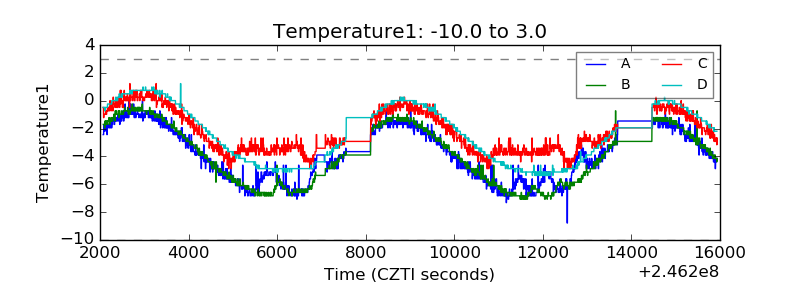 |
| Veto HV Monitor | 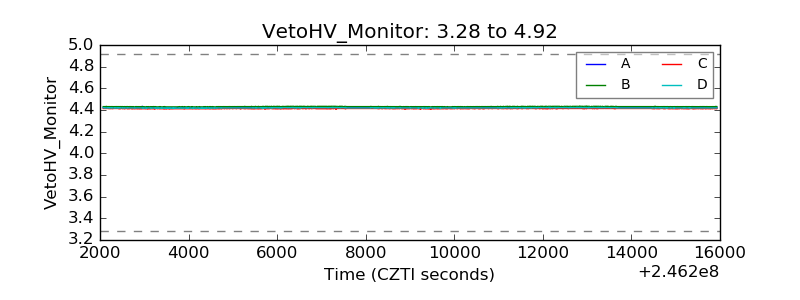 |
| Veto LLD | 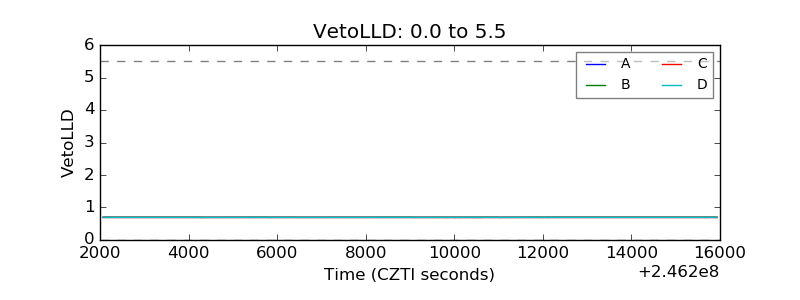 |
| Alpha Counter | 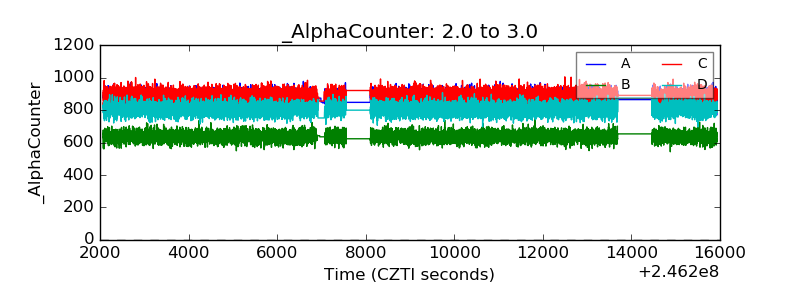 |
| _CPM_Rate | 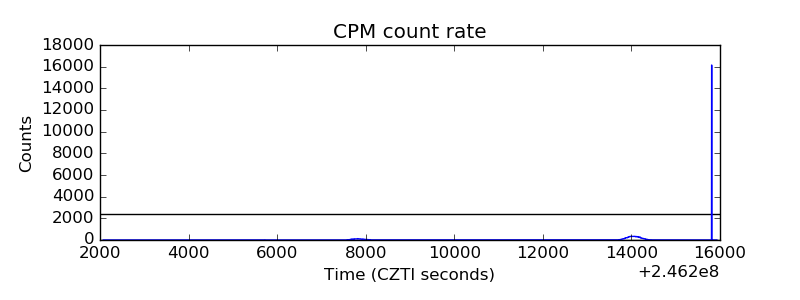 |
| CZT Counter | 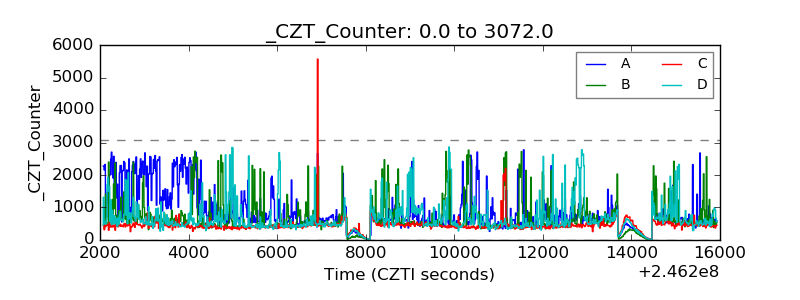 |
| +2.5 Volts monitor |  |
| +5 Volts monitor |  |
| _ROLL_ROT | 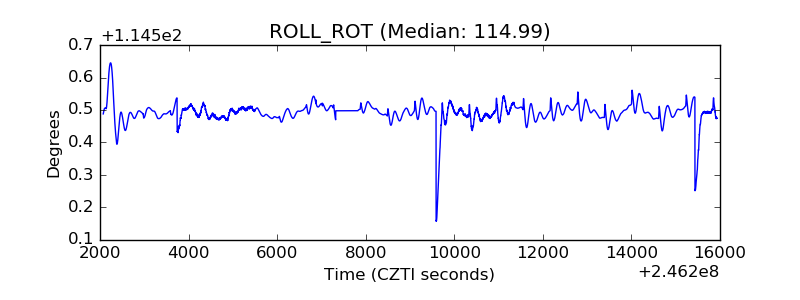 |
| _Roll_DEC | 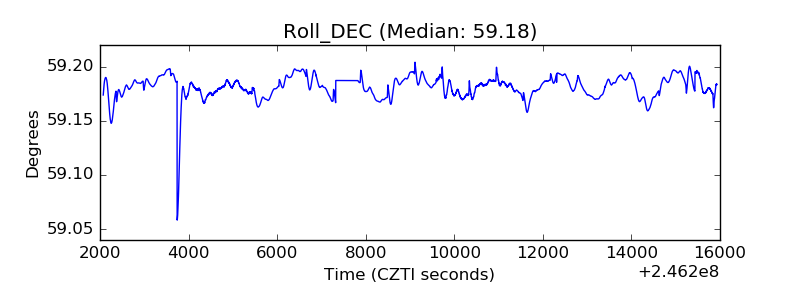 |
| _Roll_RA |  |
| Veto Counter | 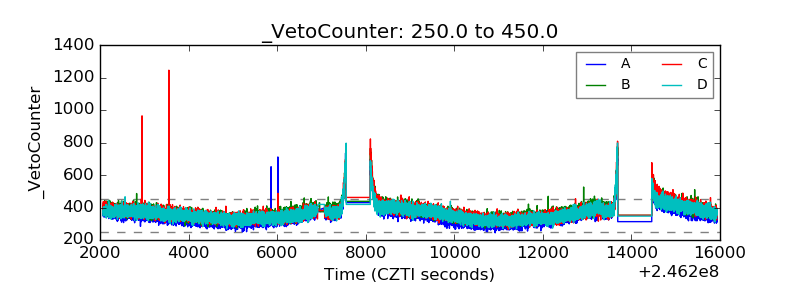 |