| Param | Original file | Final file |
|---|---|---|
| Filename | modeM0/AS1A04_058T02_9000001626_11156cztM0_level2.evt | modeM0/AS1A04_058T02_9000001626_11156cztM0_level2_quad_clean.evt |
| Size (bytes) | 37,912,320 | 9,250,560 |
| Size | 36.2 MB | 8.8 MB |
| Events in quadrant A | 288,820 | 55,870 |
| Events in quadrant B | 259,627 | 60,345 |
| Events in quadrant C | 249,533 | 67,845 |
| Events in quadrant D | 315,094 | 55,021 |
| Mode SS | |||
|---|---|---|---|
| Quadrant | BADHDUFLAG | Total packets | Discarded packets |
| A | 0 | 22 | 10 |
| B | 0 | 22 | 14 |
| C | 0 | 22 | 12 |
| D | 0 | 22 | 12 |
| Mode M9 | |||
|---|---|---|---|
| Quadrant | BADHDUFLAG | Total packets | Discarded packets |
| A | 0 | 5 | 1 |
| B | 0 | 5 | 1 |
| C | 0 | 5 | 1 |
| D | 0 | 6 | 0 |
| Mode M0 | |||
|---|---|---|---|
| Quadrant | BADHDUFLAG | Total packets | Discarded packets |
| A | 0 | 3372 | 2236 |
| B | 0 | 2817 | 1772 |
| C | 0 | 2322 | 1295 |
| D | 0 | 3150 | 1919 |
| Quadrant | Total seconds | Saturated seconds | Saturation percentage |
|---|---|---|---|
| A | 445 | 15 | 3.370787% |
| B | 460 | 6 | 1.304348% |
| C | 504 | 0 | 0.000000% |
| D | 442 | 3 | 0.678733% |
Noise dominated data is calculated using 1-second bins in cleaned event files. If a bin has >2000 counts, and if more than 50% of those come from <1% of pixels, then it is considered to be noise-dominated and hence unusable.
| Quadrant | # 1 sec bins | Bins with >0 counts | Bins with >2000 counts | High rate bins dominated by noise | Noise dominated (total time) | Noise dominated (detector-on time) | Marked lightcurve |
|---|---|---|---|---|---|---|---|
| A | 1121 | 551 | 6 | 6 | 0.54% | 1.09% | 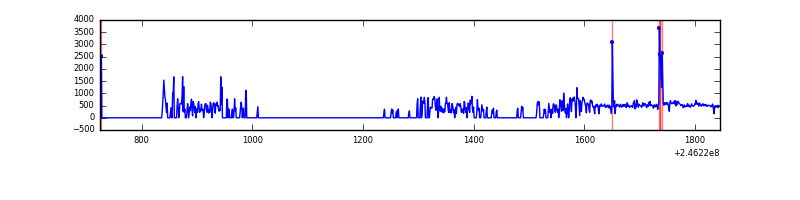 |
| B | 1121 | 570 | 1 | 1 | 0.09% | 0.18% |  |
| C | 1120 | 629 | 0 | 0 | 0.00% | 0.00% | 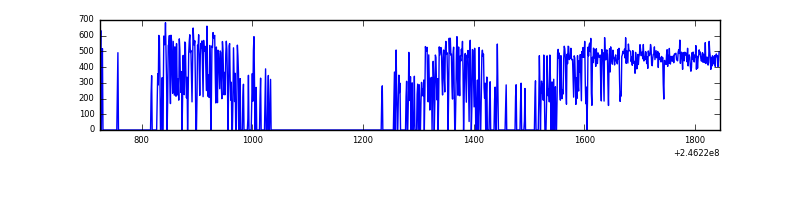 |
| D | 1121 | 545 | 1 | 1 | 0.09% | 0.18% | 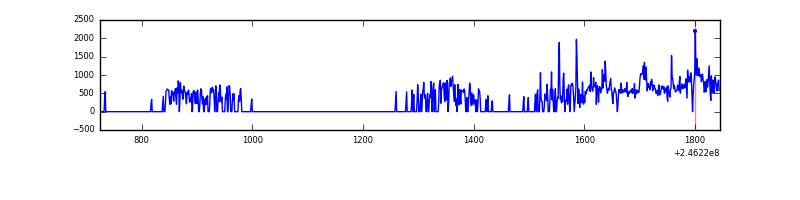 |
Top three noisy pixels from each quadrant. If the there are fewer than three noisy pixels in the level2.evt file, extra rows are filled as -1
| Pixel properties | Quadrant properties | ||||||
|---|---|---|---|---|---|---|---|
| Quadrant | DetID | PixID | Counts | Sigma | Mean | Median | Sigma |
| A | 8 | 5 | 50741 | 3796.06 | 54 | 53 | 13.4 |
| A | 8 | 15 | 22757 | 1700.32 | 54 | 53 | 13.4 |
| A | 0 | 23 | 2899 | 213.14 | 54 | 53 | 13.4 |
| B | 15 | 204 | 14601 | 1087.14 | 57 | 55 | 13.4 |
| B | 4 | 239 | 12439 | 925.56 | 57 | 55 | 13.4 |
| B | 0 | 219 | 2821 | 206.73 | 57 | 55 | 13.4 |
| C | 13 | 61 | 534 | 28.27 | 63 | 63 | 16.7 |
| C | 8 | 222 | 337 | 16.45 | 63 | 63 | 16.7 |
| C | 9 | 204 | 205 | 8.52 | 63 | 63 | 16.7 |
| D | 10 | 157 | 34145 | 2210.95 | 54 | 52 | 15.4 |
| D | 5 | 222 | 28739 | 1860.37 | 54 | 52 | 15.4 |
| D | 8 | 195 | 16000 | 1034.24 | 54 | 52 | 15.4 |
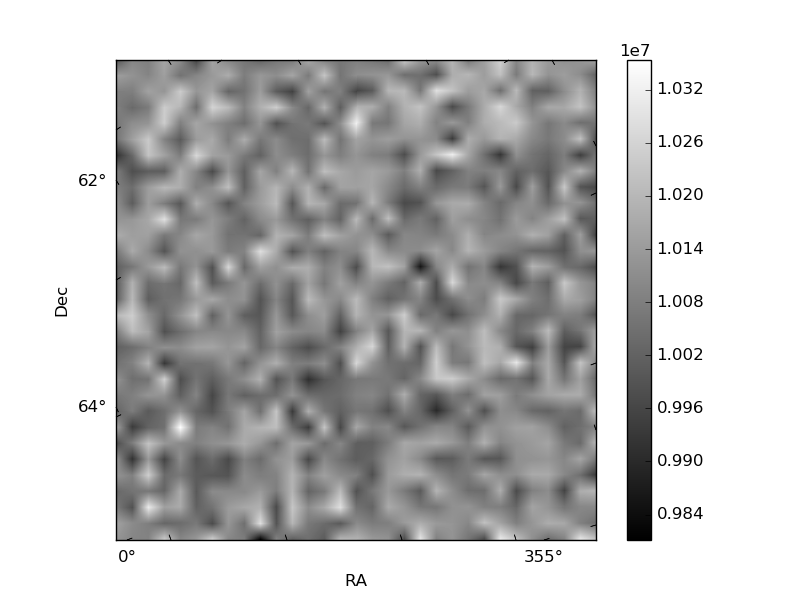
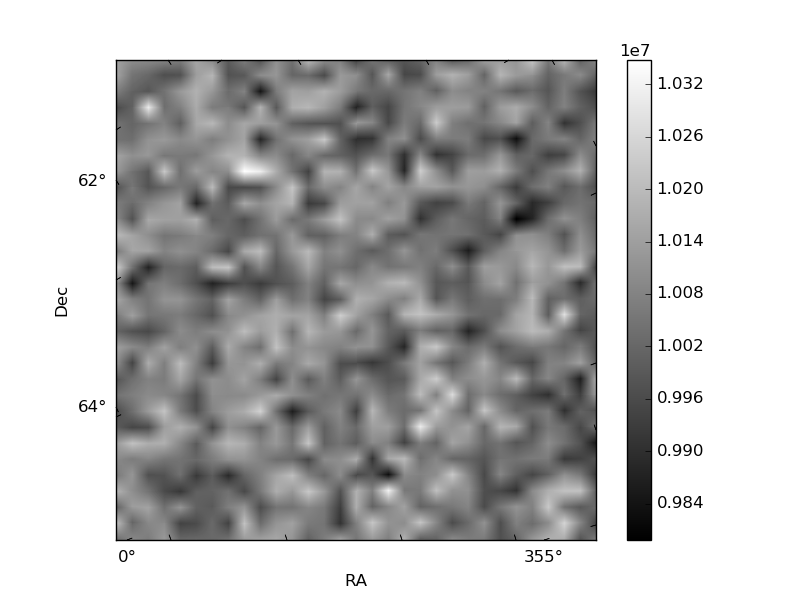
Histogram calculated using DETX and DETY for each event in the final _common_clean file
| Quadrant A |  |
 |
Quadrant B |
|---|---|---|---|
| Quadrant D |  |
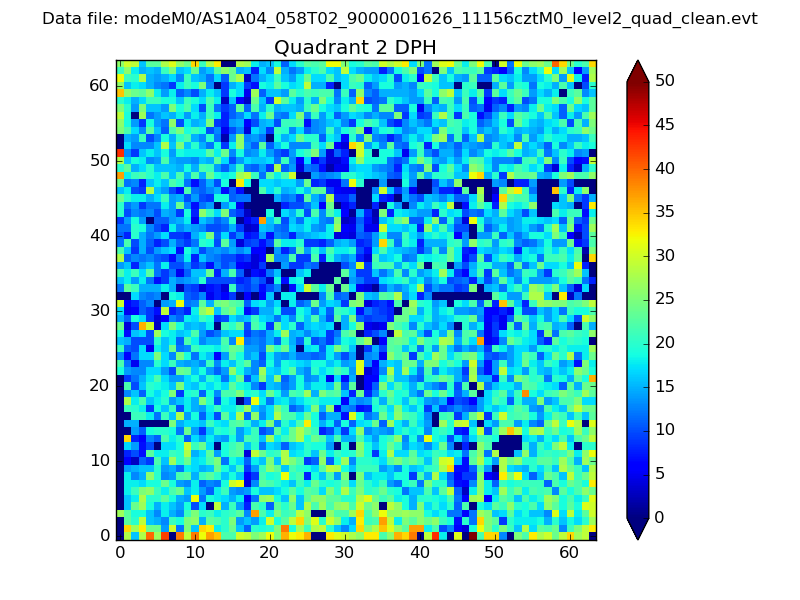 |
Quadrant C |
| Plot type | Count rate plots | Images |
|---|---|---|
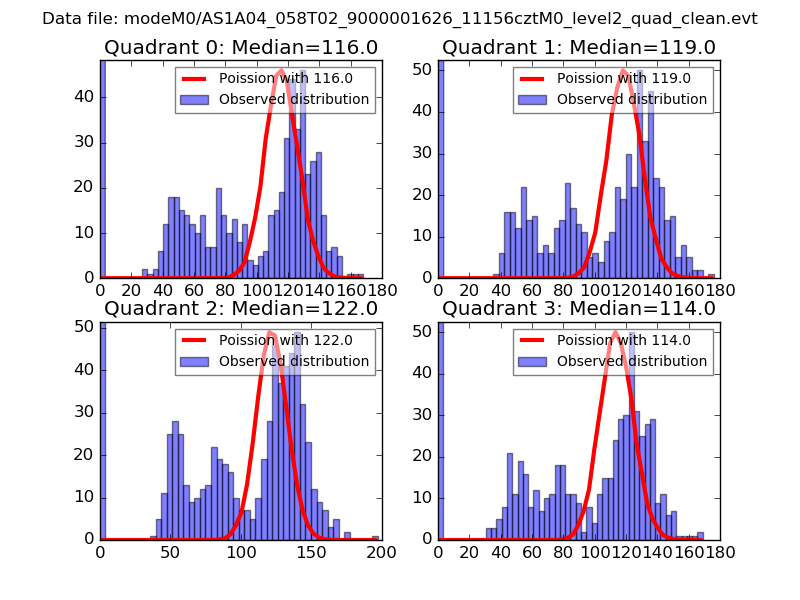
| Comparison with Poisson distribution Blue bars denote a histogram of data divided into 1 sec bins. Red curve is a Poisson curve with rate = median count rate of data. |
 |
 |
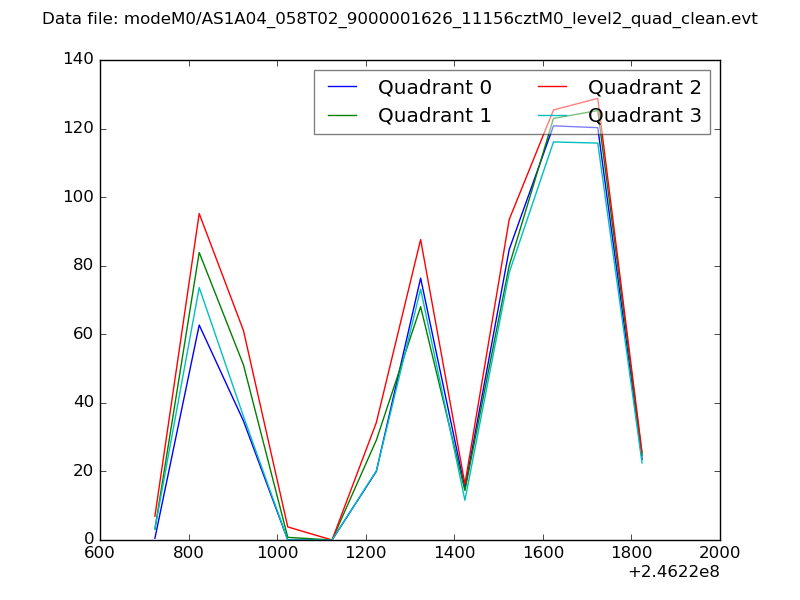
| Quadrant-wise count rates Data is divided into 100 sec bins |
 |
|
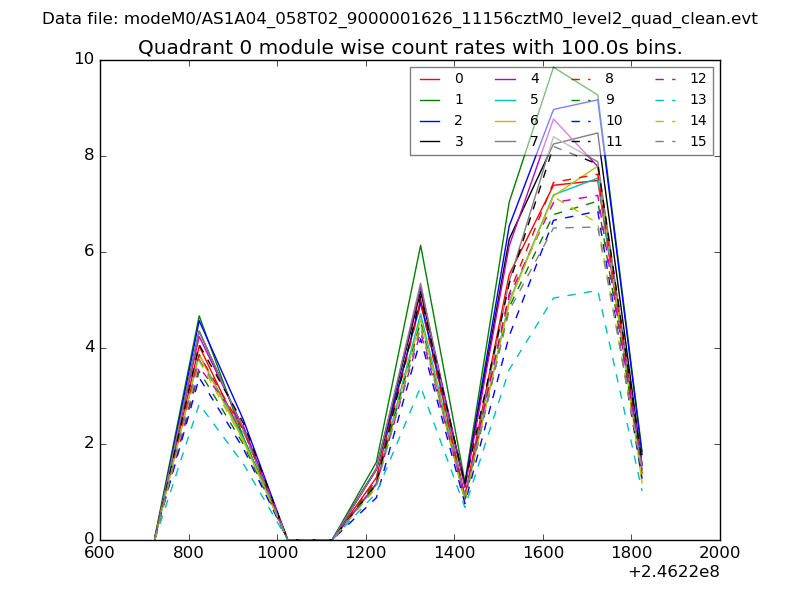
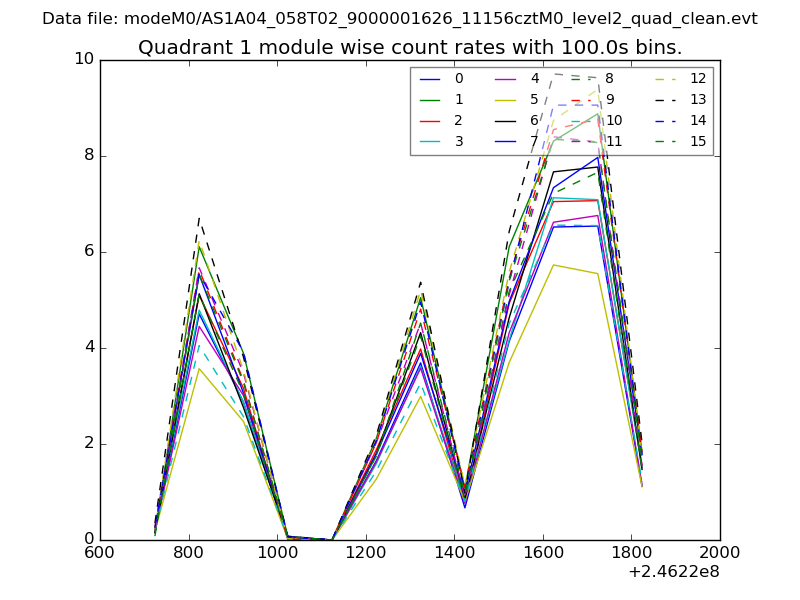
| Module-wise count rates for Quadrant A Data is divided into 100 sec bins |
 |
 |
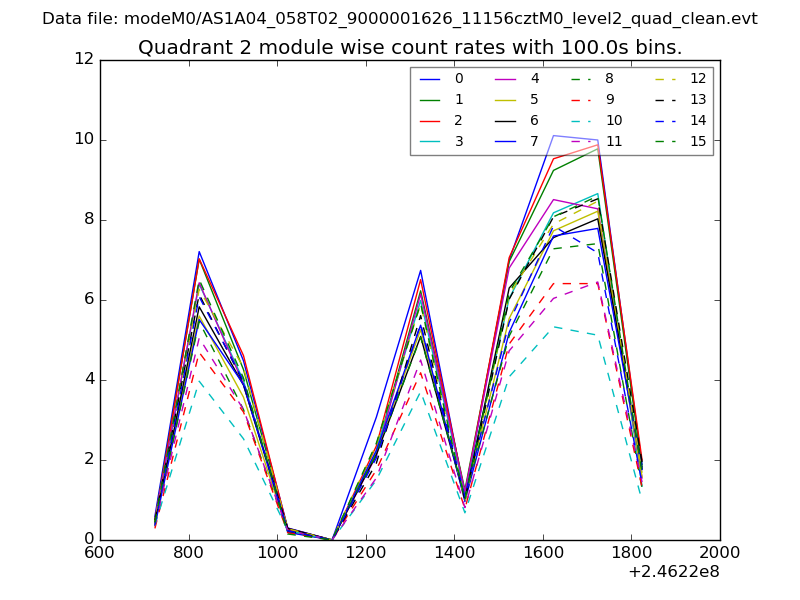
| Module-wise count rates for Quadrant B Data is divided into 100 sec bins |
 |
 |
| Module-wise count rates for Quadrant C Data is divided into 100 sec bins |
 |
 |
| Module-wise count rates for Quadrant D Data is divided into 100 sec bins |
 |
 |
| Parameter | Plot |
|---|---|
| CZT HV Monitor | 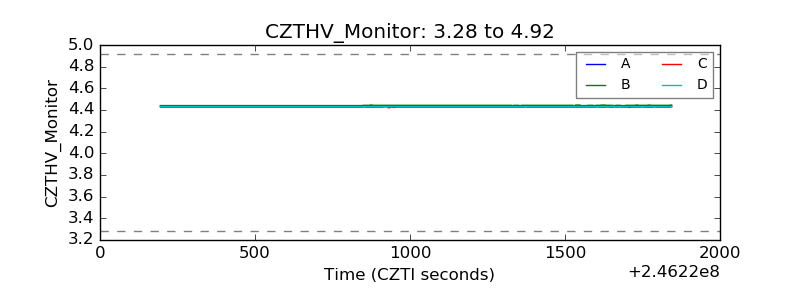 |
| D_VDD | 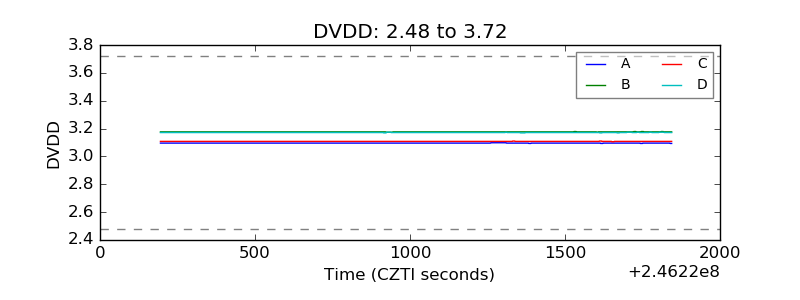 |
| Temperature 1 | 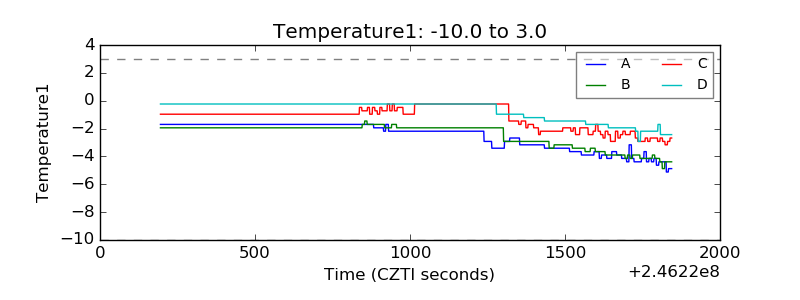 |
| Veto HV Monitor | 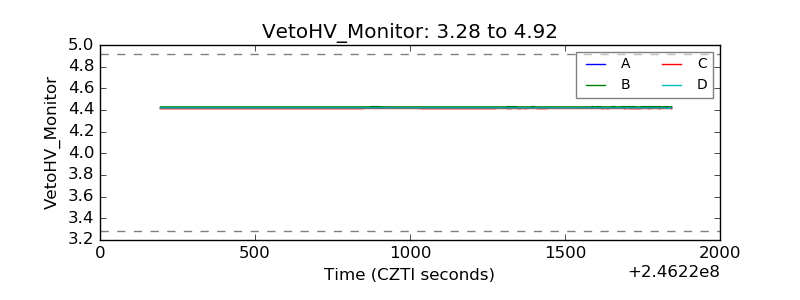 |
| Veto LLD | 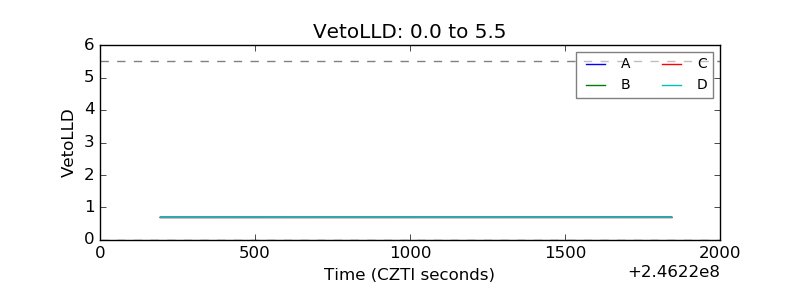 |
| Alpha Counter | 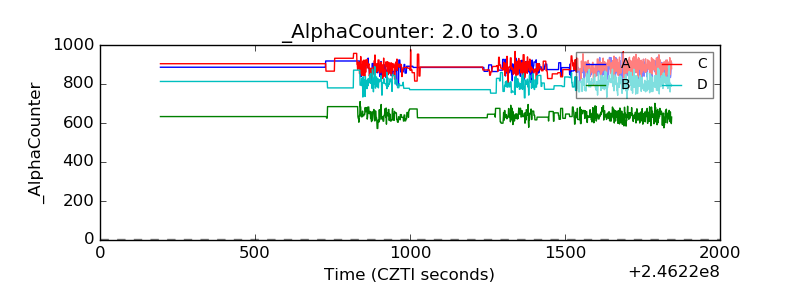 |
| _CPM_Rate | 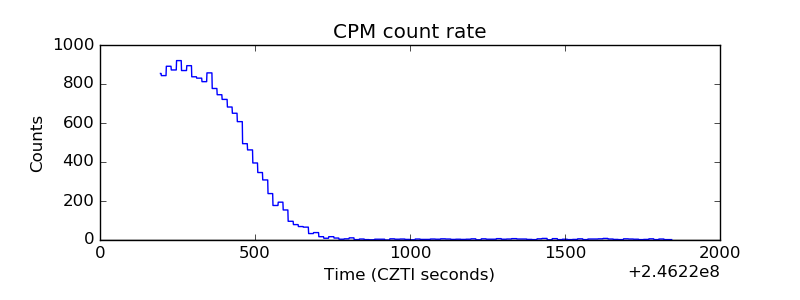 |
| CZT Counter | 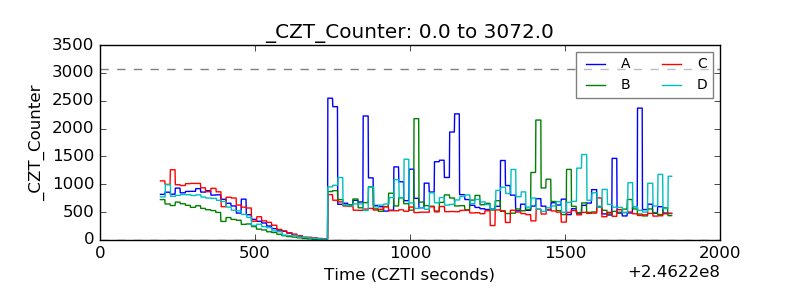 |
| +2.5 Volts monitor |  |
| +5 Volts monitor |  |
| _ROLL_ROT | 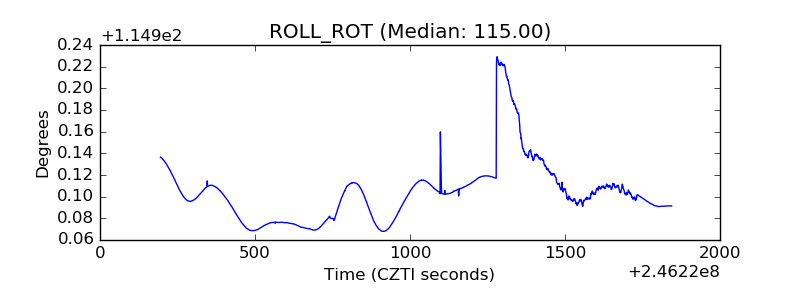 |
| _Roll_DEC | 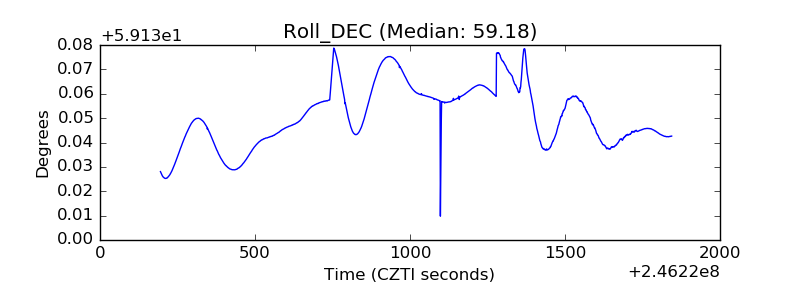 |
| _Roll_RA | 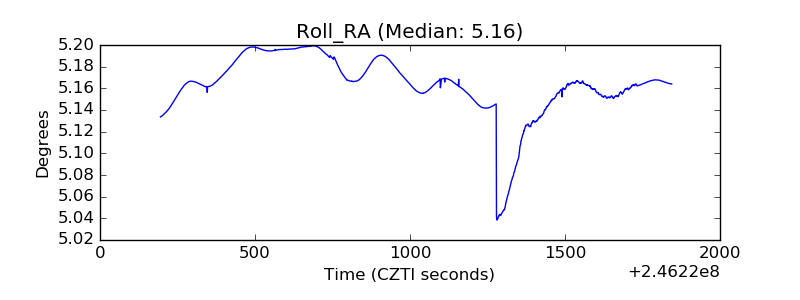 |
| Veto Counter | 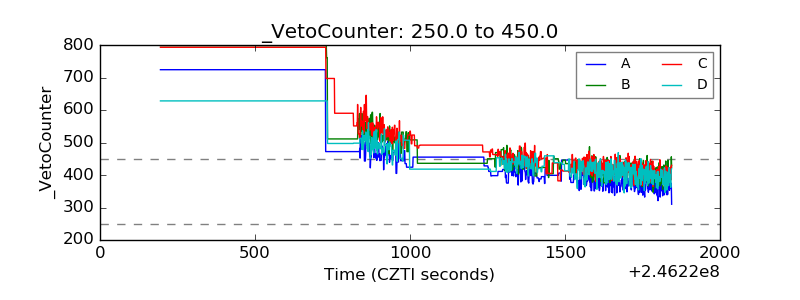 |