| Param | Original file | Final file |
|---|---|---|
| Filename | modeM0/AS1A04_058T02_9000001626_11162cztM0_level2.evt | modeM0/AS1A04_058T02_9000001626_11162cztM0_level2_quad_clean.evt |
| Size (bytes) | 412,767,360 | 74,943,360 |
| Size | 393.6 MB | 71.5 MB |
| Events in quadrant A | 3,245,650 | 468,650 |
| Events in quadrant B | 3,585,198 | 470,005 |
| Events in quadrant C | 2,345,922 | 492,386 |
| Events in quadrant D | 2,958,124 | 461,883 |
| Mode SS | |||
|---|---|---|---|
| Quadrant | BADHDUFLAG | Total packets | Discarded packets |
| A | 0 | 121 | 11 |
| B | 0 | 120 | 10 |
| C | 0 | 122 | 12 |
| D | 0 | 118 | 8 |
| Mode M9 | |||
|---|---|---|---|
| Quadrant | BADHDUFLAG | Total packets | Discarded packets |
| A | 0 | 12 | 4 |
| B | 0 | 15 | 7 |
| C | 0 | 14 | 7 |
| D | 0 | 16 | 8 |
| Mode M0 | |||
|---|---|---|---|
| Quadrant | BADHDUFLAG | Total packets | Discarded packets |
| A | 0 | 14748 | 1400 |
| B | 0 | 15405 | 1092 |
| C | 0 | 11835 | 930 |
| D | 0 | 13881 | 1187 |
| Quadrant | Total seconds | Saturated seconds | Saturation percentage |
|---|---|---|---|
| A | 5375 | 133 | 2.474419% |
| B | 5373 | 344 | 6.402382% |
| C | 5374 | 41 | 0.762933% |
| D | 5375 | 119 | 2.213953% |
Noise dominated data is calculated using 1-second bins in cleaned event files. If a bin has >2000 counts, and if more than 50% of those come from <1% of pixels, then it is considered to be noise-dominated and hence unusable.
| Quadrant | # 1 sec bins | Bins with >0 counts | Bins with >2000 counts | High rate bins dominated by noise | Noise dominated (total time) | Noise dominated (detector-on time) | Marked lightcurve |
|---|---|---|---|---|---|---|---|
| A | 5375 | 5375 | 43 | 43 | 0.80% | 0.80% | 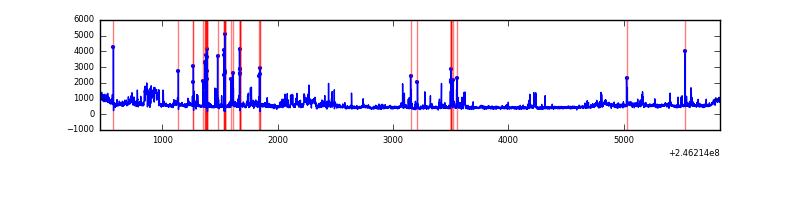 |
| B | 5375 | 5375 | 174 | 174 | 3.24% | 3.24% | 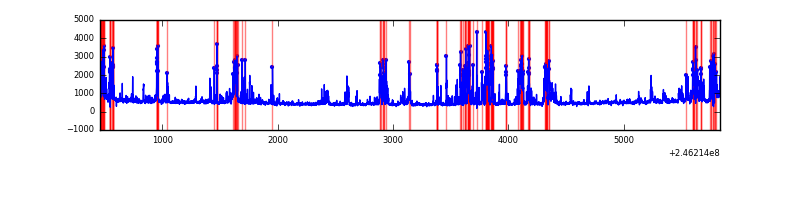 |
| C | 5375 | 5375 | 0 | 0 | 0.00% | 0.00% | 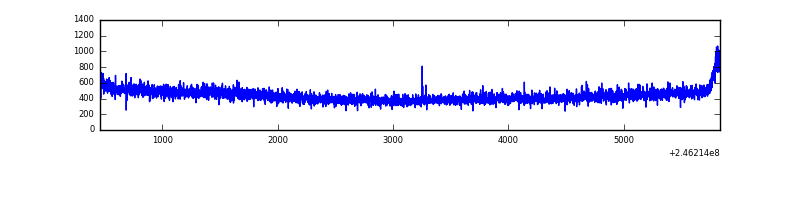 |
| D | 5375 | 5375 | 49 | 49 | 0.91% | 0.91% | 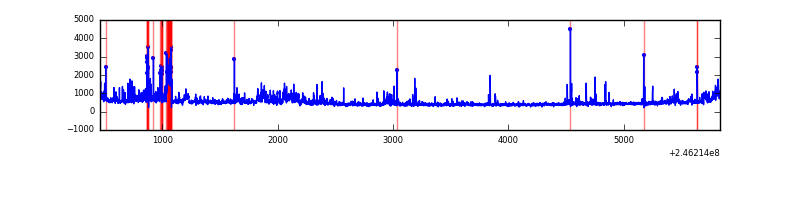 |
Top three noisy pixels from each quadrant. If the there are fewer than three noisy pixels in the level2.evt file, extra rows are filled as -1
| Pixel properties | Quadrant properties | ||||||
|---|---|---|---|---|---|---|---|
| Quadrant | DetID | PixID | Counts | Sigma | Mean | Median | Sigma |
| A | 8 | 15 | 418389 | 3341.88 | 604 | 588 | 125.0 |
| A | 8 | 5 | 417598 | 3335.55 | 604 | 588 | 125.0 |
| A | 14 | 238 | 43991 | 347.17 | 604 | 588 | 125.0 |
| B | 4 | 239 | 968390 | 8320.29 | 600 | 584 | 116.3 |
| B | 15 | 204 | 120414 | 1030.19 | 600 | 584 | 116.3 |
| B | 10 | 16 | 63271 | 538.92 | 600 | 584 | 116.3 |
| C | 13 | 61 | 4407 | 27.17 | 599 | 603 | 140.0 |
| C | 14 | 67 | 4032 | 24.49 | 599 | 603 | 140.0 |
| C | 9 | 204 | 3629 | 21.62 | 599 | 603 | 140.0 |
| D | 13 | 104 | 159359 | 1120.28 | 588 | 571 | 141.7 |
| D | 1 | 52 | 125004 | 877.9 | 588 | 571 | 141.7 |
| D | 10 | 157 | 98932 | 693.95 | 588 | 571 | 141.7 |
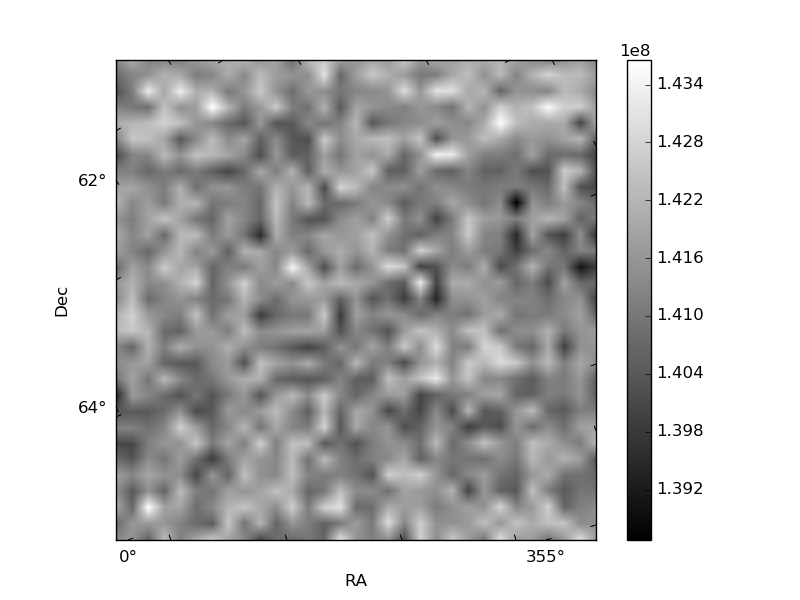
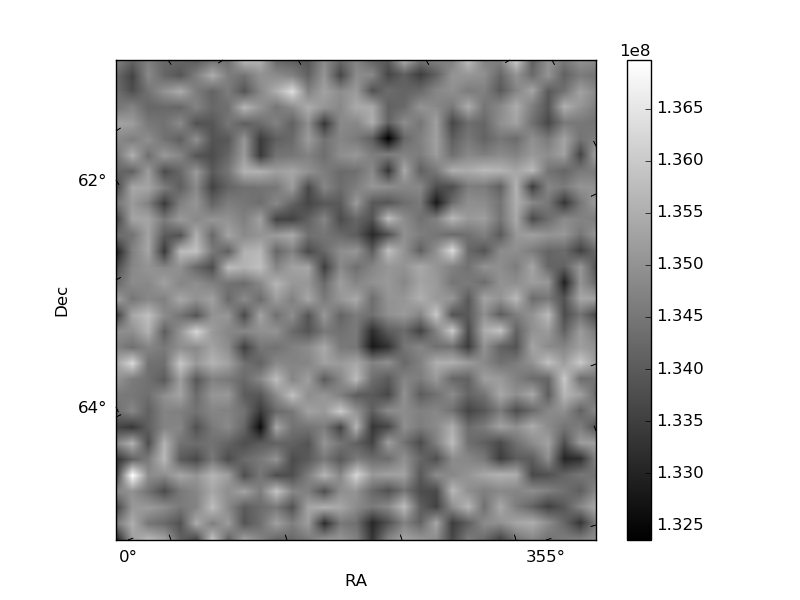
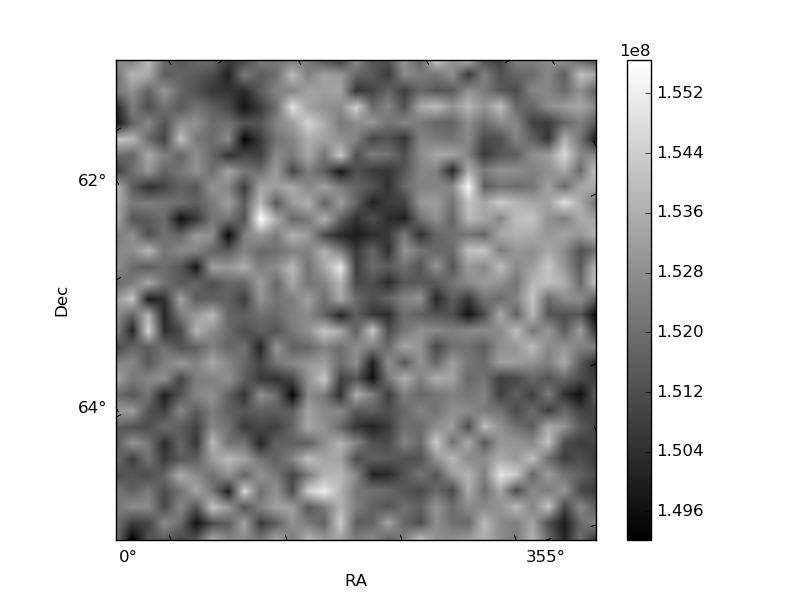
Histogram calculated using DETX and DETY for each event in the final _common_clean file
| Quadrant A |  |
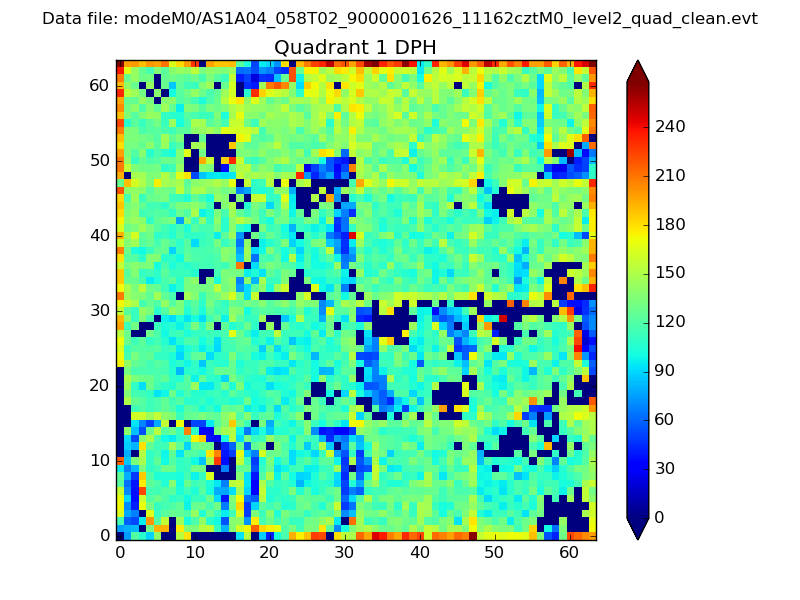 |
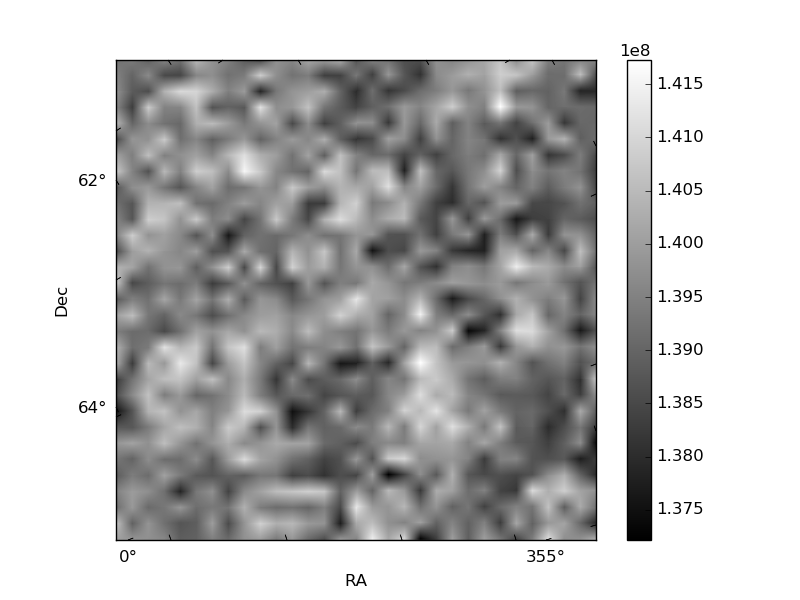
Quadrant B |
|---|---|---|---|
| Quadrant D |  |
 |
Quadrant C |
| Plot type | Count rate plots | Images |
|---|---|---|
| Comparison with Poisson distribution Blue bars denote a histogram of data divided into 1 sec bins. Red curve is a Poisson curve with rate = median count rate of data. |
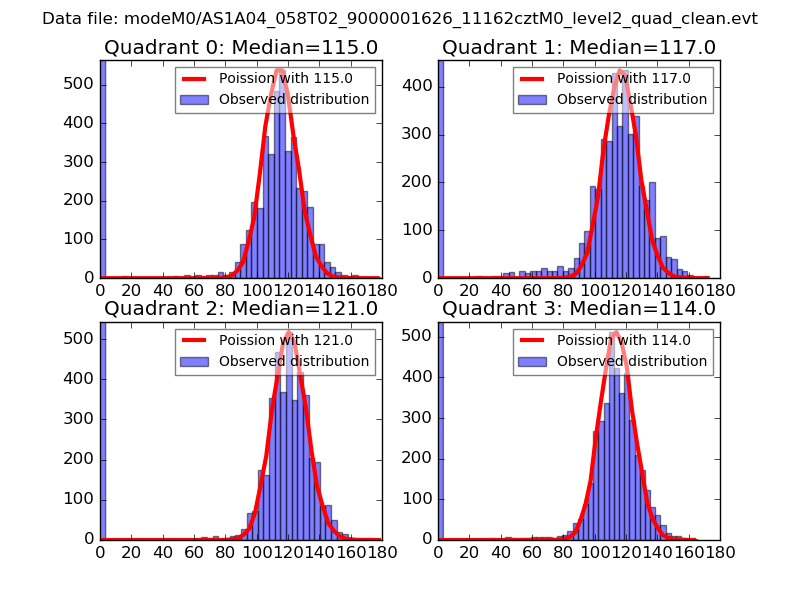 |
 |
| Quadrant-wise count rates Data is divided into 100 sec bins |
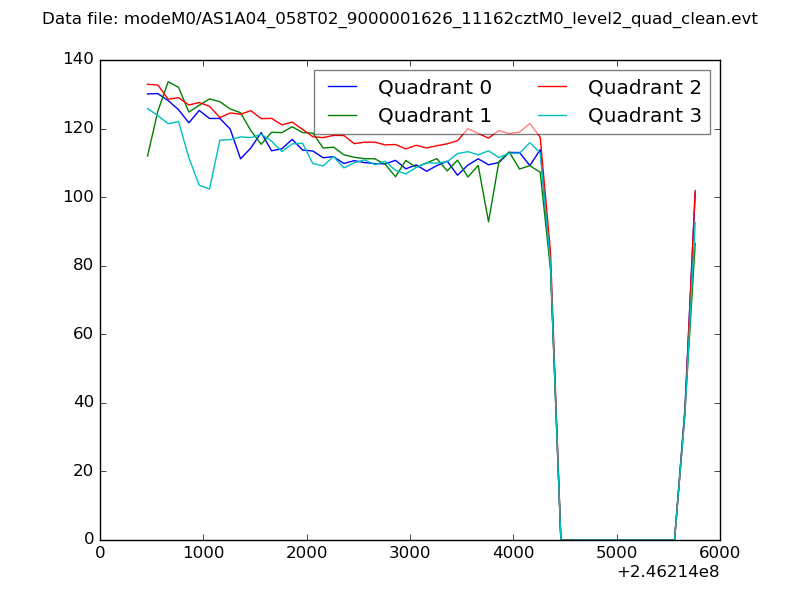 |
|
| Module-wise count rates for Quadrant A Data is divided into 100 sec bins |
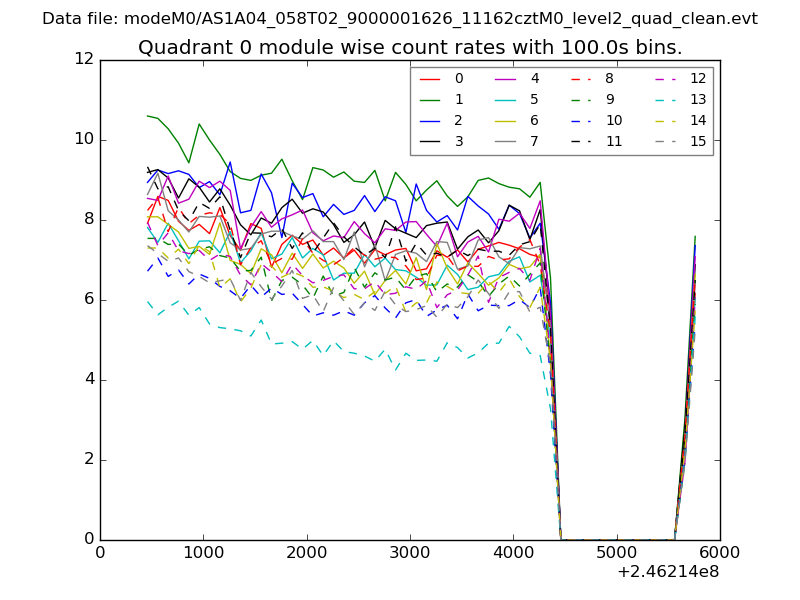 |
 |
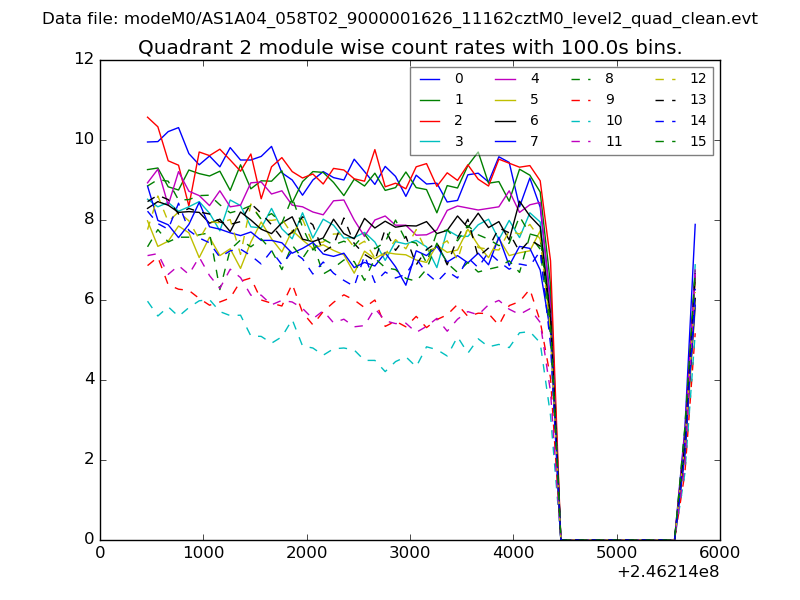
| Module-wise count rates for Quadrant B Data is divided into 100 sec bins |
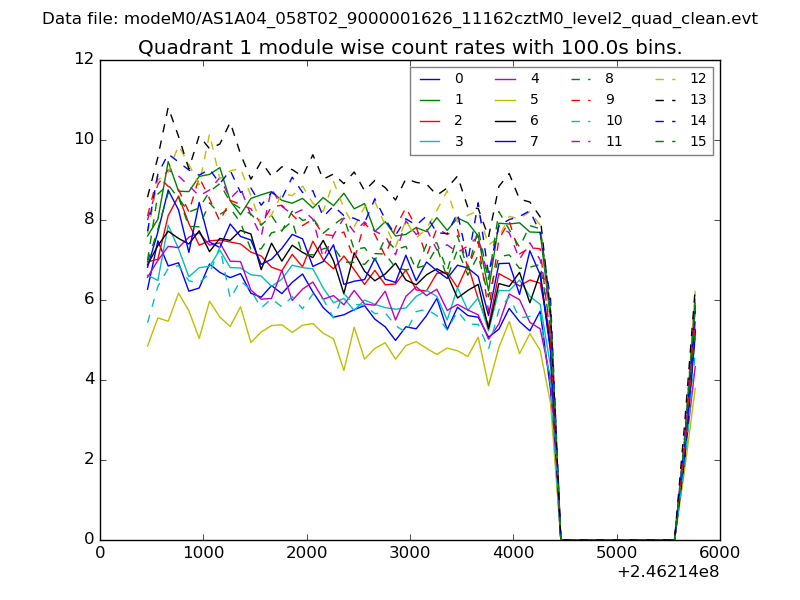 |
 |
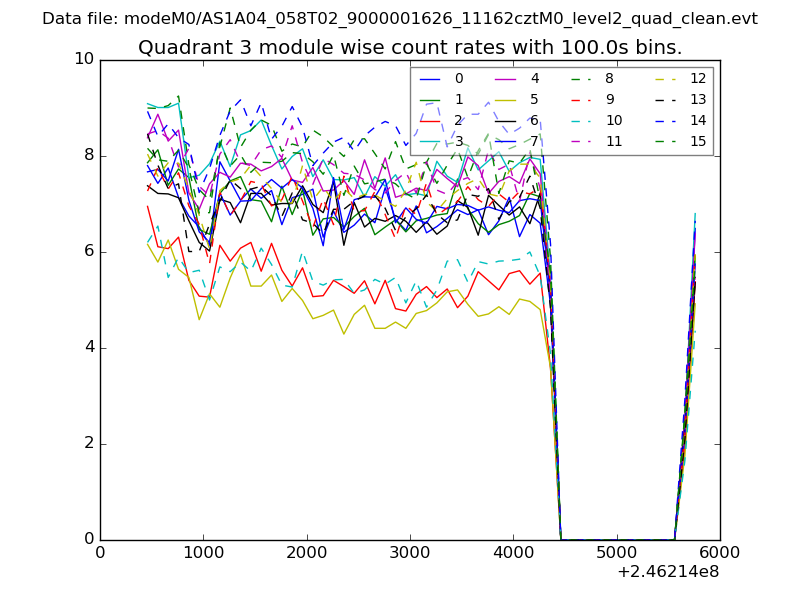
| Module-wise count rates for Quadrant C Data is divided into 100 sec bins |
 |
 |
| Module-wise count rates for Quadrant D Data is divided into 100 sec bins |
 |
 |
| Parameter | Plot |
|---|---|
| CZT HV Monitor | 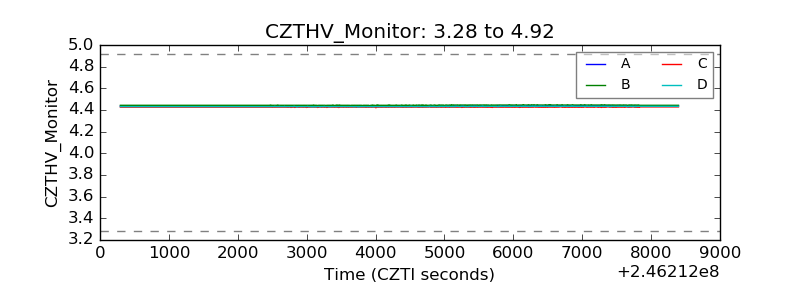 |
| D_VDD | 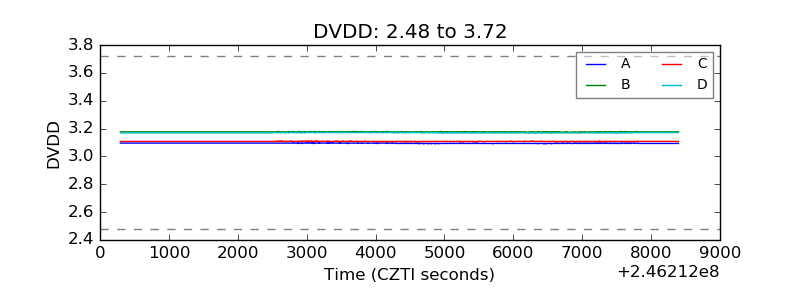 |
| Temperature 1 | 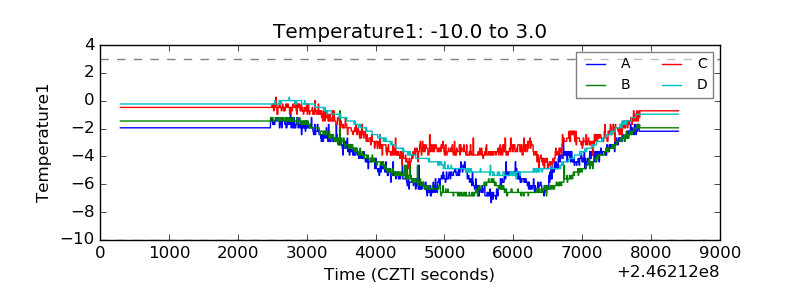 |
| Veto HV Monitor | 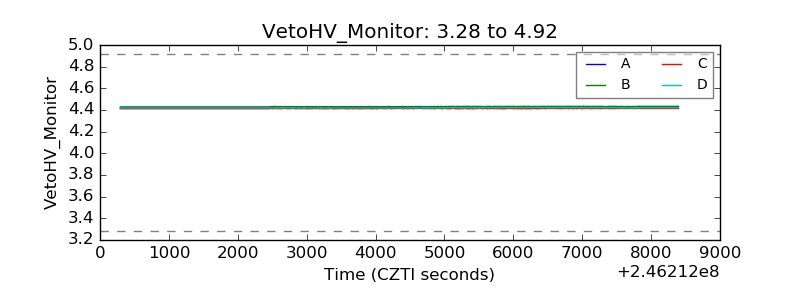 |
| Veto LLD | 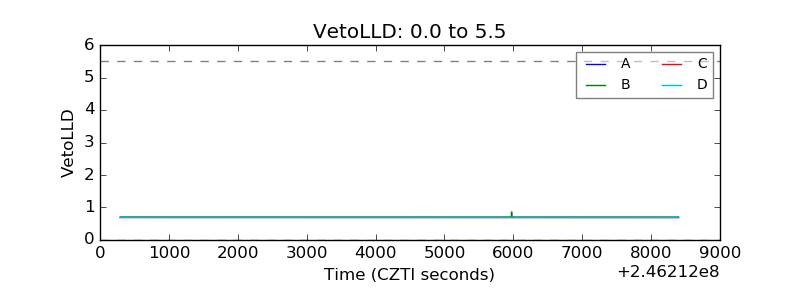 |
| Alpha Counter | 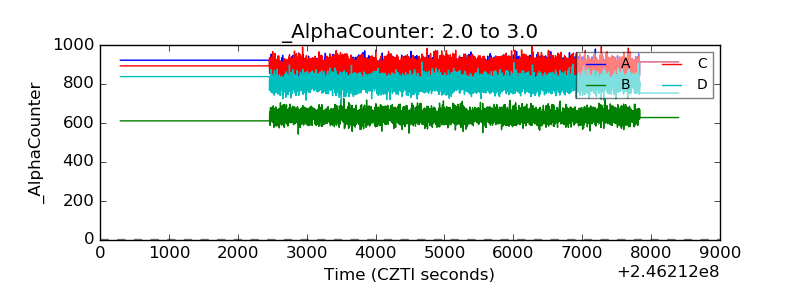 |
| _CPM_Rate | 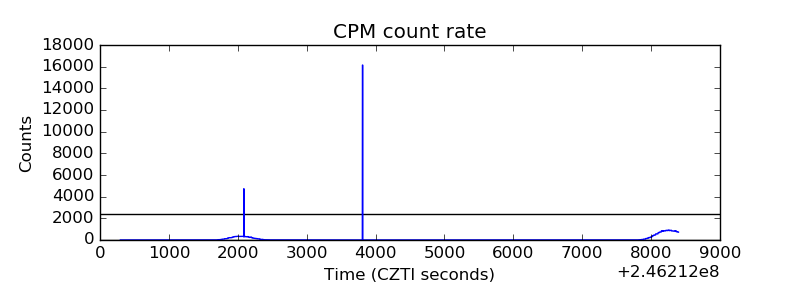 |
| CZT Counter |  |
| +2.5 Volts monitor |  |
| +5 Volts monitor |  |
| _ROLL_ROT | 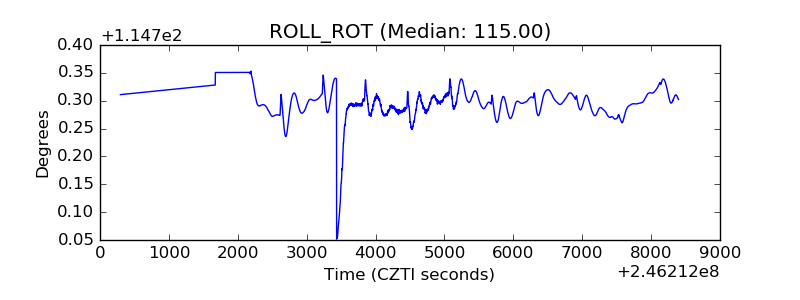 |
| _Roll_DEC | 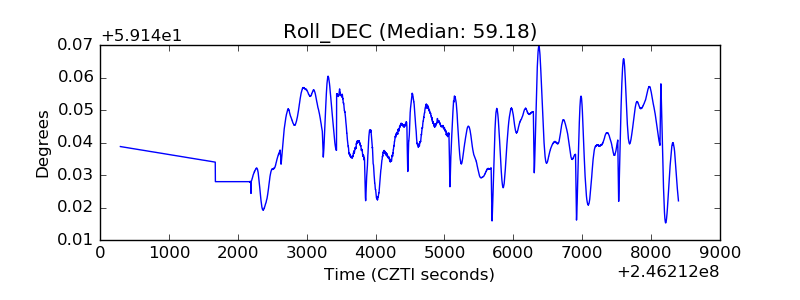 |
| _Roll_RA | 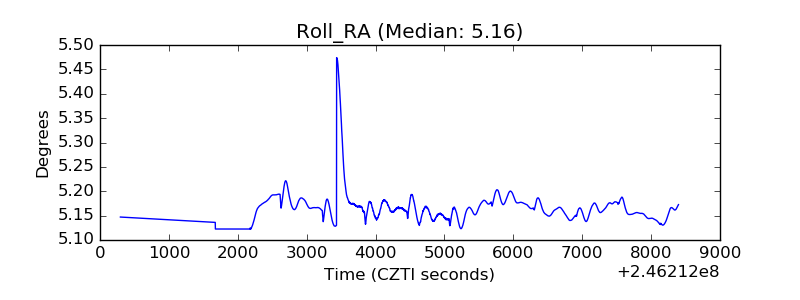 |
| Veto Counter | 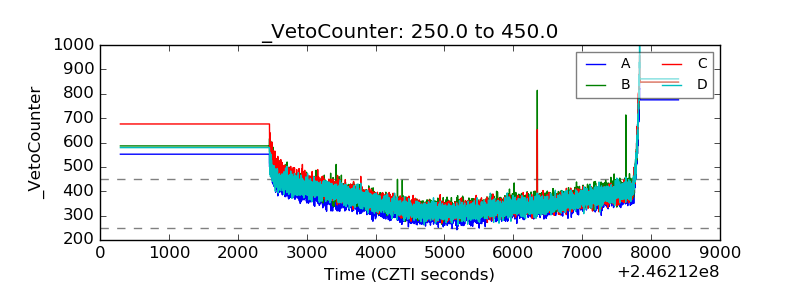 |