| Param | Original file | Final file |
|---|---|---|
| Filename | modeM0/AS1A04_145T03_9000001624cztM0_level2.fits | modeM0/AS1A04_145T03_9000001624cztM0_level2_quad_clean.evt |
| Size (bytes) | 68,938,560 | 64,687,680 |
| Size | 65.7 MB | 61.7 MB |
| Events in quadrant A | 407,644 | 373,448 |
| Events in quadrant B | 392,798 | 372,161 |
| Events in quadrant C | 412,426 | 365,323 |
| Events in quadrant D | 348,054 | 320,977 |
| Mode SS | |||
|---|---|---|---|
| Quadrant | BADHDUFLAG | Total packets | Discarded packets |
| A | 0 | 154 | 0 |
| B | 0 | 152 | 0 |
| C | 0 | 154 | 0 |
| D | 0 | 154 | 0 |
| Mode M0 | |||
|---|---|---|---|
| Quadrant | BADHDUFLAG | Total packets | Discarded packets |
| A | 0 | 21699 | 0 |
| B | 0 | 20251 | 0 |
| C | 0 | 15779 | 0 |
| D | 0 | 20476 | 0 |
| Quadrant | Total seconds | Saturated seconds | Saturation percentage |
|---|---|---|---|
| A | 7556 | 540 | 7.146638% |
| B | 7535 | 543 | 7.206370% |
| C | 7576 | 223 | 2.943506% |
| D | 7569 | 531 | 7.015458% |
Noise dominated data is calculated using 1-second bins in cleaned event files. If a bin has >2000 counts, and if more than 50% of those come from <1% of pixels, then it is considered to be noise-dominated and hence unusable.
| Quadrant | # 1 sec bins | Bins with >0 counts | Bins with >2000 counts | High rate bins dominated by noise | Noise dominated (total time) | Noise dominated (detector-on time) | Marked lightcurve |
|---|---|---|---|---|---|---|---|
| A | 7927 | 7658 | 0 | 0 | 0.00% | 0.00% |  |
| B | 7927 | 7641 | 0 | 0 | 0.00% | 0.00% |  |
| C | 7927 | 7672 | 0 | 0 | 0.00% | 0.00% |  |
| D | 7927 | 7647 | 0 | 0 | 0.00% | 0.00% |  |
Top three noisy pixels from each quadrant. If the there are fewer than three noisy pixels in the level2.evt file, extra rows are filled as -1
| Pixel properties | Quadrant properties | ||||||
|---|---|---|---|---|---|---|---|
| Quadrant | DetID | PixID | Counts | Sigma | Mean | Median | Sigma |
| A | 0 | 29 | 417 | 10.78 | 106 | 99 | 29.5 |
| A | 14 | 188 | 414 | 10.68 | 106 | 99 | 29.5 |
| A | 14 | 204 | 371 | 9.22 | 106 | 99 | 29.5 |
| B | 2 | 9 | 358 | 10.91 | 103 | 97 | 23.9 |
| B | 5 | 232 | 286 | 7.9 | 103 | 97 | 23.9 |
| B | 5 | 225 | 285 | 7.86 | 103 | 97 | 23.9 |
| C | 3 | 158 | 300 | 6.52 | 108 | 100 | 30.7 |
| C | 12 | 250 | 296 | 6.39 | 108 | 100 | 30.7 |
| C | 12 | 241 | 293 | 6.29 | 108 | 100 | 30.7 |
| D | 6 | 231 | 280 | 6.67 | 99 | 89 | 28.6 |
| D | 7 | 5 | 255 | 5.8 | 99 | 89 | 28.6 |
| D | 3 | 30 | 253 | 5.73 | 99 | 89 | 28.6 |
Histogram calculated using DETX and DETY for each event in the final _common_clean file
| Quadrant A | 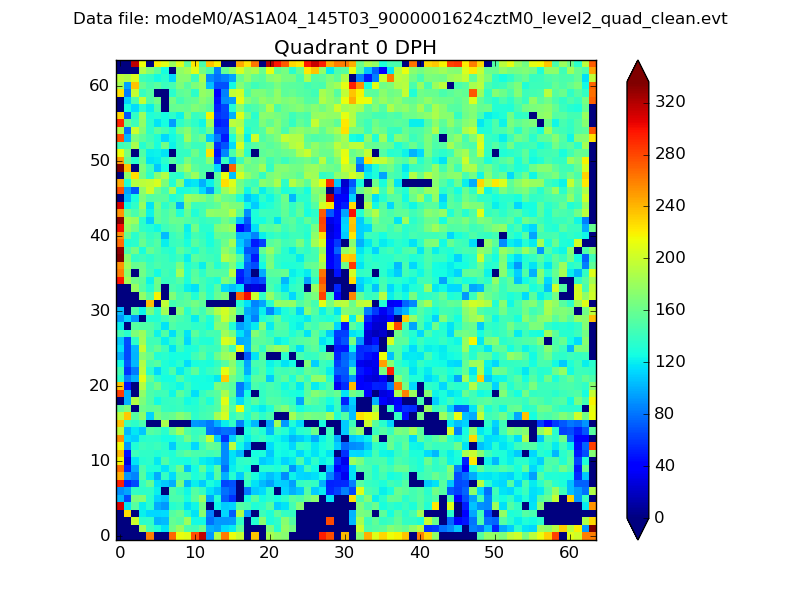 |
 |
Quadrant B |
|---|---|---|---|
| Quadrant D |  |
 |
Quadrant C |
| Plot type | Count rate plots | Images |
|---|---|---|
| Comparison with Poisson distribution Blue bars denote a histogram of data divided into 1 sec bins. Red curve is a Poisson curve with rate = median count rate of data. |
 |
 |
| Quadrant-wise count rates Data is divided into 100 sec bins |
 |
|
| Module-wise count rates for Quadrant A Data is divided into 100 sec bins |
 |
 |
| Module-wise count rates for Quadrant B Data is divided into 100 sec bins |
 |
 |
| Module-wise count rates for Quadrant C Data is divided into 100 sec bins |
 |
 |
| Module-wise count rates for Quadrant D Data is divided into 100 sec bins |
 |
 |
| Parameter | Plot |
|---|---|
| CZT HV Monitor |  |
| D_VDD |  |
| Temperature 1 |  |
| Veto HV Monitor |  |
| Veto LLD |  |
| Alpha Counter |  |
| _CPM_Rate |  |
| CZT Counter |  |
| +2.5 Volts monitor |  |
| +5 Volts monitor |  |
| _ROLL_ROT |  |
| _Roll_DEC |  |
| _Roll_RA |  |
| Veto Counter |  |