| Param | Original file | Final file |
|---|---|---|
| Filename | modeM0/AS1A04_145T03_9000001624_11150cztM0_level2.evt | modeM0/AS1A04_145T03_9000001624_11150cztM0_level2_quad_clean.evt |
| Size (bytes) | 326,571,840 | 29,632,320 |
| Size | 311.4 MB | 28.3 MB |
| Events in quadrant A | 2,712,507 | 158,883 |
| Events in quadrant B | 2,760,778 | 159,561 |
| Events in quadrant C | 1,856,539 | 161,385 |
| Events in quadrant D | 2,306,694 | 153,434 |
| Mode SS | |||
|---|---|---|---|
| Quadrant | BADHDUFLAG | Total packets | Discarded packets |
| A | 0 | 78 | 4 |
| B | 0 | 78 | 0 |
| C | 0 | 78 | 6 |
| D | 0 | 78 | 2 |
| Mode M0 | |||
|---|---|---|---|
| Quadrant | BADHDUFLAG | Total packets | Discarded packets |
| A | 0 | 10894 | 419 |
| B | 0 | 11085 | 423 |
| C | 0 | 8278 | 193 |
| D | 0 | 9749 | 406 |
| Quadrant | Total seconds | Saturated seconds | Saturation percentage |
|---|---|---|---|
| A | 3706 | 345 | 9.309228% |
| B | 3709 | 389 | 10.488002% |
| C | 3735 | 222 | 5.943775% |
| D | 3710 | 308 | 8.301887% |
Noise dominated data is calculated using 1-second bins in cleaned event files. If a bin has >2000 counts, and if more than 50% of those come from <1% of pixels, then it is considered to be noise-dominated and hence unusable.
| Quadrant | # 1 sec bins | Bins with >0 counts | Bins with >2000 counts | High rate bins dominated by noise | Noise dominated (total time) | Noise dominated (detector-on time) | Marked lightcurve |
|---|---|---|---|---|---|---|---|
| A | 3922 | 3742 | 29 | 29 | 0.74% | 0.77% | 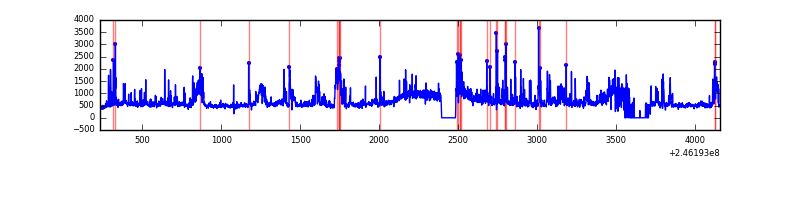 |
| B | 3922 | 3749 | 88 | 88 | 2.24% | 2.35% | 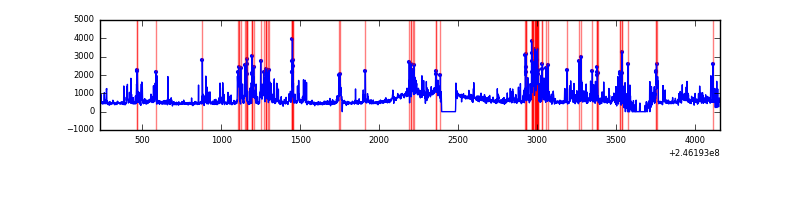 |
| C | 3922 | 3766 | 0 | 0 | 0.00% | 0.00% | 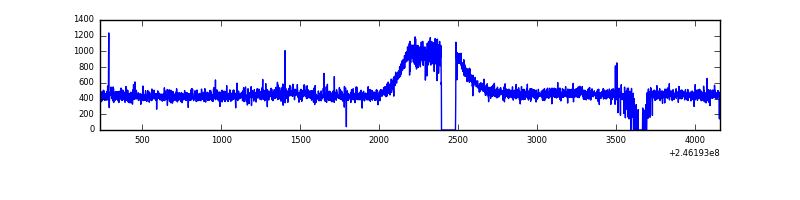 |
| D | 3922 | 3751 | 44 | 44 | 1.12% | 1.17% | 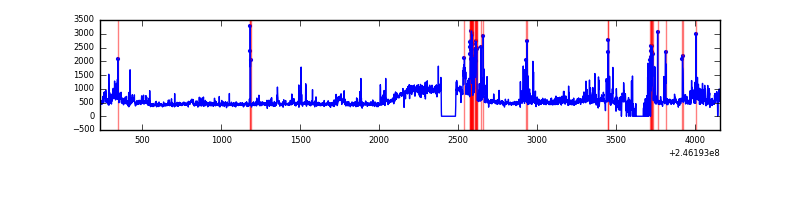 |
Top three noisy pixels from each quadrant. If the there are fewer than three noisy pixels in the level2.evt file, extra rows are filled as -1
| Pixel properties | Quadrant properties | ||||||
|---|---|---|---|---|---|---|---|
| Quadrant | DetID | PixID | Counts | Sigma | Mean | Median | Sigma |
| A | 8 | 5 | 698696 | 6965.1 | 479 | 466 | 100.2 |
| A | 14 | 238 | 98788 | 980.8 | 479 | 466 | 100.2 |
| A | 8 | 15 | 50544 | 499.55 | 479 | 466 | 100.2 |
| B | 4 | 239 | 718337 | 7615.76 | 468 | 457 | 94.3 |
| B | 15 | 204 | 65555 | 690.6 | 468 | 457 | 94.3 |
| B | 4 | 80 | 55214 | 580.9 | 468 | 457 | 94.3 |
| C | 13 | 61 | 3620 | 27.82 | 473 | 474 | 113.1 |
| C | 8 | 128 | 3235 | 24.42 | 473 | 474 | 113.1 |
| C | 5 | 128 | 2872 | 21.21 | 473 | 474 | 113.1 |
| D | 1 | 52 | 206417 | 1805.99 | 465 | 452 | 114.0 |
| D | 10 | 253 | 107948 | 942.57 | 465 | 452 | 114.0 |
| D | 13 | 152 | 66920 | 582.82 | 465 | 452 | 114.0 |
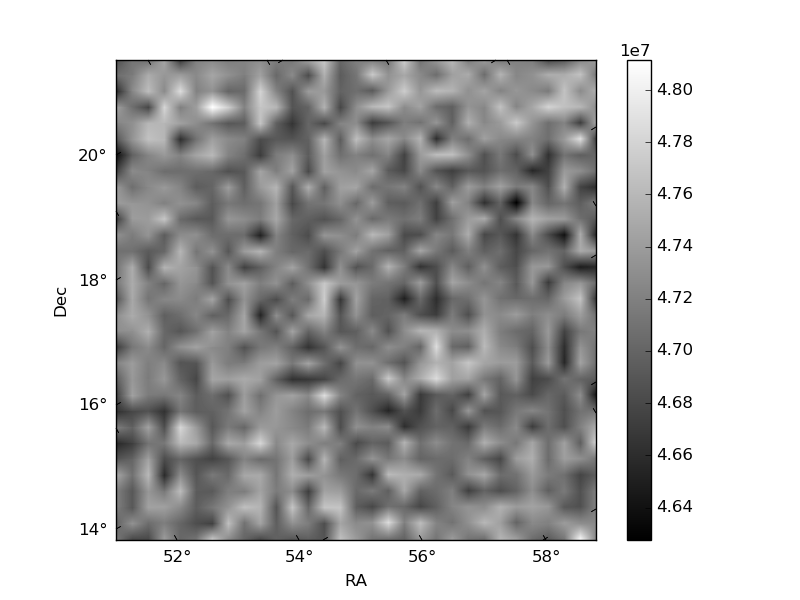
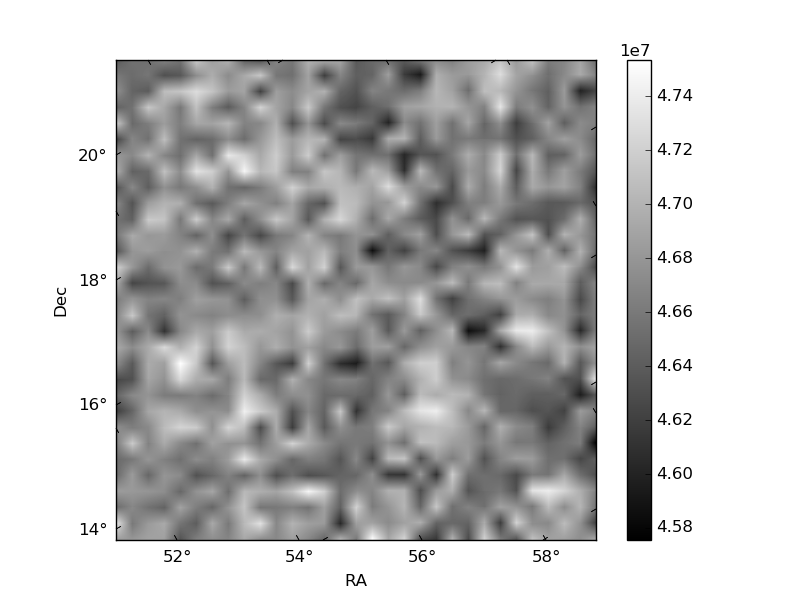
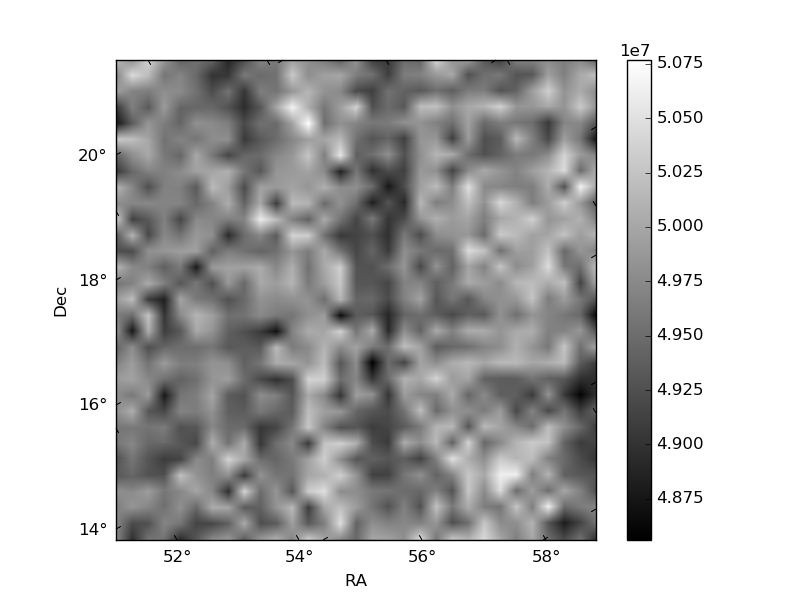
Histogram calculated using DETX and DETY for each event in the final _common_clean file
| Quadrant A | 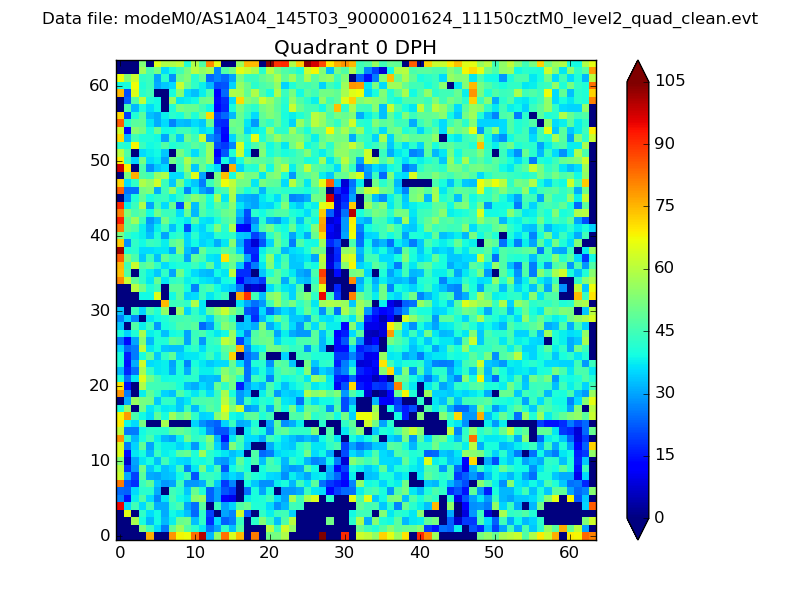 |
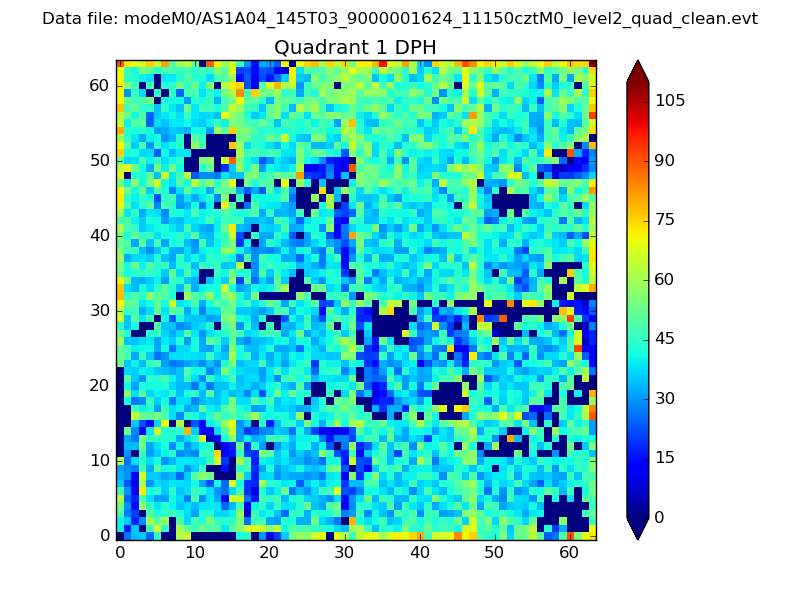 |
Quadrant B |
|---|---|---|---|
| Quadrant D | 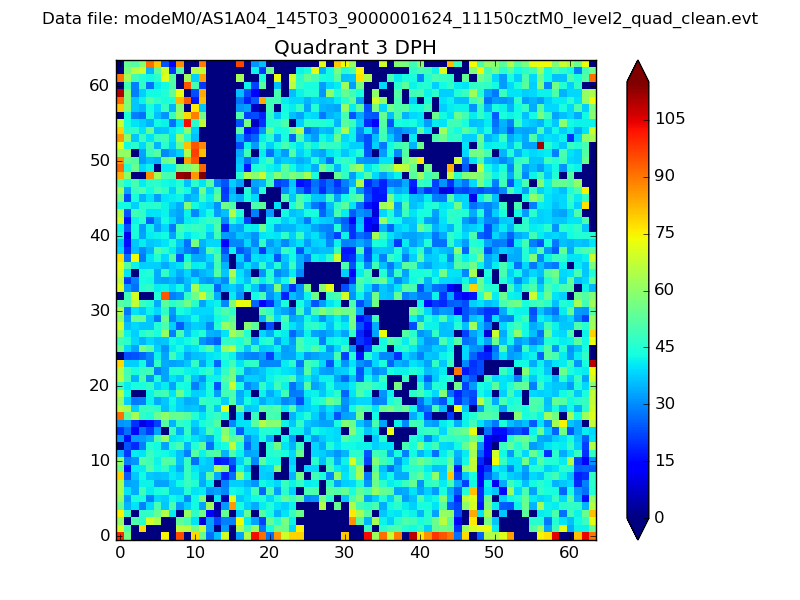 |
 |
Quadrant C |
| Plot type | Count rate plots | Images |
|---|---|---|
| Comparison with Poisson distribution Blue bars denote a histogram of data divided into 1 sec bins. Red curve is a Poisson curve with rate = median count rate of data. |
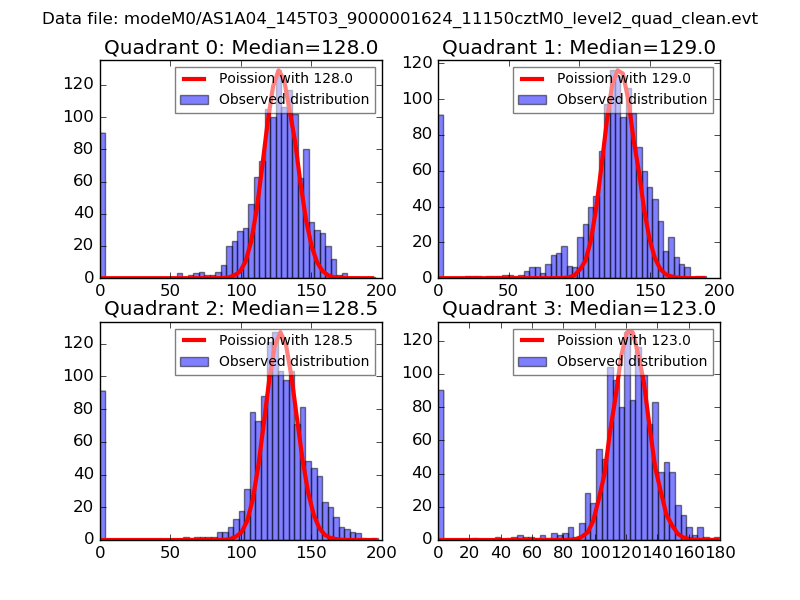 |
 |
| Quadrant-wise count rates Data is divided into 100 sec bins |
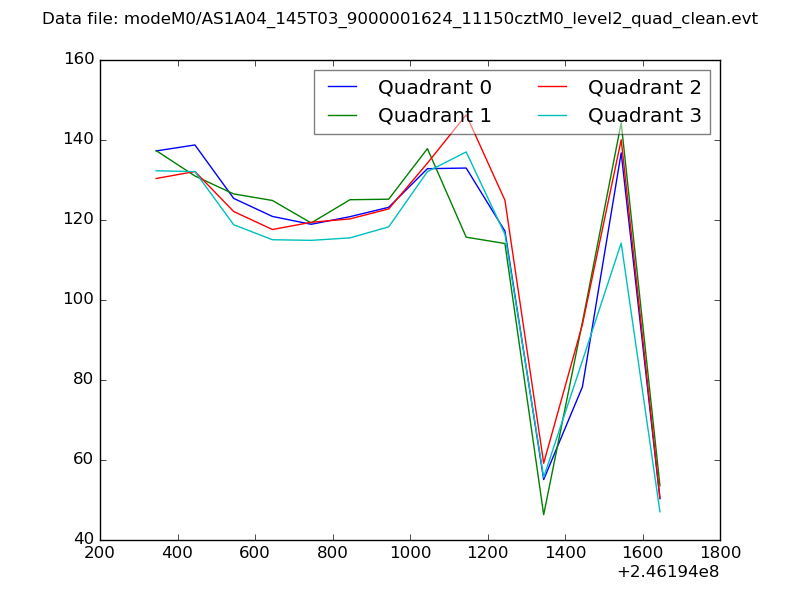 |
|
| Module-wise count rates for Quadrant A Data is divided into 100 sec bins |
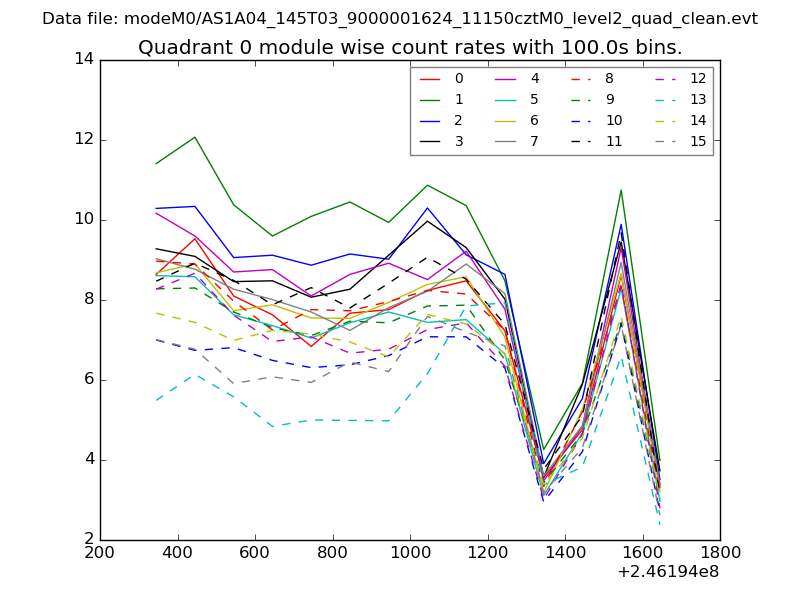 |
 |
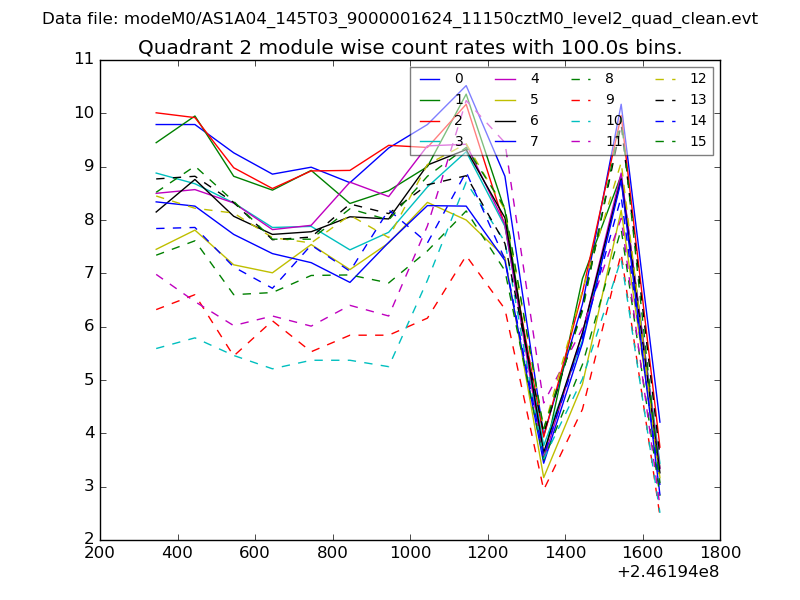
| Module-wise count rates for Quadrant B Data is divided into 100 sec bins |
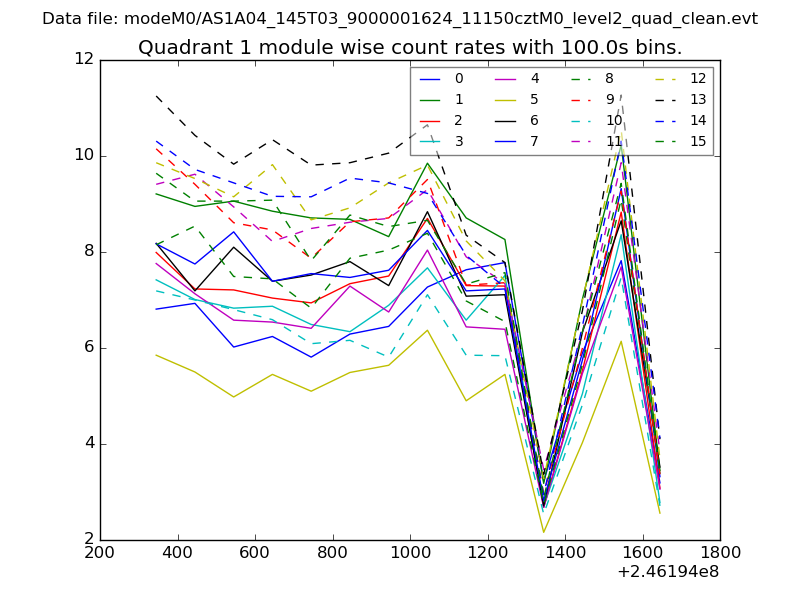 |
 |
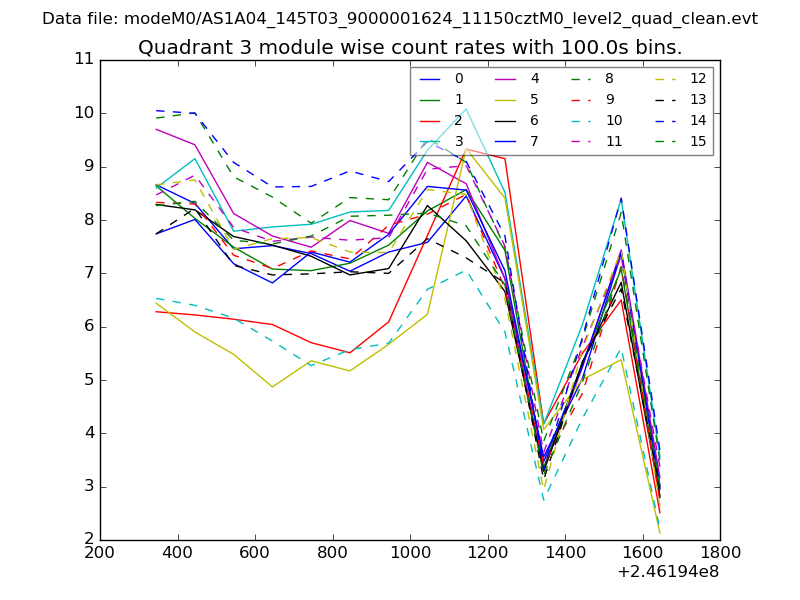
| Module-wise count rates for Quadrant C Data is divided into 100 sec bins |
 |
 |
| Module-wise count rates for Quadrant D Data is divided into 100 sec bins |
 |
 |
| Parameter | Plot |
|---|---|
| CZT HV Monitor | 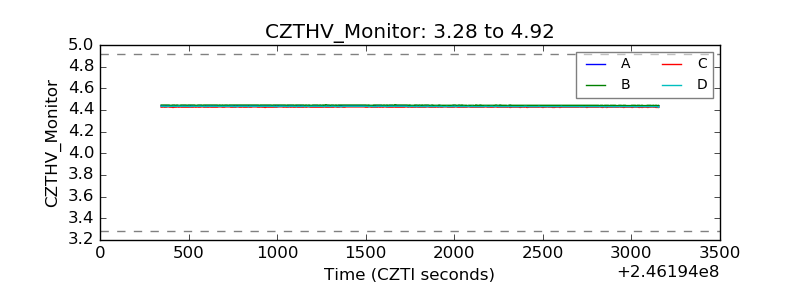 |
| D_VDD |  |
| Temperature 1 | 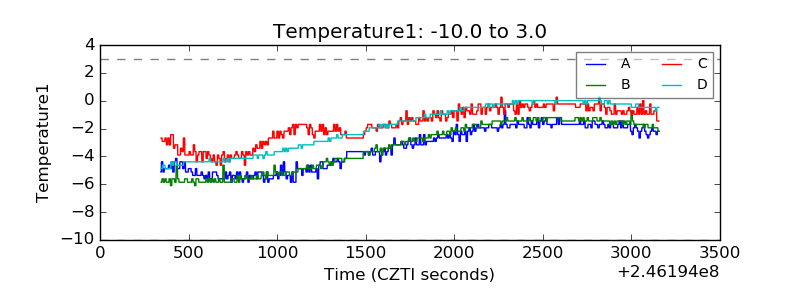 |
| Veto HV Monitor | 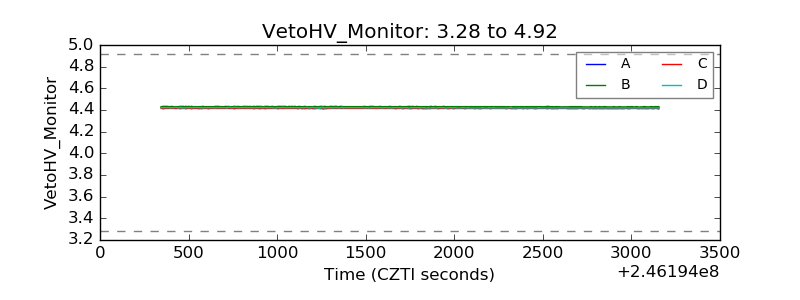 |
| Veto LLD | 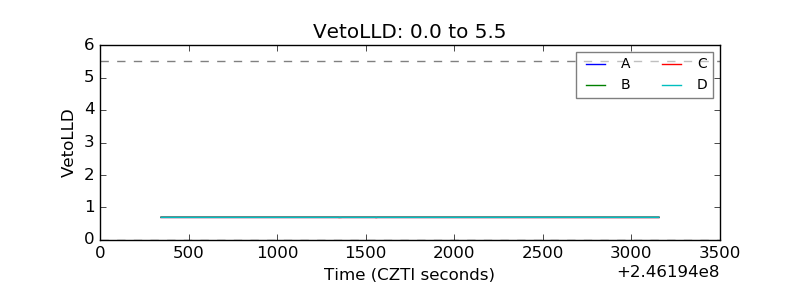 |
| Alpha Counter | 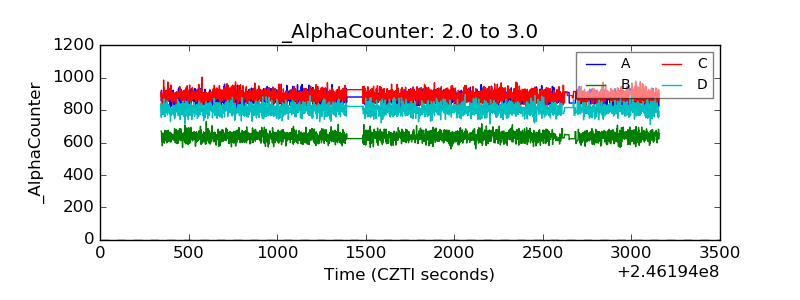 |
| _CPM_Rate | 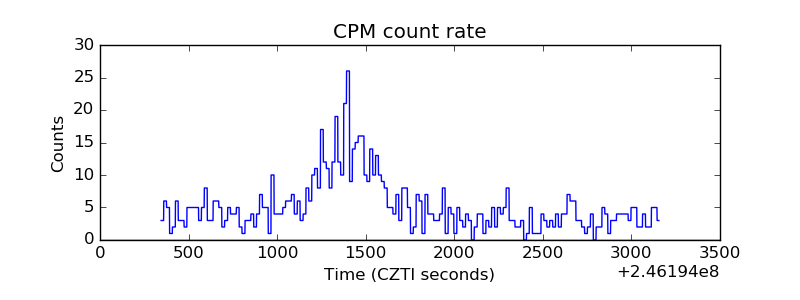 |
| CZT Counter |  |
| +2.5 Volts monitor |  |
| +5 Volts monitor |  |
| _ROLL_ROT | 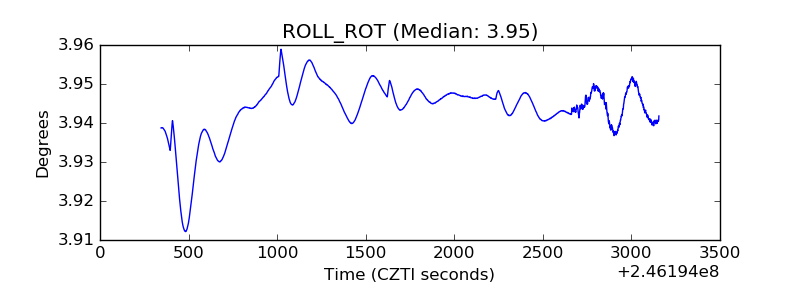 |
| _Roll_DEC | 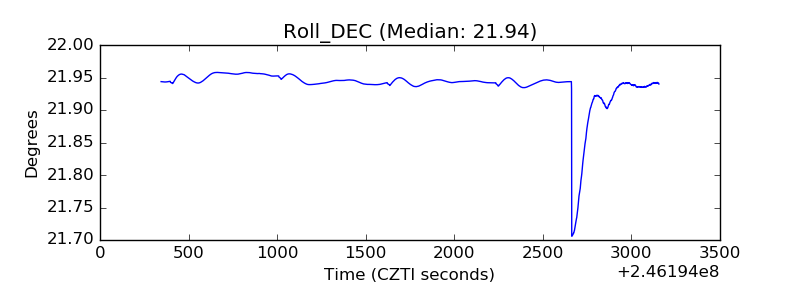 |
| _Roll_RA | 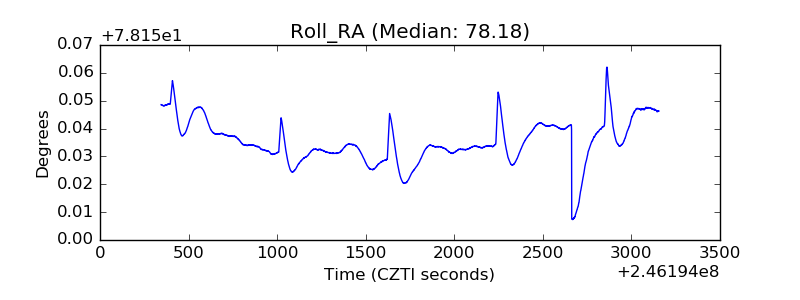 |
| Veto Counter | 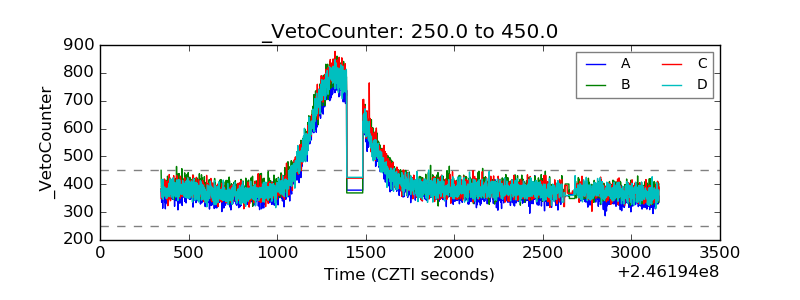 |