| Param | Original file | Final file |
|---|---|---|
| Filename | modeM0/AS1A04_145T03_9000001624_11153cztM0_level2.evt | modeM0/AS1A04_145T03_9000001624_11153cztM0_level2_quad_clean.evt |
| Size (bytes) | 552,098,880 | 74,894,400 |
| Size | 526.5 MB | 71.4 MB |
| Events in quadrant A | 4,650,350 | 467,813 |
| Events in quadrant B | 4,258,303 | 468,489 |
| Events in quadrant C | 2,866,479 | 472,088 |
| Events in quadrant D | 4,532,988 | 434,370 |
| Mode SS | |||
|---|---|---|---|
| Quadrant | BADHDUFLAG | Total packets | Discarded packets |
| A | 0 | 122 | 0 |
| B | 0 | 122 | 0 |
| C | 0 | 122 | 0 |
| D | 0 | 122 | 0 |
| Mode M0 | |||
|---|---|---|---|
| Quadrant | BADHDUFLAG | Total packets | Discarded packets |
| A | 0 | 17934 | 1 |
| B | 0 | 16657 | 1 |
| C | 0 | 12764 | 1 |
| D | 0 | 17545 | 1 |
| Quadrant | Total seconds | Saturated seconds | Saturation percentage |
|---|---|---|---|
| A | 6075 | 518 | 8.526749% |
| B | 6075 | 525 | 8.641975% |
| C | 6075 | 221 | 3.637860% |
| D | 6075 | 537 | 8.839506% |
Noise dominated data is calculated using 1-second bins in cleaned event files. If a bin has >2000 counts, and if more than 50% of those come from <1% of pixels, then it is considered to be noise-dominated and hence unusable.
| Quadrant | # 1 sec bins | Bins with >0 counts | Bins with >2000 counts | High rate bins dominated by noise | Noise dominated (total time) | Noise dominated (detector-on time) | Marked lightcurve |
|---|---|---|---|---|---|---|---|
| A | 6165 | 6076 | 152 | 152 | 2.47% | 2.50% | 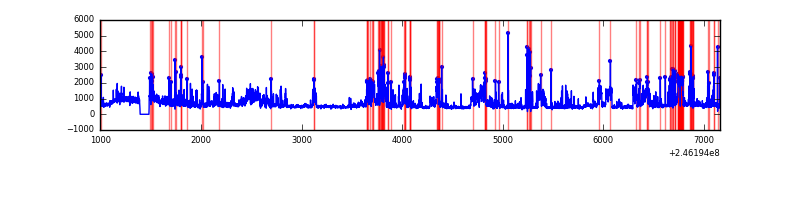 |
| B | 6165 | 6076 | 187 | 187 | 3.03% | 3.08% | 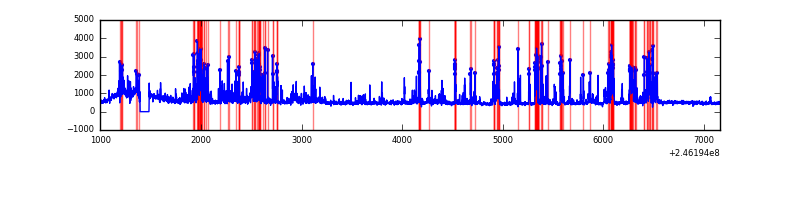 |
| C | 6165 | 6076 | 0 | 0 | 0.00% | 0.00% | 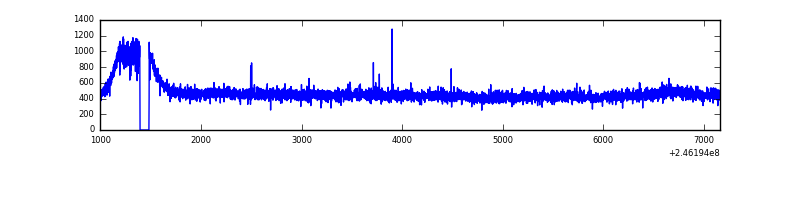 |
| D | 6165 | 6076 | 249 | 249 | 4.04% | 4.10% | 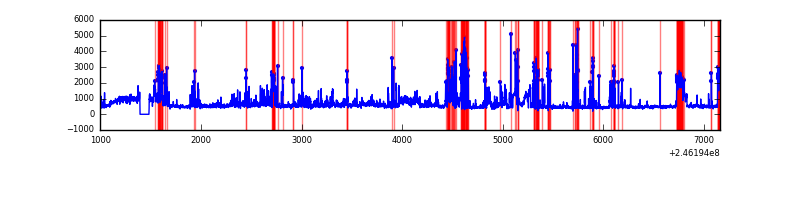 |
Top three noisy pixels from each quadrant. If the there are fewer than three noisy pixels in the level2.evt file, extra rows are filled as -1
| Pixel properties | Quadrant properties | ||||||
|---|---|---|---|---|---|---|---|
| Quadrant | DetID | PixID | Counts | Sigma | Mean | Median | Sigma |
| A | 8 | 5 | 1213156 | 7910.17 | 739 | 723 | 153.3 |
| A | 14 | 238 | 255674 | 1663.35 | 739 | 723 | 153.3 |
| A | 0 | 23 | 192368 | 1250.33 | 739 | 723 | 153.3 |
| B | 4 | 239 | 1134745 | 7954.34 | 729 | 711 | 142.6 |
| B | 15 | 204 | 112037 | 780.86 | 729 | 711 | 142.6 |
| B | 4 | 80 | 52093 | 360.4 | 729 | 711 | 142.6 |
| C | 8 | 128 | 9032 | 48.38 | 728 | 729 | 171.6 |
| C | 14 | 67 | 8444 | 44.95 | 728 | 729 | 171.6 |
| C | 8 | 112 | 5709 | 29.01 | 728 | 729 | 171.6 |
| D | 13 | 152 | 649066 | 3715.24 | 713 | 690 | 174.5 |
| D | 10 | 253 | 431163 | 2466.64 | 713 | 690 | 174.5 |
| D | 1 | 52 | 331742 | 1896.95 | 713 | 690 | 174.5 |
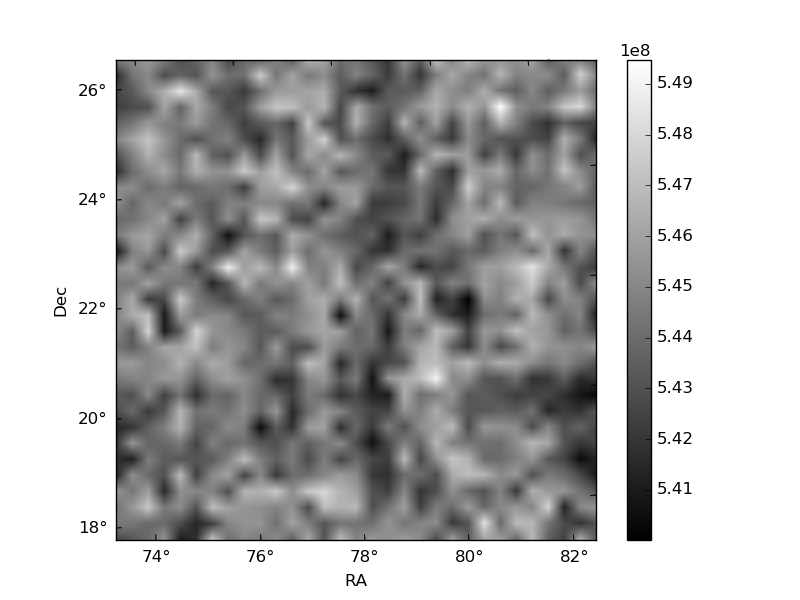
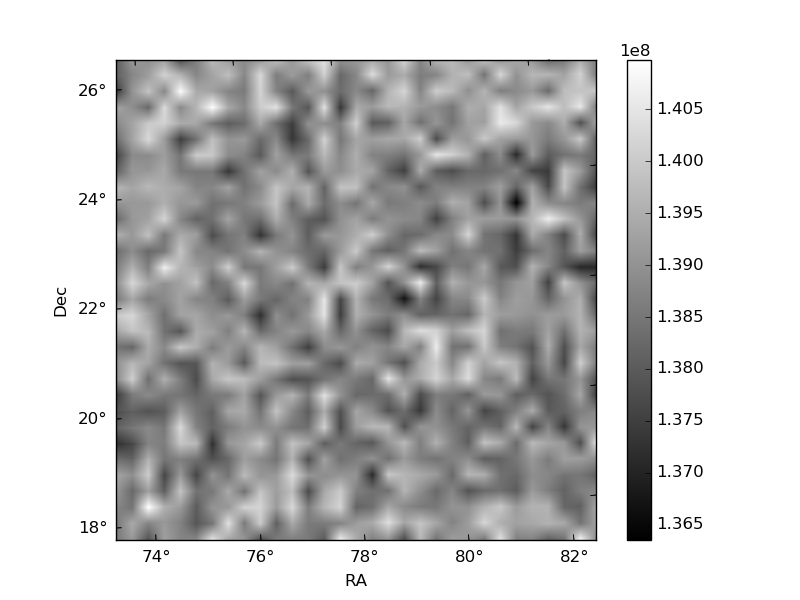
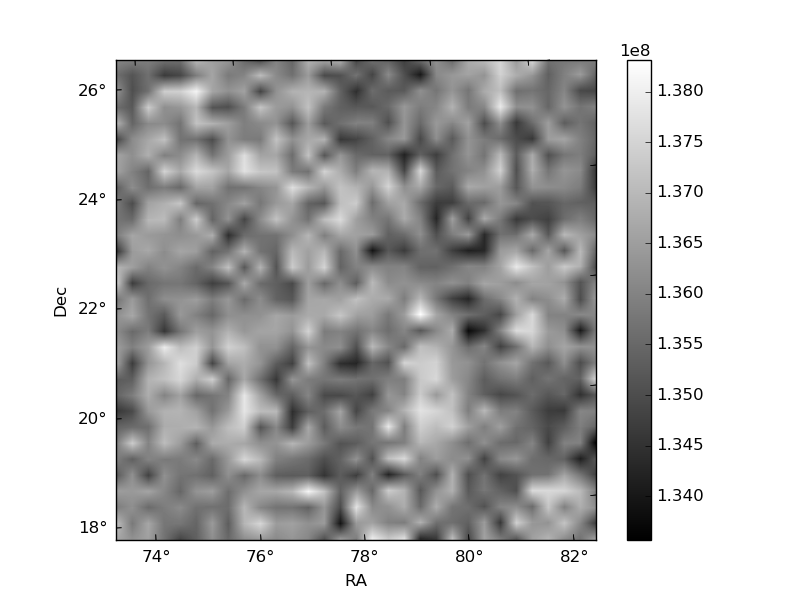
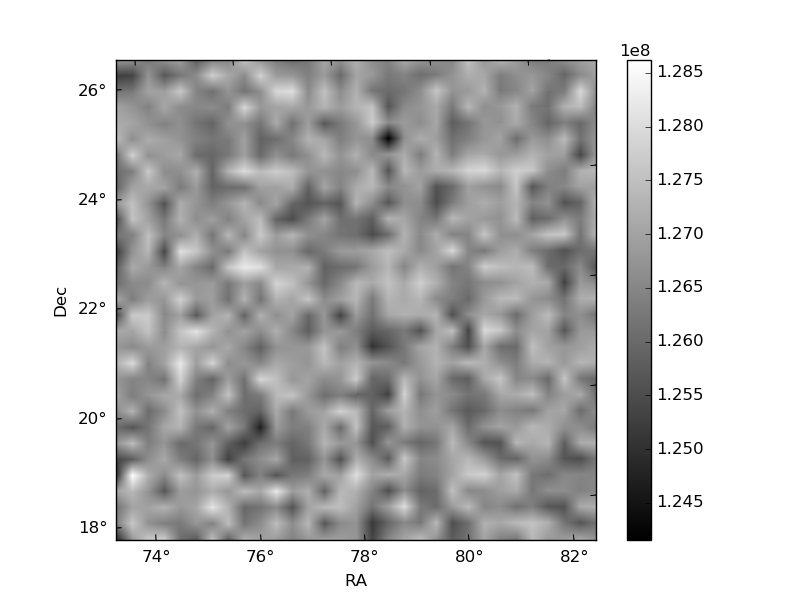
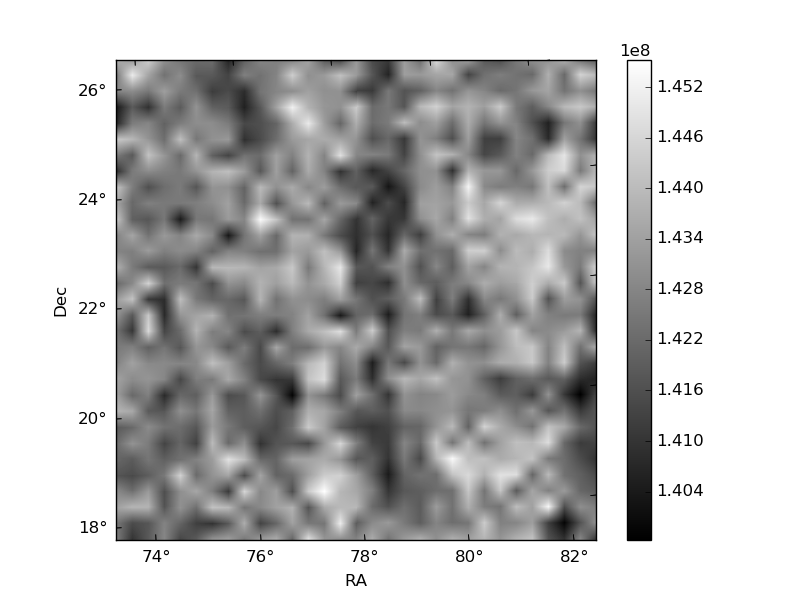
Histogram calculated using DETX and DETY for each event in the final _common_clean file
| Quadrant A | 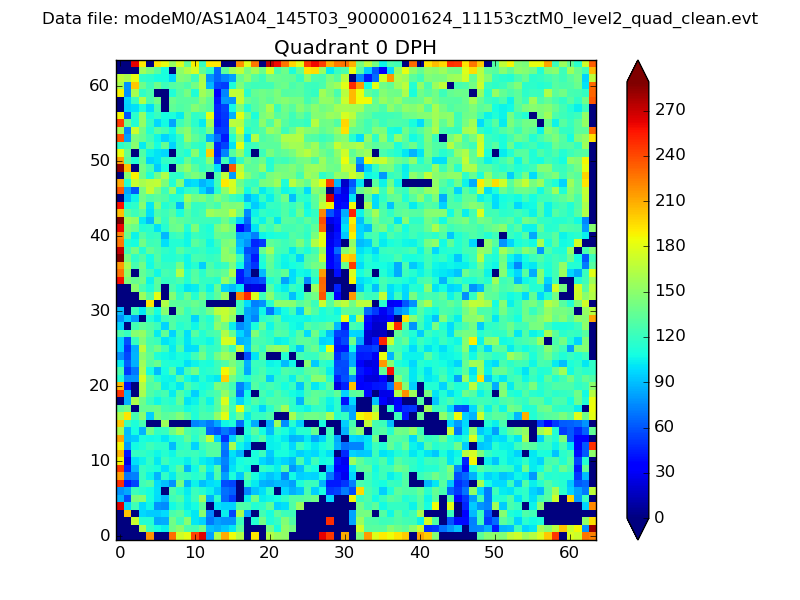 |
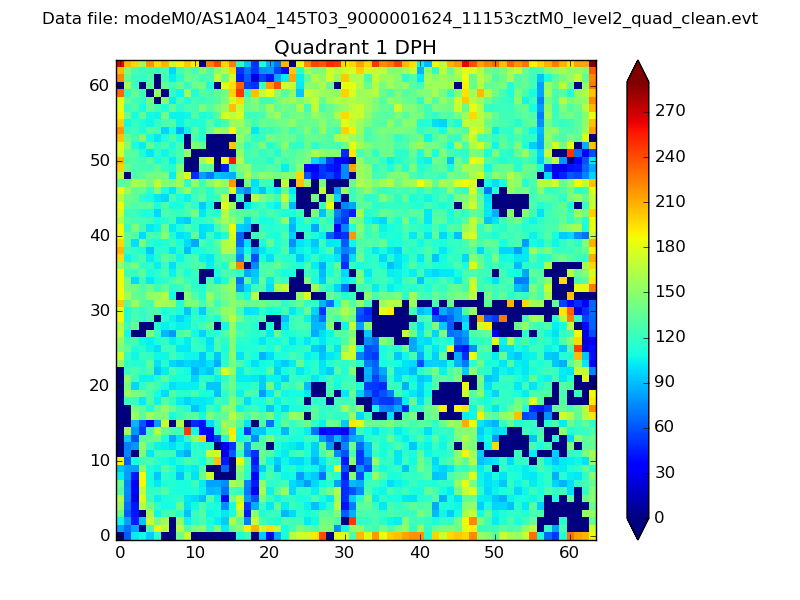 |
Quadrant B |
|---|---|---|---|
| Quadrant D | 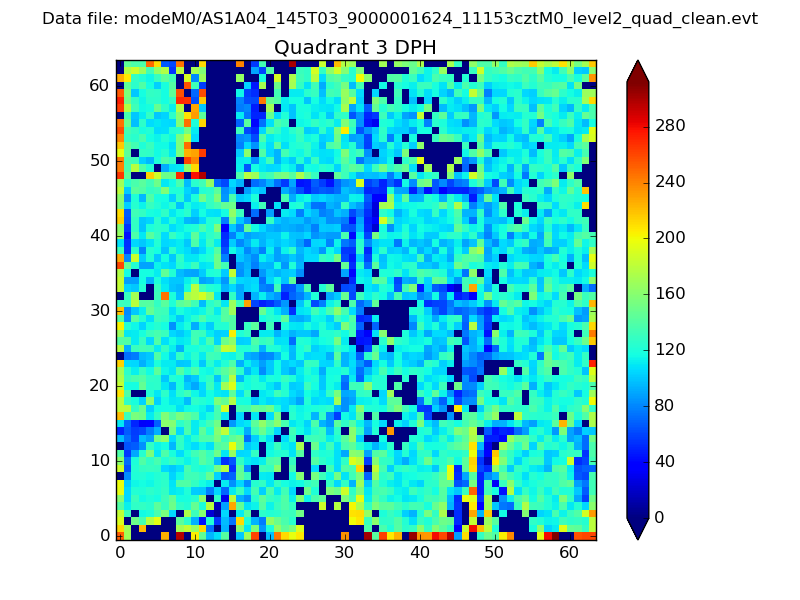 |
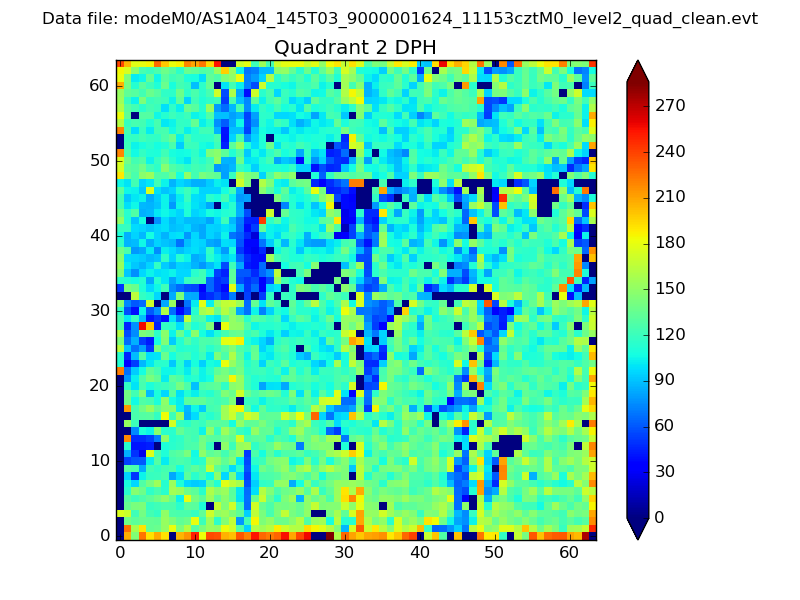 |
Quadrant C |
| Plot type | Count rate plots | Images |
|---|---|---|
| Comparison with Poisson distribution Blue bars denote a histogram of data divided into 1 sec bins. Red curve is a Poisson curve with rate = median count rate of data. |
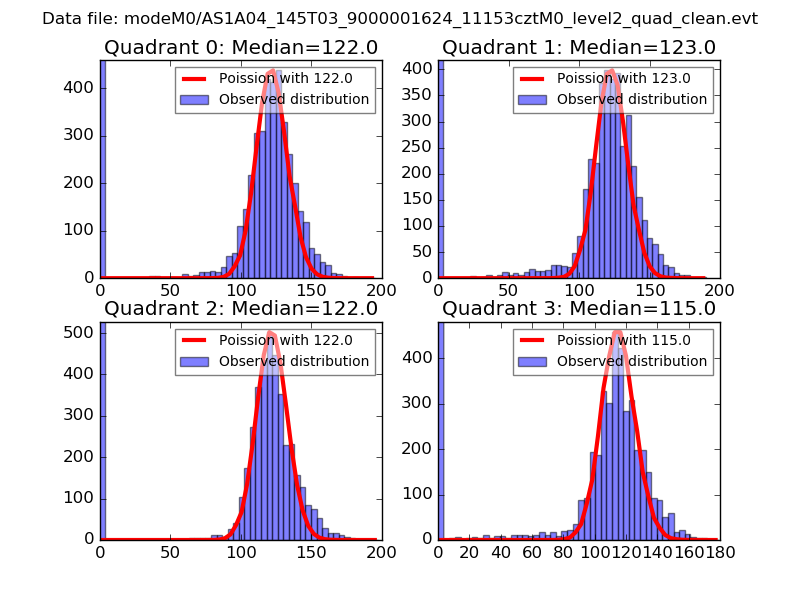 |
 |
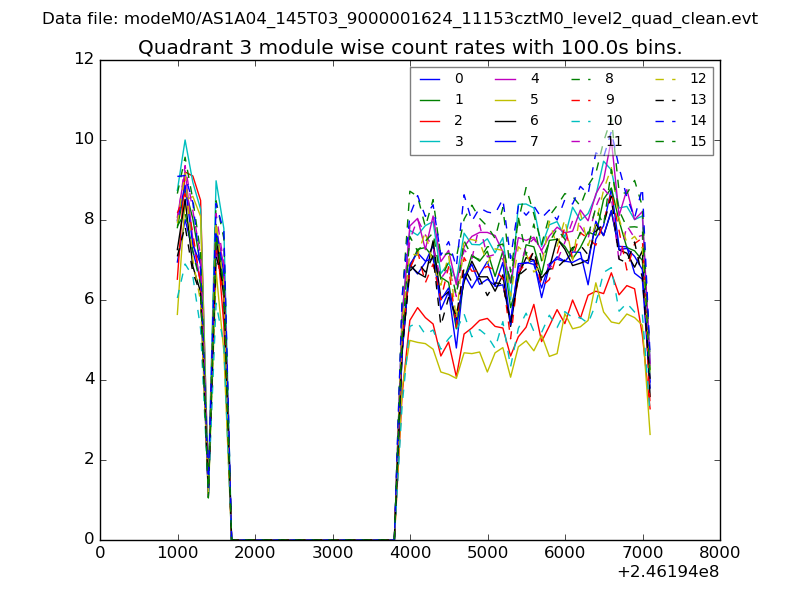
| Quadrant-wise count rates Data is divided into 100 sec bins |
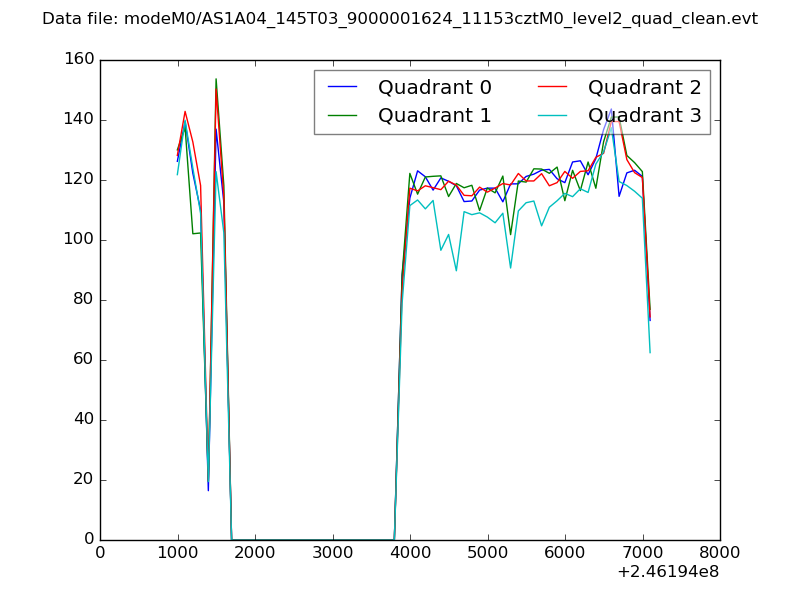 |
|
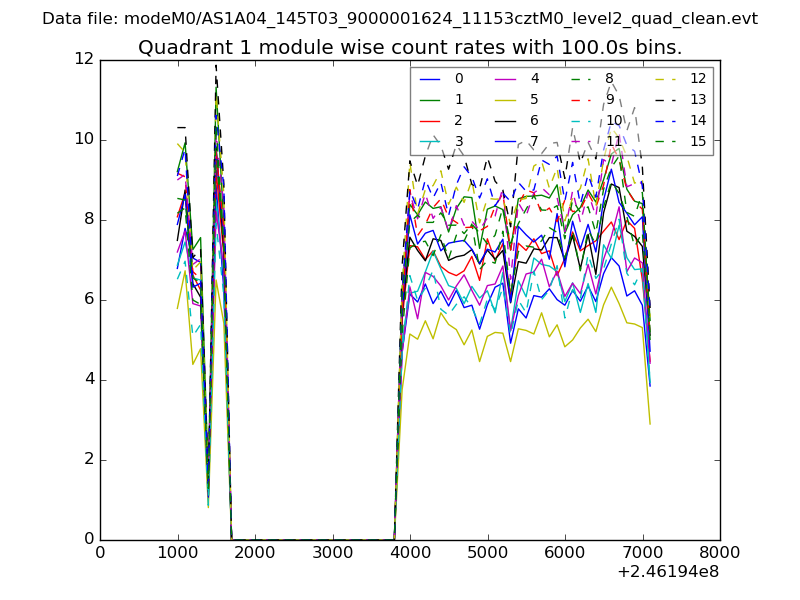
| Module-wise count rates for Quadrant A Data is divided into 100 sec bins |
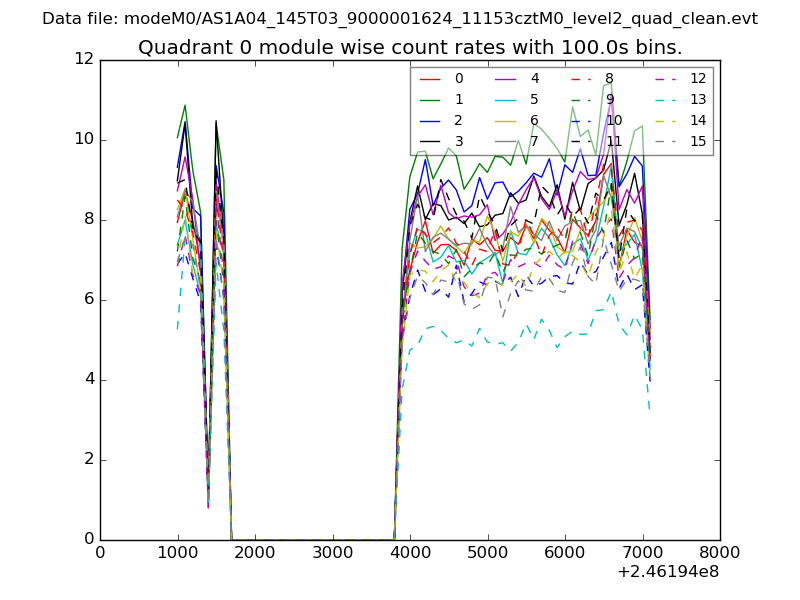 |
 |
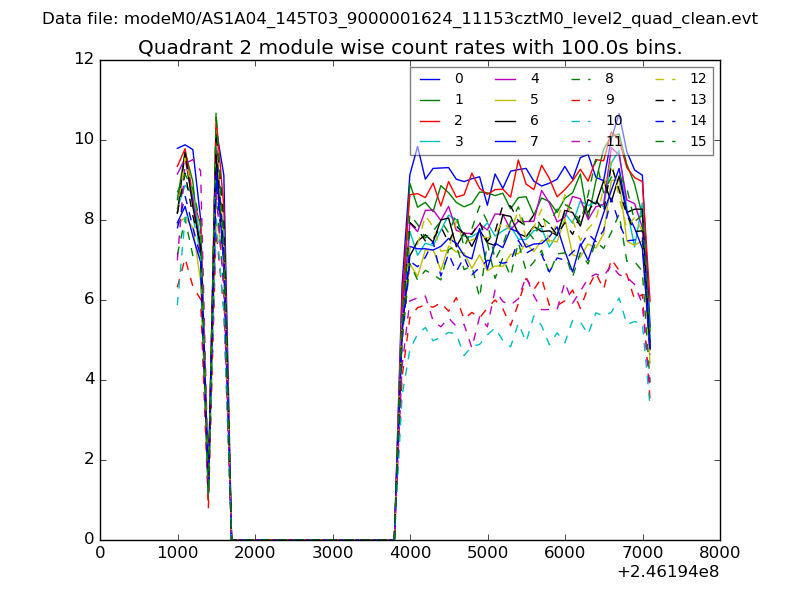
| Module-wise count rates for Quadrant B Data is divided into 100 sec bins |
 |
 |
| Module-wise count rates for Quadrant C Data is divided into 100 sec bins |
 |
 |
| Module-wise count rates for Quadrant D Data is divided into 100 sec bins |
 |
 |
| Parameter | Plot |
|---|---|
| CZT HV Monitor | 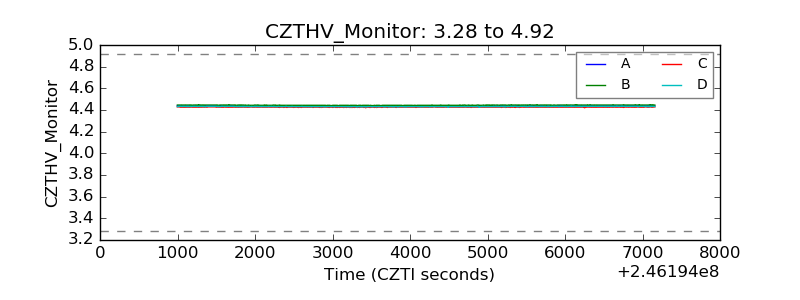 |
| D_VDD | 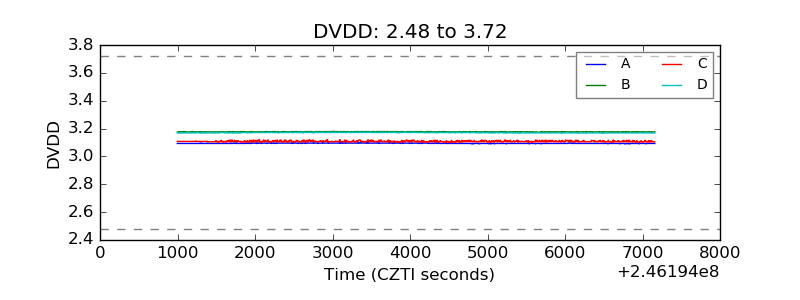 |
| Temperature 1 | 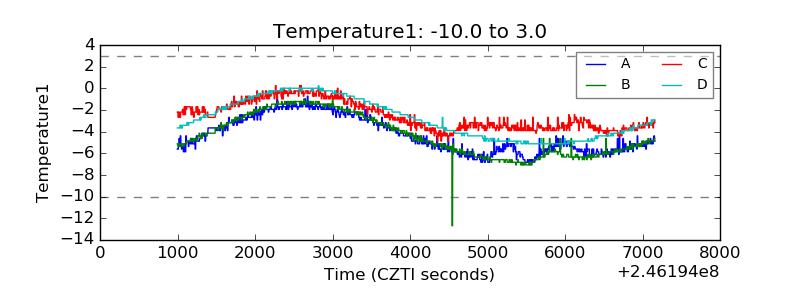 |
| Veto HV Monitor | 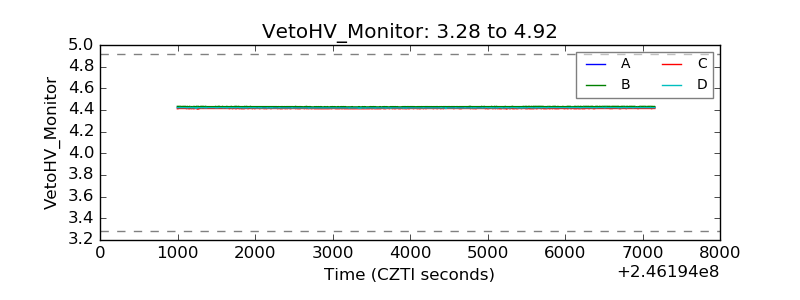 |
| Veto LLD | 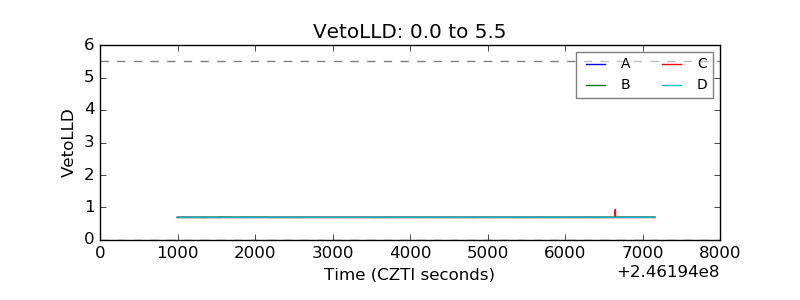 |
| Alpha Counter | 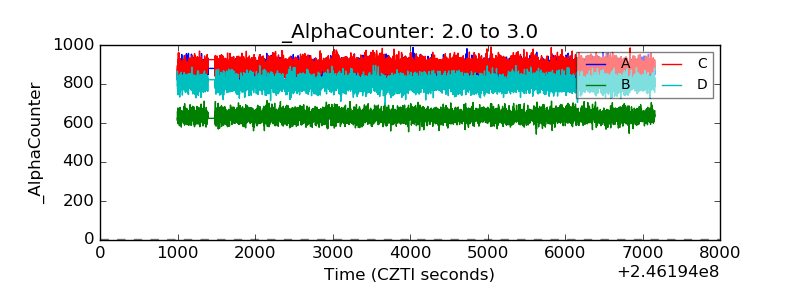 |
| _CPM_Rate | 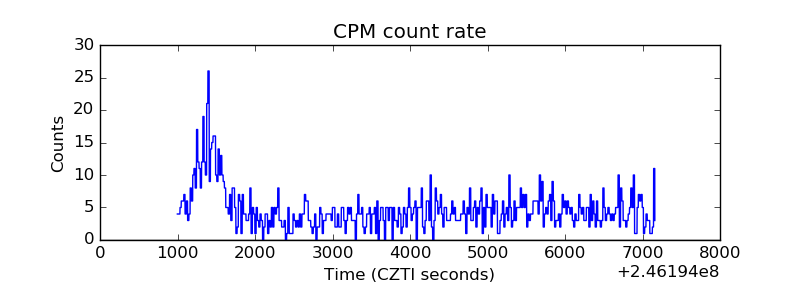 |
| CZT Counter | 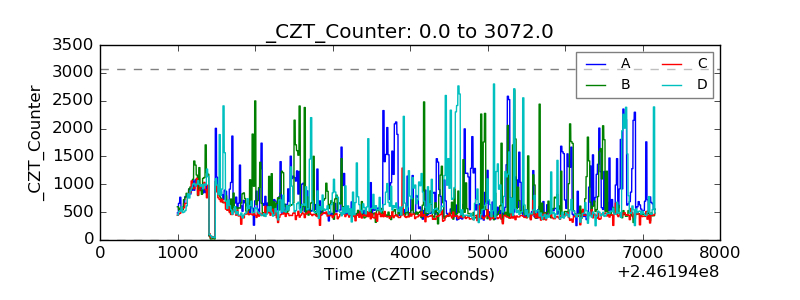 |
| +2.5 Volts monitor |  |
| +5 Volts monitor |  |
| _ROLL_ROT | 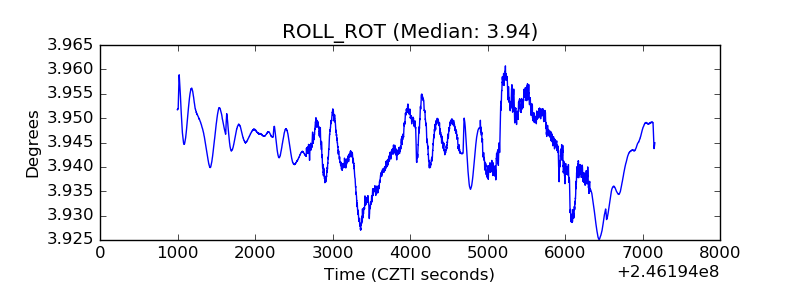 |
| _Roll_DEC | 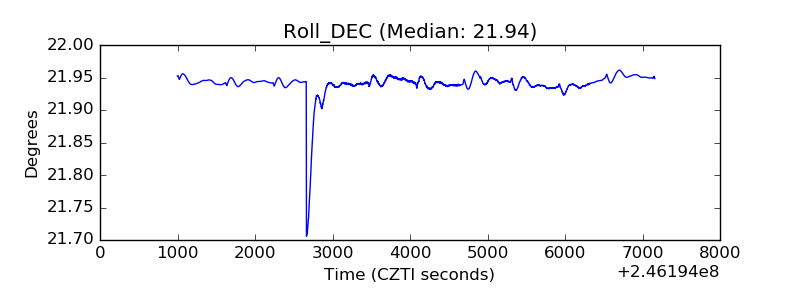 |
| _Roll_RA | 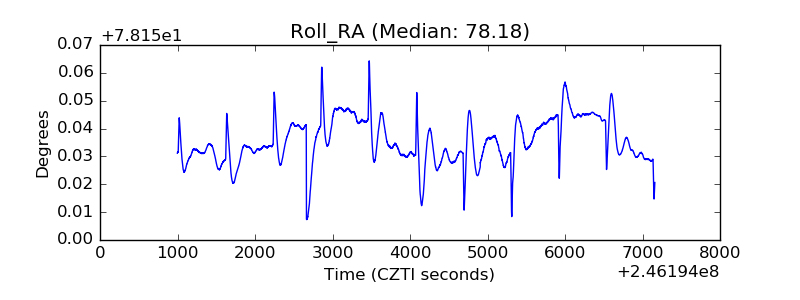 |
| Veto Counter | 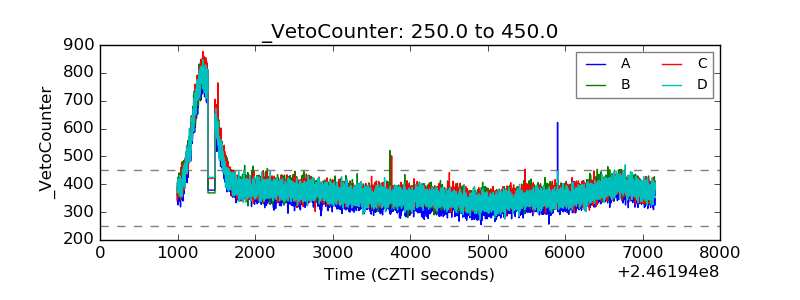 |