| Param | Original file | Final file |
|---|---|---|
| Filename | modeM0/AS1A04_145T03_9000001624_11154cztM0_level2.evt | modeM0/AS1A04_145T03_9000001624_11154cztM0_level2_quad_clean.evt |
| Size (bytes) | 660,096,000 | 102,657,600 |
| Size | 629.5 MB | 97.9 MB |
| Events in quadrant A | 5,612,705 | 654,981 |
| Events in quadrant B | 5,158,886 | 655,098 |
| Events in quadrant C | 3,527,188 | 657,816 |
| Events in quadrant D | 5,179,829 | 613,849 |
| Mode SS | |||
|---|---|---|---|
| Quadrant | BADHDUFLAG | Total packets | Discarded packets |
| A | 0 | 158 | 4 |
| B | 0 | 158 | 6 |
| C | 0 | 158 | 4 |
| D | 0 | 158 | 4 |
| Mode M0 | |||
|---|---|---|---|
| Quadrant | BADHDUFLAG | Total packets | Discarded packets |
| A | 0 | 22440 | 741 |
| B | 0 | 21116 | 865 |
| C | 0 | 16226 | 447 |
| D | 0 | 21213 | 737 |
| Quadrant | Total seconds | Saturated seconds | Saturation percentage |
|---|---|---|---|
| A | 7556 | 540 | 7.146638% |
| B | 7535 | 543 | 7.206370% |
| C | 7576 | 223 | 2.943506% |
| D | 7569 | 531 | 7.015458% |
Noise dominated data is calculated using 1-second bins in cleaned event files. If a bin has >2000 counts, and if more than 50% of those come from <1% of pixels, then it is considered to be noise-dominated and hence unusable.
| Quadrant | # 1 sec bins | Bins with >0 counts | Bins with >2000 counts | High rate bins dominated by noise | Noise dominated (total time) | Noise dominated (detector-on time) | Marked lightcurve |
|---|---|---|---|---|---|---|---|
| A | 7927 | 7659 | 154 | 154 | 1.94% | 2.01% | 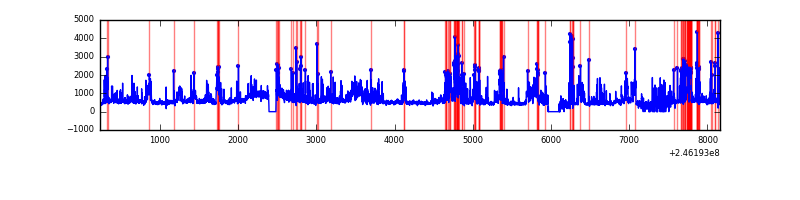 |
| B | 7927 | 7643 | 188 | 188 | 2.37% | 2.46% | 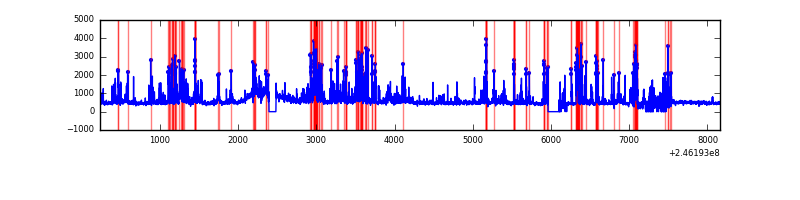 |
| C | 7927 | 7673 | 0 | 0 | 0.00% | 0.00% | 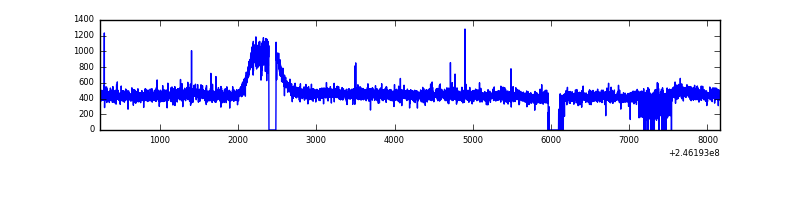 |
| D | 7927 | 7658 | 245 | 245 | 3.09% | 3.20% | 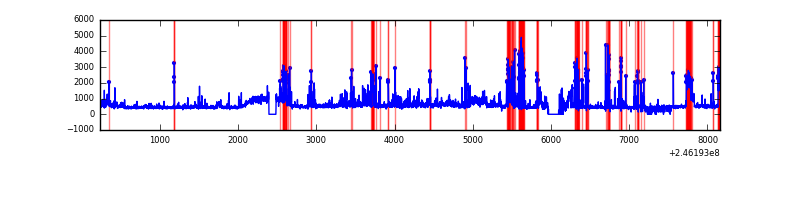 |
Top three noisy pixels from each quadrant. If the there are fewer than three noisy pixels in the level2.evt file, extra rows are filled as -1
| Pixel properties | Quadrant properties | ||||||
|---|---|---|---|---|---|---|---|
| Quadrant | DetID | PixID | Counts | Sigma | Mean | Median | Sigma |
| A | 8 | 5 | 1475448 | 7825.79 | 913 | 892 | 188.4 |
| A | 14 | 238 | 250491 | 1324.68 | 913 | 892 | 188.4 |
| A | 0 | 23 | 192418 | 1016.47 | 913 | 892 | 188.4 |
| B | 4 | 239 | 1332686 | 7612.36 | 900 | 877 | 175.0 |
| B | 15 | 204 | 125506 | 712.35 | 900 | 877 | 175.0 |
| B | 4 | 80 | 55961 | 314.85 | 900 | 877 | 175.0 |
| C | 8 | 128 | 8861 | 37.73 | 897 | 899 | 211.0 |
| C | 14 | 67 | 8102 | 34.13 | 897 | 899 | 211.0 |
| C | 13 | 61 | 6726 | 27.61 | 897 | 899 | 211.0 |
| D | 13 | 152 | 592282 | 2767.99 | 878 | 853 | 213.7 |
| D | 1 | 52 | 406516 | 1898.57 | 878 | 853 | 213.7 |
| D | 10 | 253 | 404506 | 1889.17 | 878 | 853 | 213.7 |
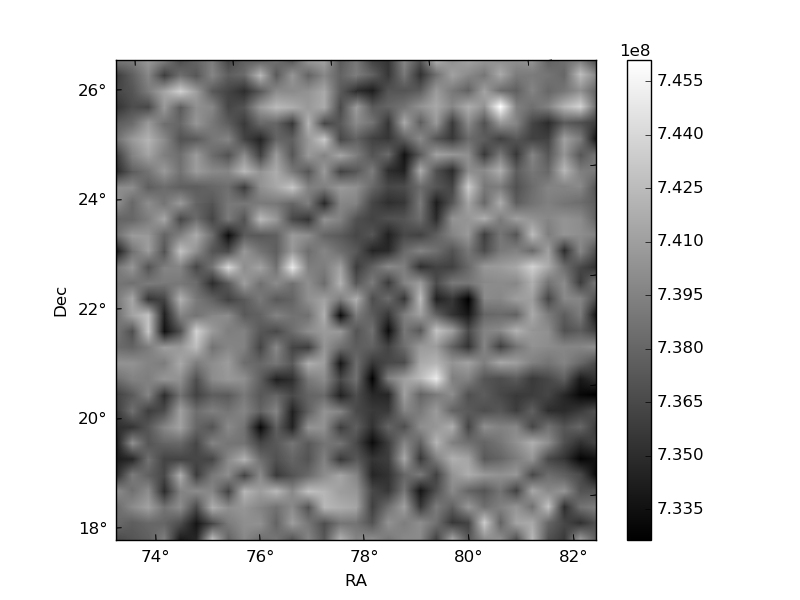
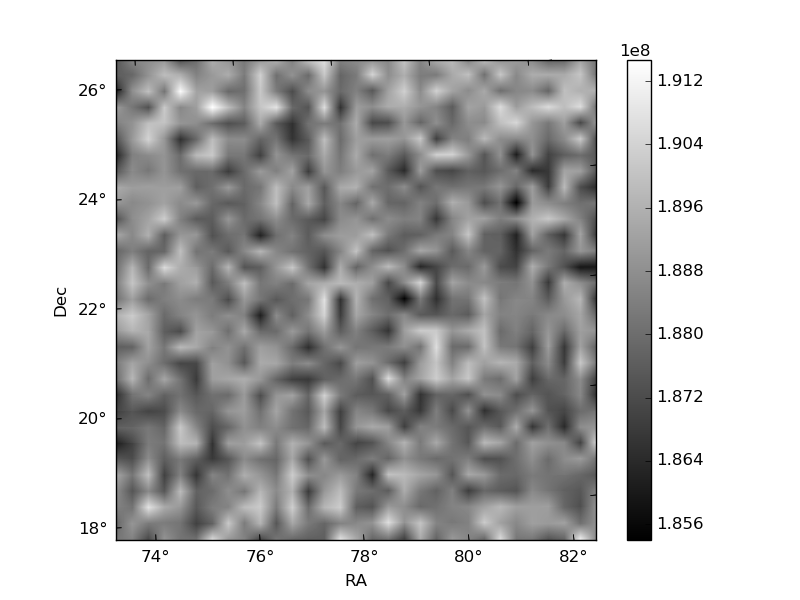
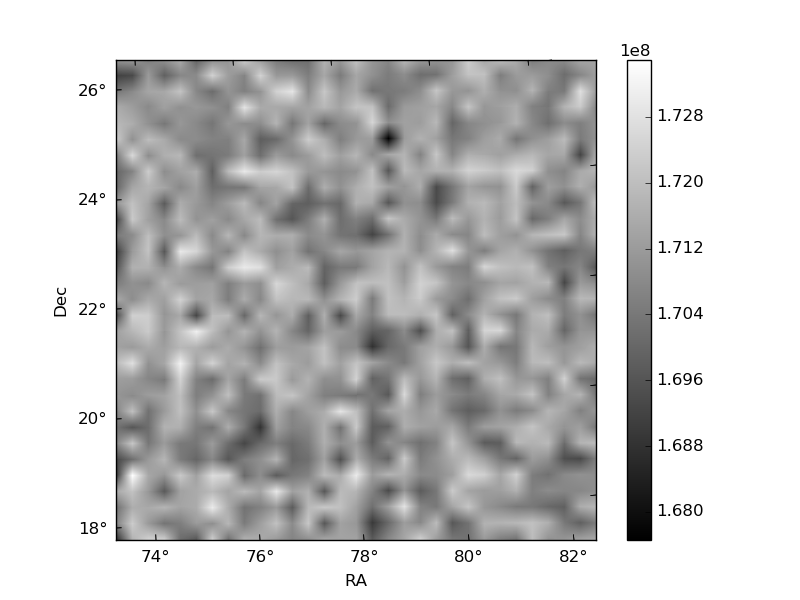
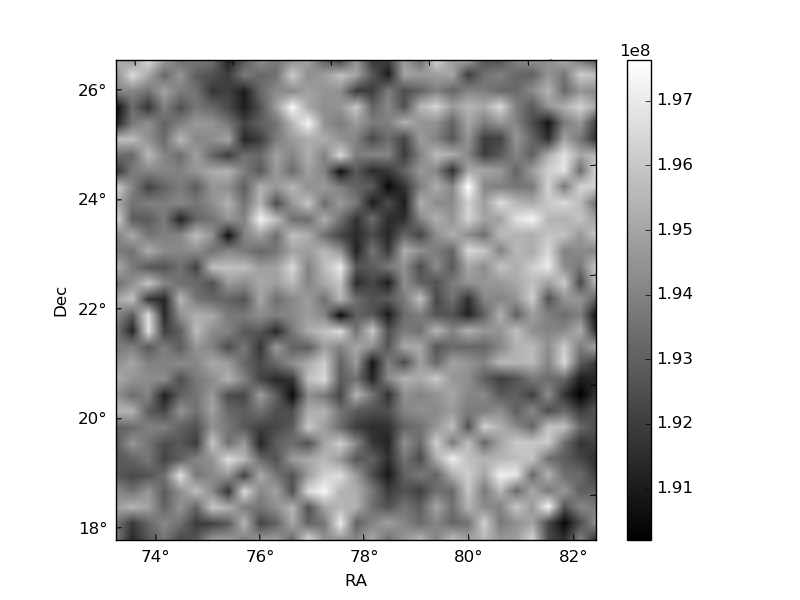
Histogram calculated using DETX and DETY for each event in the final _common_clean file
| Quadrant A | 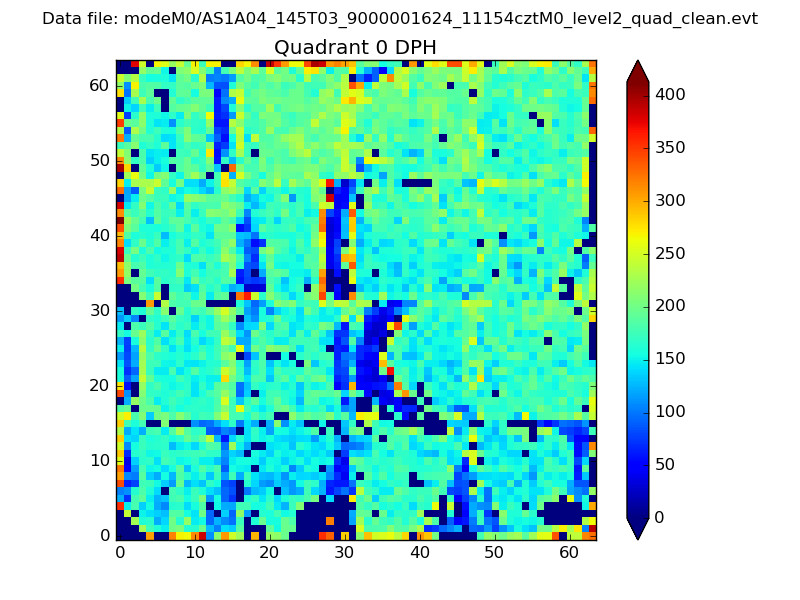 |
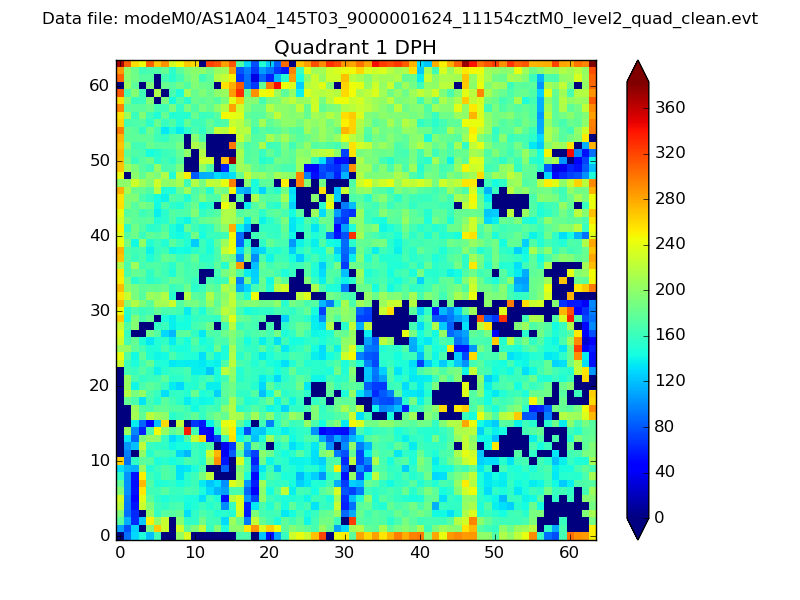 |
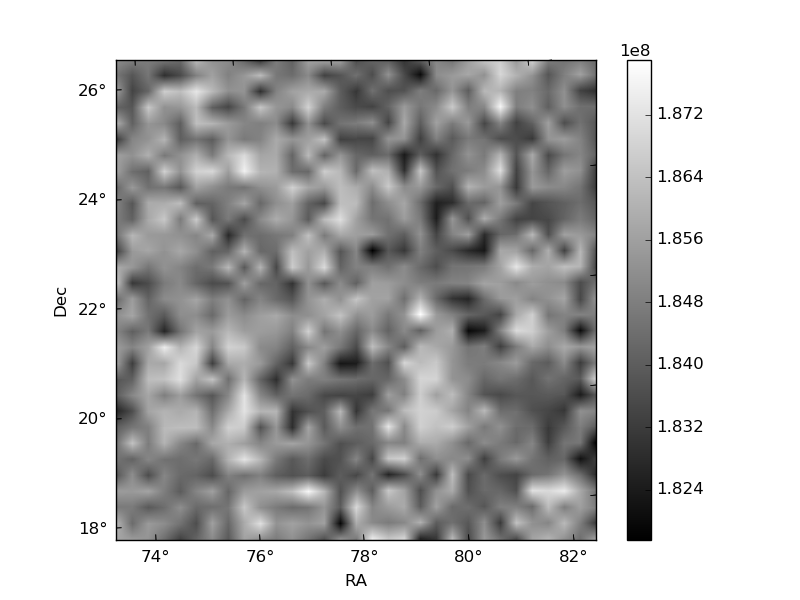
Quadrant B |
|---|---|---|---|
| Quadrant D | 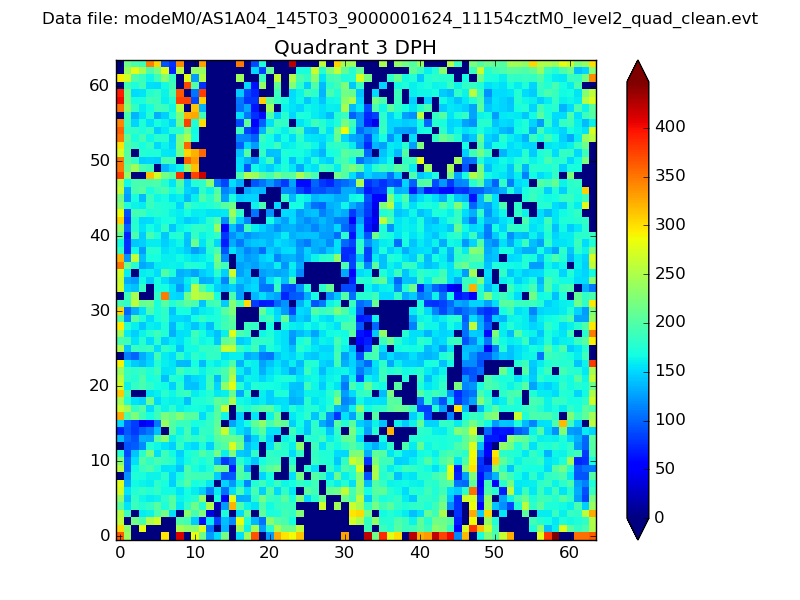 |
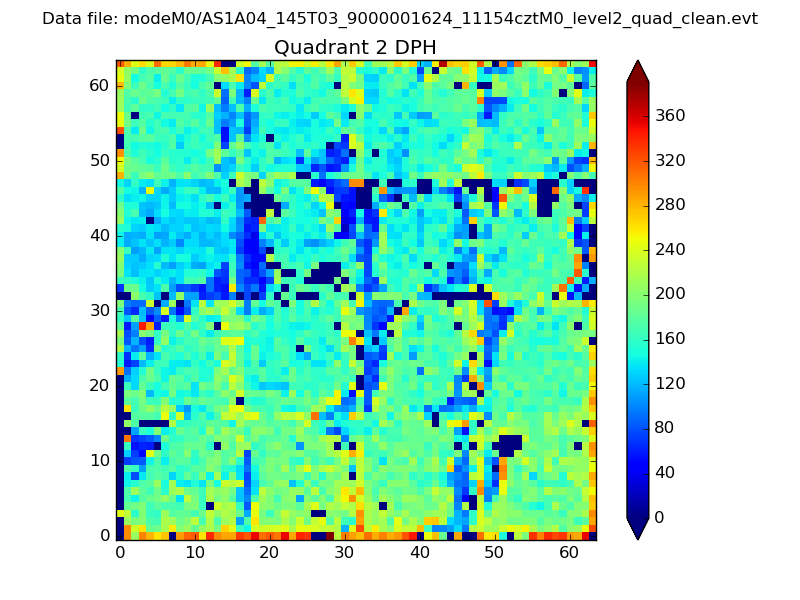 |
Quadrant C |
| Plot type | Count rate plots | Images |
|---|---|---|
| Comparison with Poisson distribution Blue bars denote a histogram of data divided into 1 sec bins. Red curve is a Poisson curve with rate = median count rate of data. |
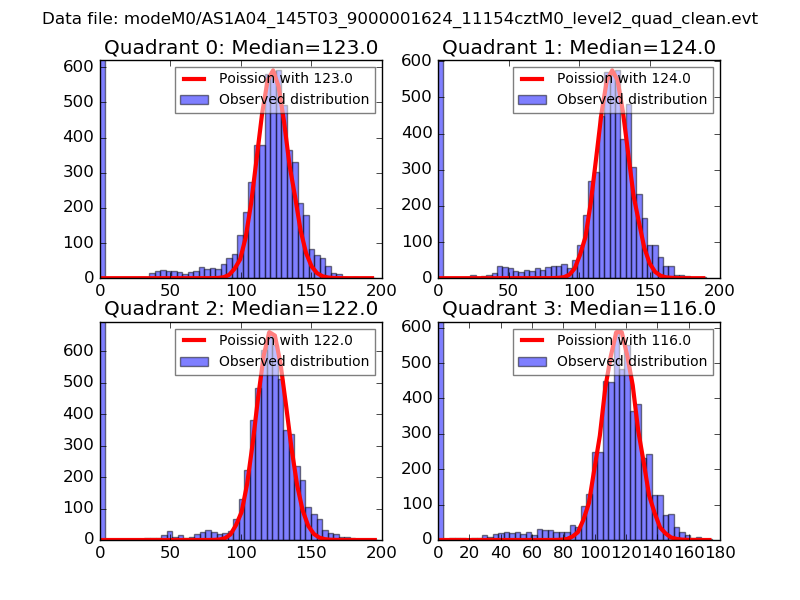 |
 |
| Quadrant-wise count rates Data is divided into 100 sec bins |
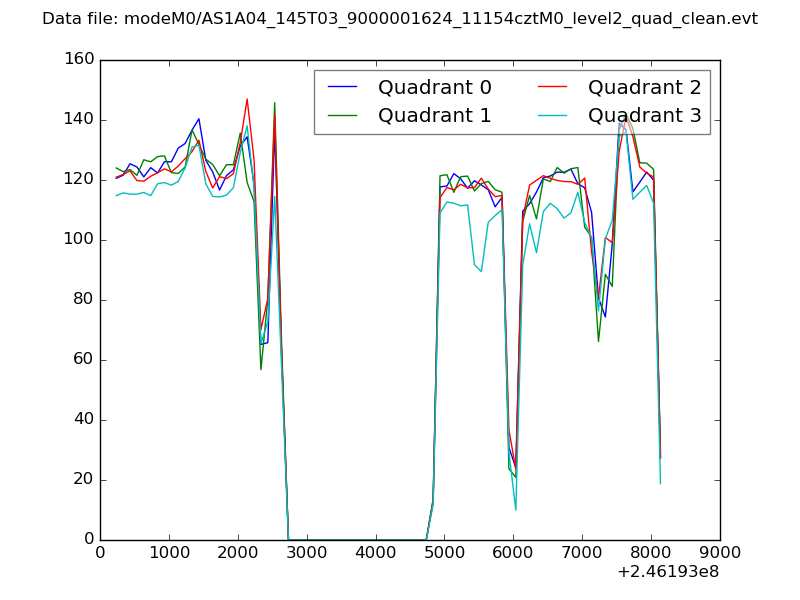 |
|
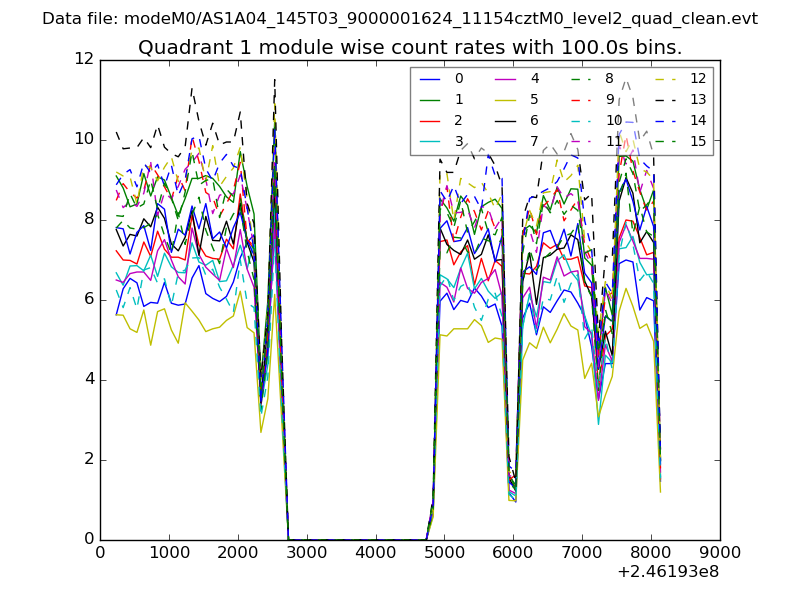
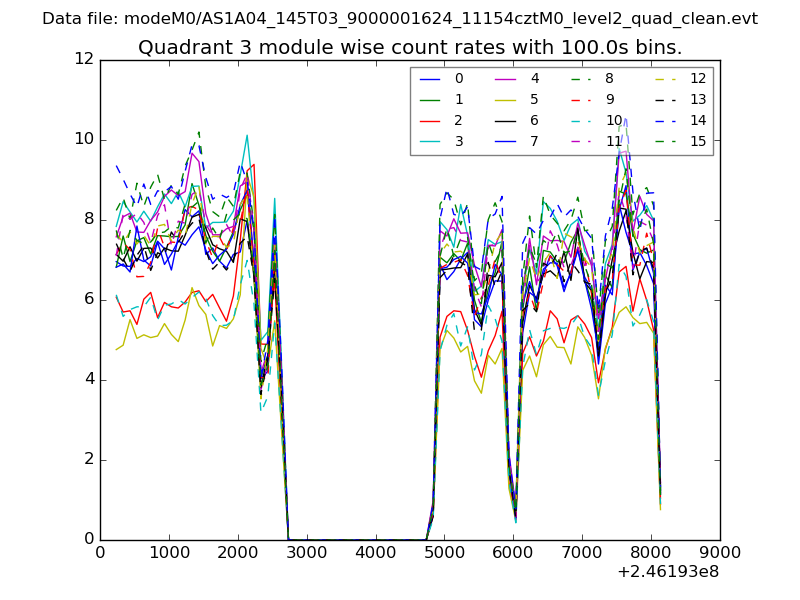
| Module-wise count rates for Quadrant A Data is divided into 100 sec bins |
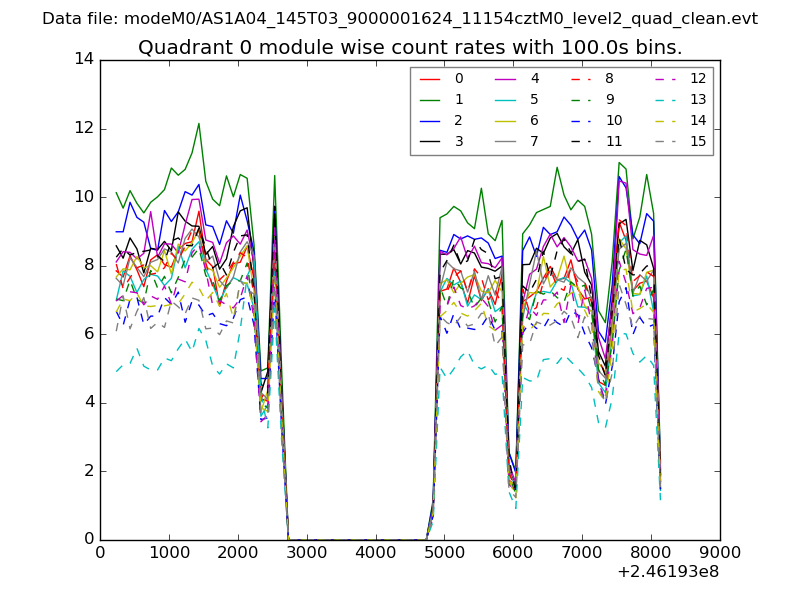 |
 |
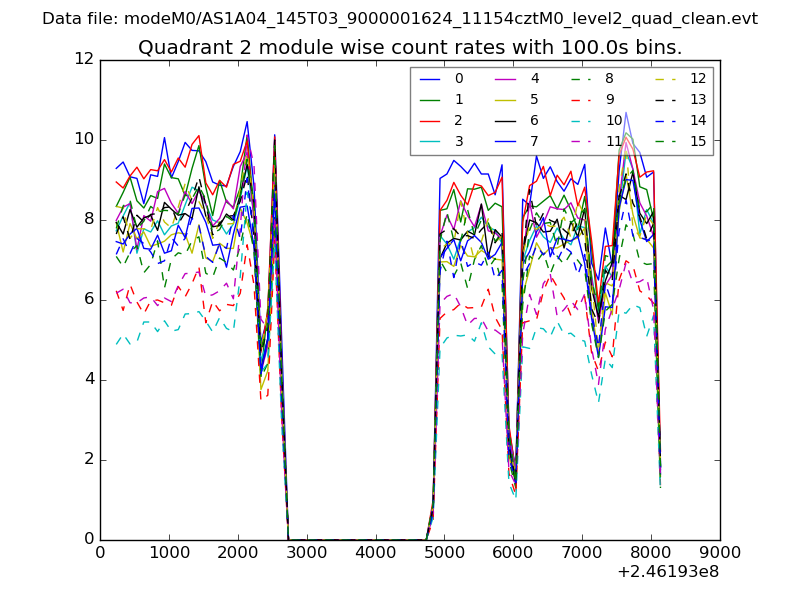
| Module-wise count rates for Quadrant B Data is divided into 100 sec bins |
 |
 |
| Module-wise count rates for Quadrant C Data is divided into 100 sec bins |
 |
 |
| Module-wise count rates for Quadrant D Data is divided into 100 sec bins |
 |
 |
| Parameter | Plot |
|---|---|
| CZT HV Monitor | 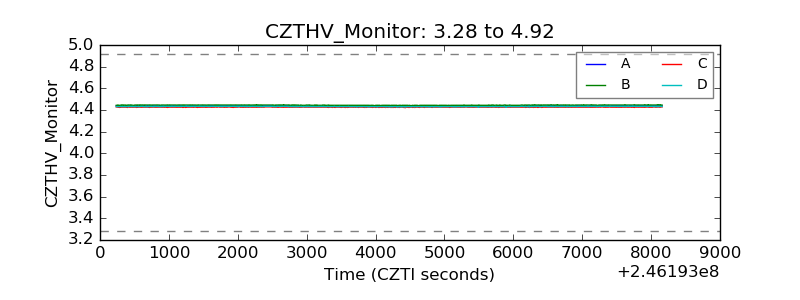 |
| D_VDD | 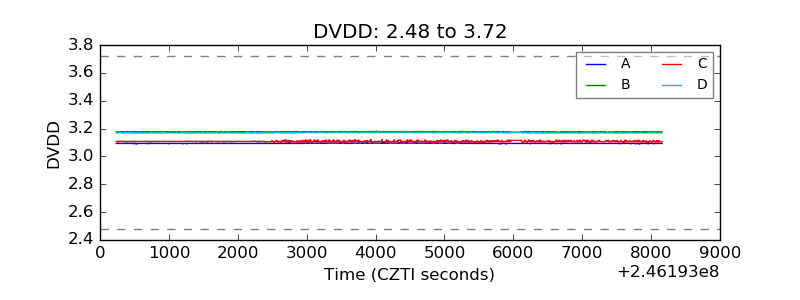 |
| Temperature 1 | 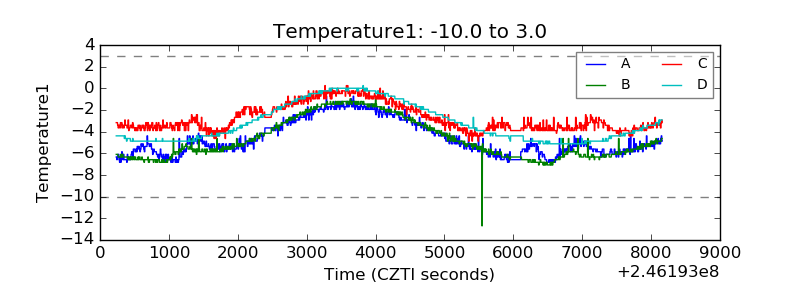 |
| Veto HV Monitor | 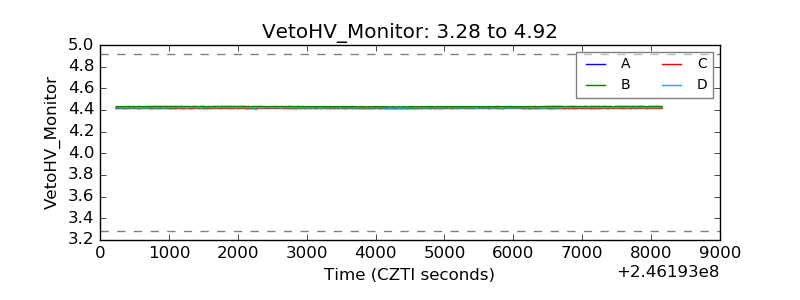 |
| Veto LLD | 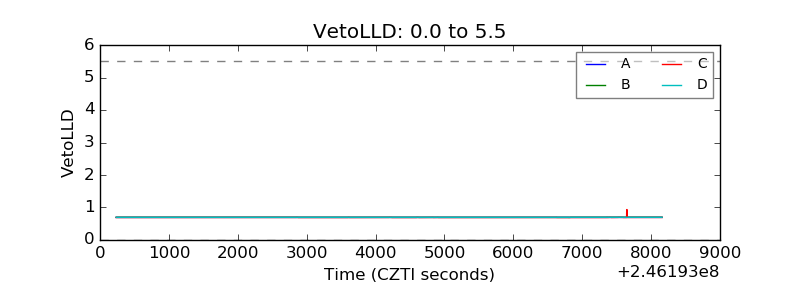 |
| Alpha Counter | 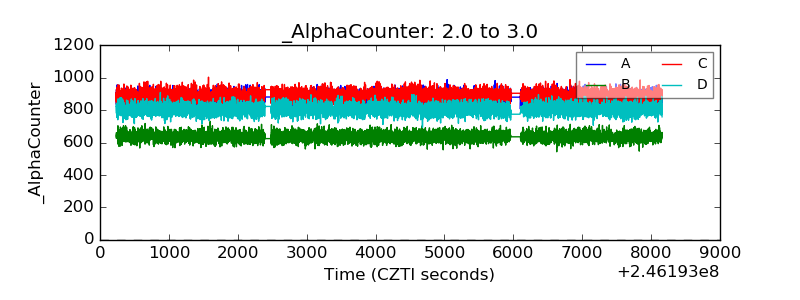 |
| _CPM_Rate | 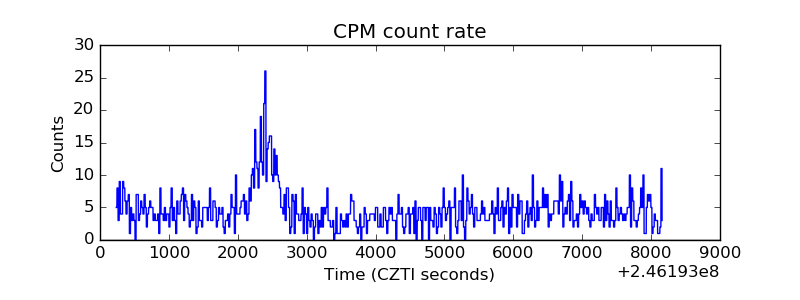 |
| CZT Counter | 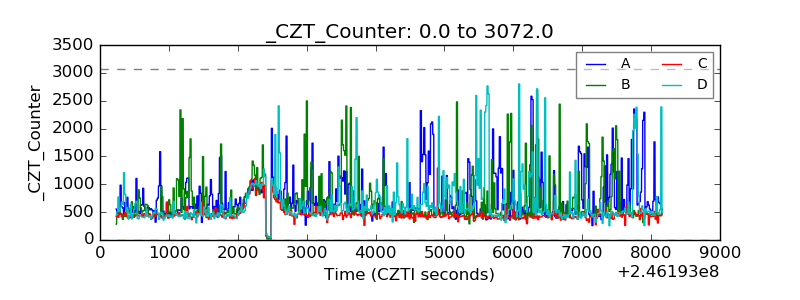 |
| +2.5 Volts monitor | 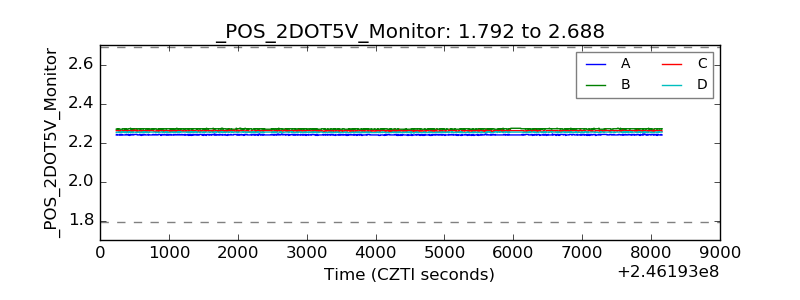 |
| +5 Volts monitor | 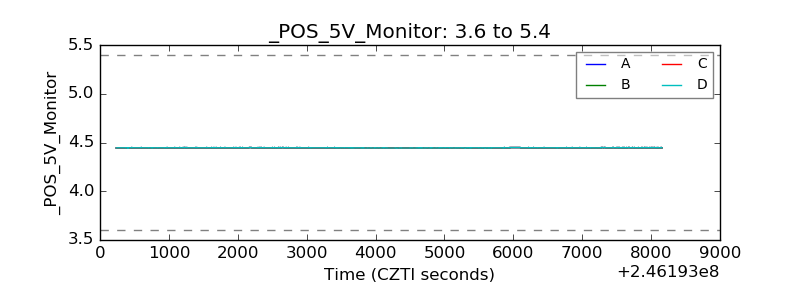 |
| _ROLL_ROT | 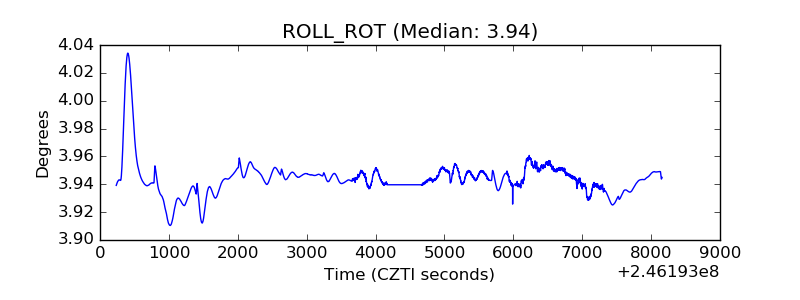 |
| _Roll_DEC | 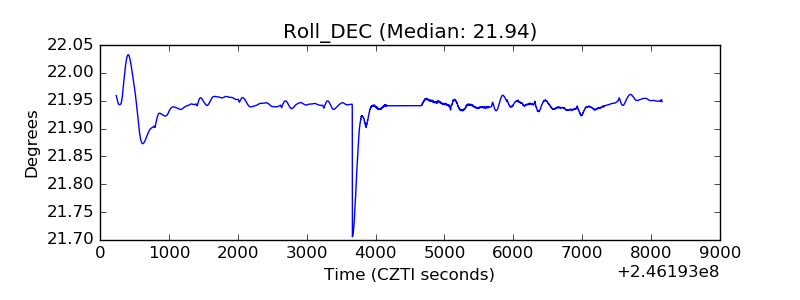 |
| _Roll_RA | 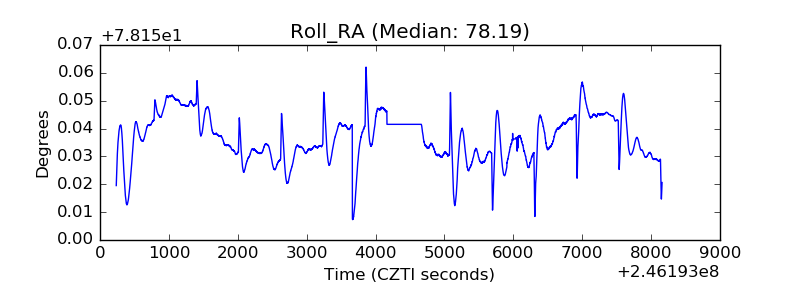 |
| Veto Counter | 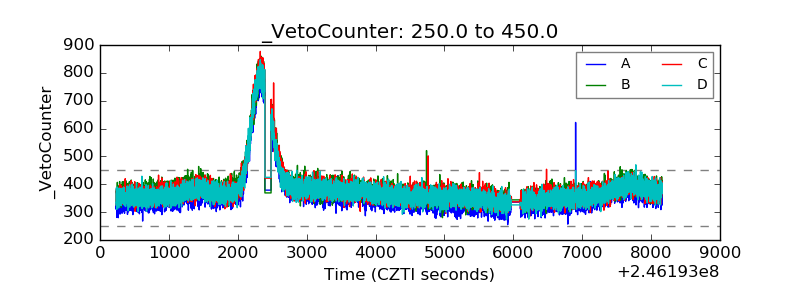 |