| Param | Original file | Final file |
|---|---|---|
| Filename | modeM0/AS1A04_042T01_9000001630cztM0_level2.fits | modeM0/AS1A04_042T01_9000001630cztM0_level2_quad_clean.evt |
| Size (bytes) | 393,552,000 | 350,936,640 |
| Size | 375.3 MB | 334.7 MB |
| Events in quadrant A | 2,269,756 | 1,900,080 |
| Events in quadrant B | 2,280,078 | 2,020,608 |
| Events in quadrant C | 2,374,984 | 2,001,150 |
| Events in quadrant D | 1,970,414 | 1,685,152 |
| Mode SS | |||
|---|---|---|---|
| Quadrant | BADHDUFLAG | Total packets | Discarded packets |
| A | 0 | 896 | 0 |
| B | 0 | 898 | 0 |
| C | 0 | 898 | 0 |
| D | 0 | 898 | 0 |
| Mode M9 | |||
|---|---|---|---|
| Quadrant | BADHDUFLAG | Total packets | Discarded packets |
| A | 0 | 47 | 0 |
| B | 0 | 47 | 0 |
| C | 0 | 47 | 0 |
| D | 0 | 47 | 0 |
| Mode M0 | |||
|---|---|---|---|
| Quadrant | BADHDUFLAG | Total packets | Discarded packets |
| A | 0 | 142084 | 0 |
| B | 0 | 116425 | 0 |
| C | 0 | 90148 | 0 |
| D | 0 | 147499 | 0 |
| Quadrant | Total seconds | Saturated seconds | Saturation percentage |
|---|---|---|---|
| A | 43939 | 4603 | 10.475887% |
| B | 43969 | 2596 | 5.904160% |
| C | 44001 | 312 | 0.709075% |
| D | 43982 | 2645 | 6.013824% |
Noise dominated data is calculated using 1-second bins in cleaned event files. If a bin has >2000 counts, and if more than 50% of those come from <1% of pixels, then it is considered to be noise-dominated and hence unusable.
| Quadrant | # 1 sec bins | Bins with >0 counts | Bins with >2000 counts | High rate bins dominated by noise | Noise dominated (total time) | Noise dominated (detector-on time) | Marked lightcurve |
|---|---|---|---|---|---|---|---|
| A | 49127 | 43926 | 0 | 0 | 0.00% | 0.00% | 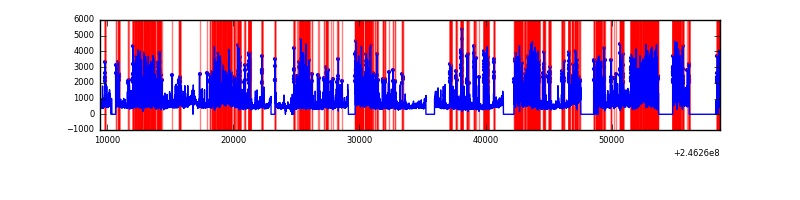 |
| B | 49127 | 44010 | 0 | 0 | 0.00% | 0.00% | 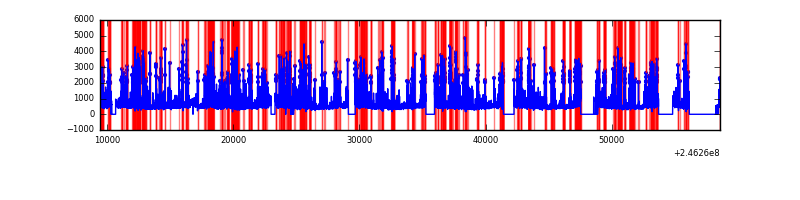 |
| C | 49127 | 44039 | 0 | 0 | 0.00% | 0.00% | 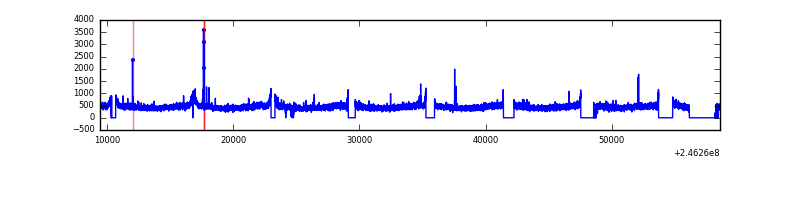 |
| D | 49127 | 44026 | 0 | 0 | 0.00% | 0.00% | 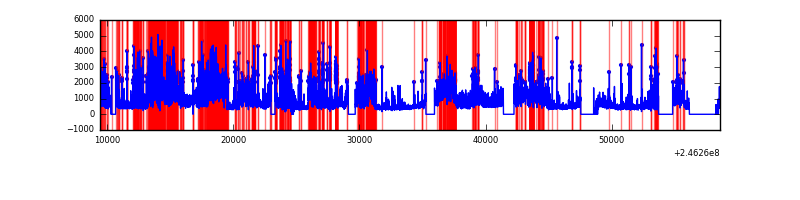 |
Top three noisy pixels from each quadrant. If the there are fewer than three noisy pixels in the level2.evt file, extra rows are filled as -1
| Pixel properties | Quadrant properties | ||||||
|---|---|---|---|---|---|---|---|
| Quadrant | DetID | PixID | Counts | Sigma | Mean | Median | Sigma |
| A | 14 | 188 | 2297 | 11.5 | 589 | 548 | 152.0 |
| A | 0 | 29 | 2195 | 10.83 | 589 | 548 | 152.0 |
| A | 14 | 204 | 1939 | 9.15 | 589 | 548 | 152.0 |
| B | 2 | 9 | 2100 | 12.39 | 601 | 570 | 123.5 |
| B | 3 | 17 | 1574 | 8.13 | 601 | 570 | 123.5 |
| B | 5 | 225 | 1534 | 7.81 | 601 | 570 | 123.5 |
| C | 12 | 241 | 1703 | 6.77 | 627 | 580 | 165.8 |
| C | 9 | 233 | 1602 | 6.16 | 627 | 580 | 165.8 |
| C | 2 | 191 | 1585 | 6.06 | 627 | 580 | 165.8 |
| D | 3 | 14 | 1591 | 7.07 | 562 | 509 | 153.0 |
| D | 3 | 31 | 1441 | 6.09 | 562 | 509 | 153.0 |
| D | 6 | 231 | 1430 | 6.02 | 562 | 509 | 153.0 |
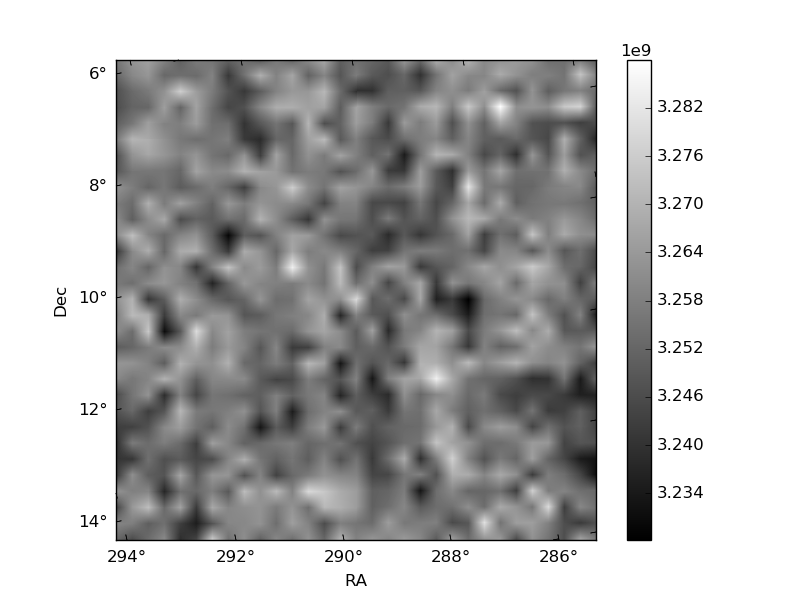
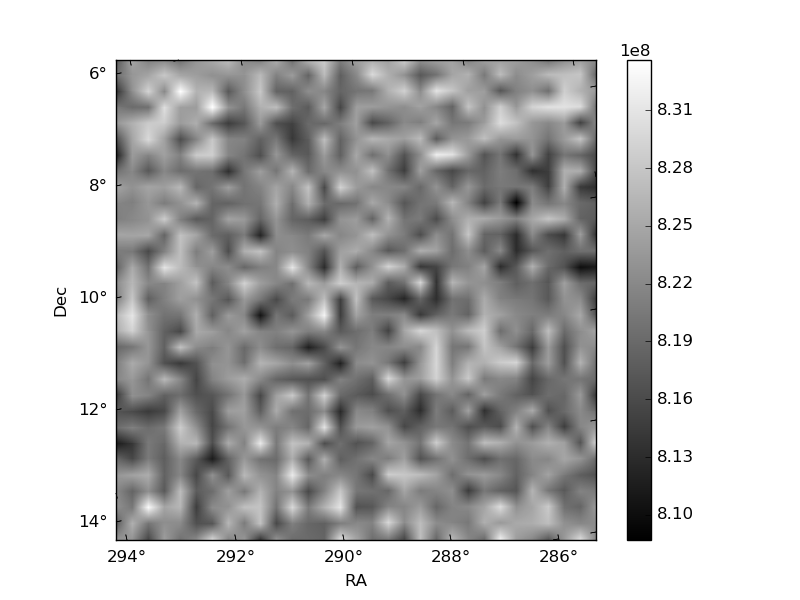
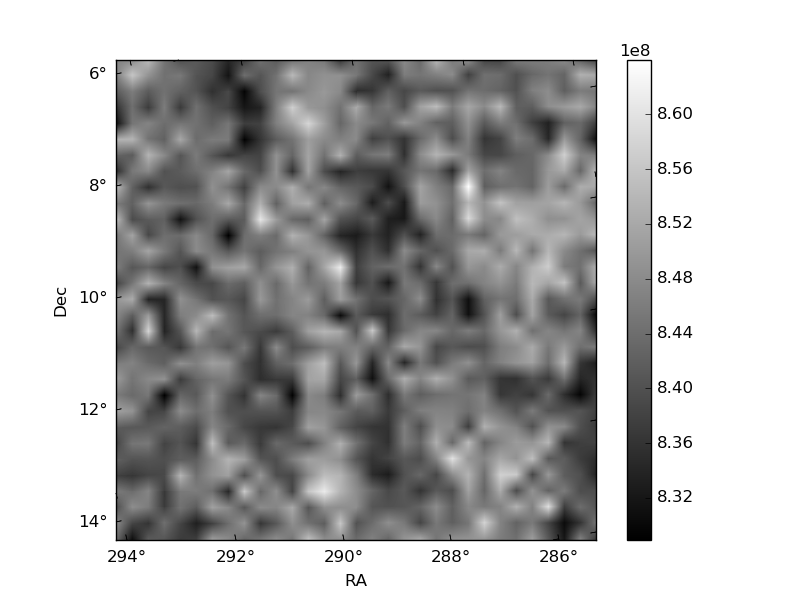
Histogram calculated using DETX and DETY for each event in the final _common_clean file
| Quadrant A | 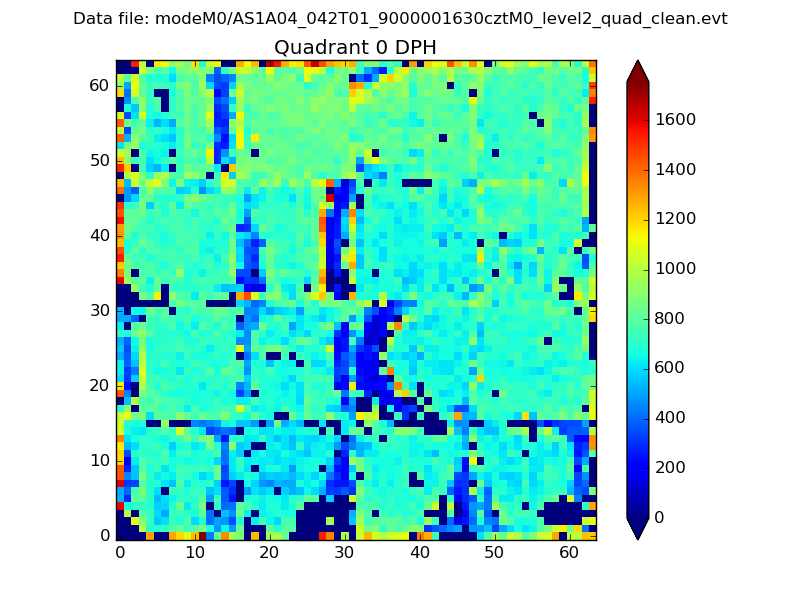 |
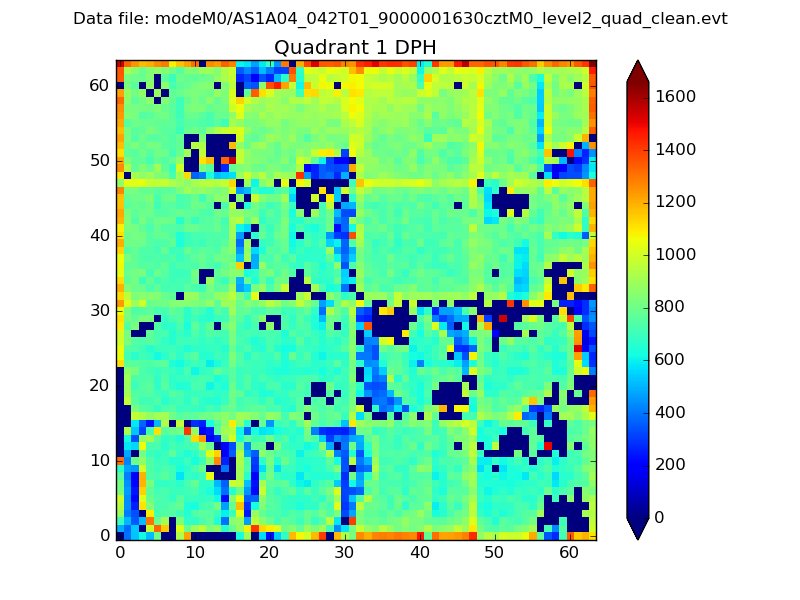 |
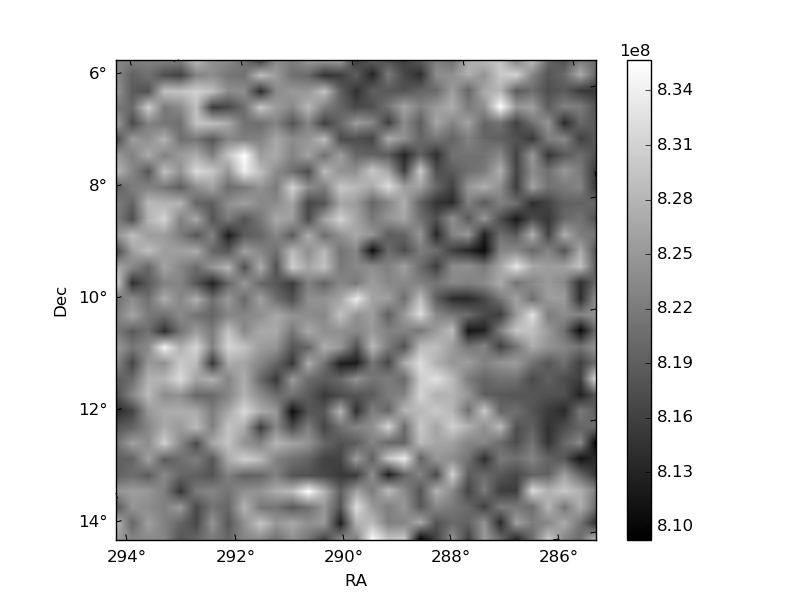
Quadrant B |
|---|---|---|---|
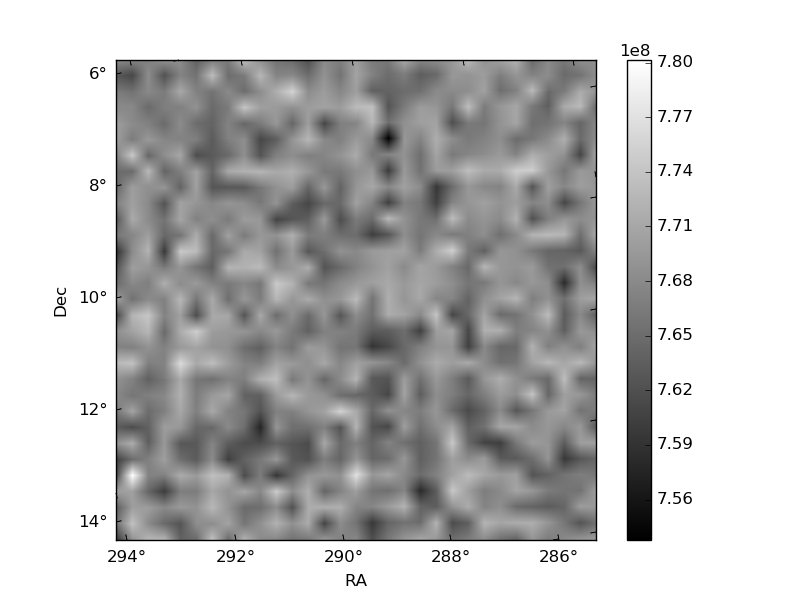
| Quadrant D | 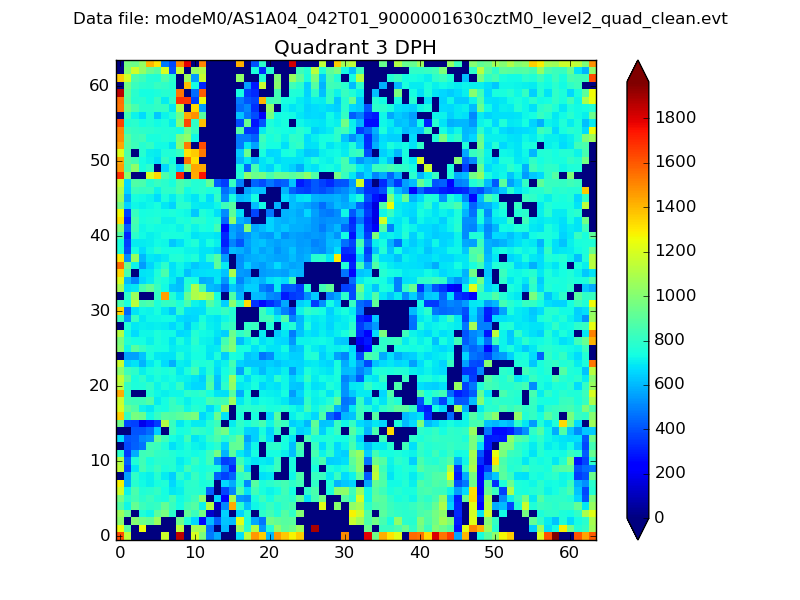 |
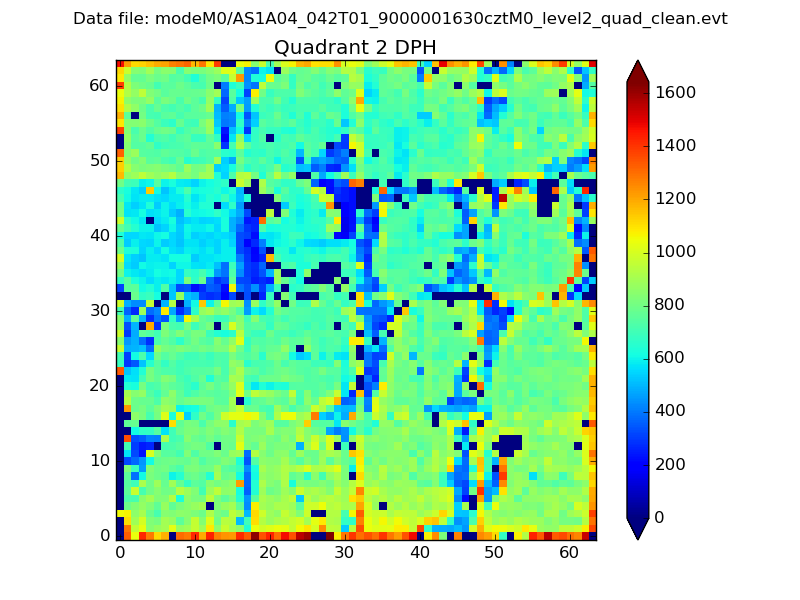 |
Quadrant C |
| Plot type | Count rate plots | Images |
|---|---|---|
| Comparison with Poisson distribution Blue bars denote a histogram of data divided into 1 sec bins. Red curve is a Poisson curve with rate = median count rate of data. |
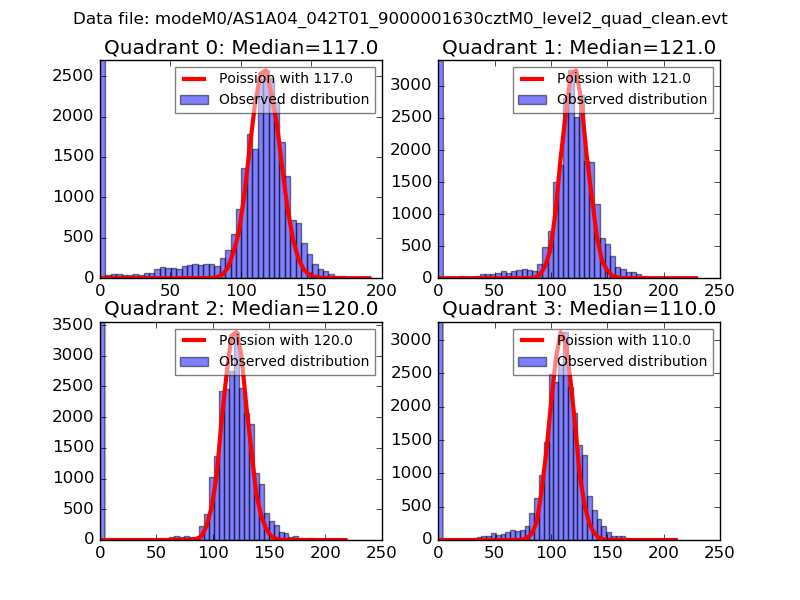 |
 |
| Quadrant-wise count rates Data is divided into 100 sec bins |
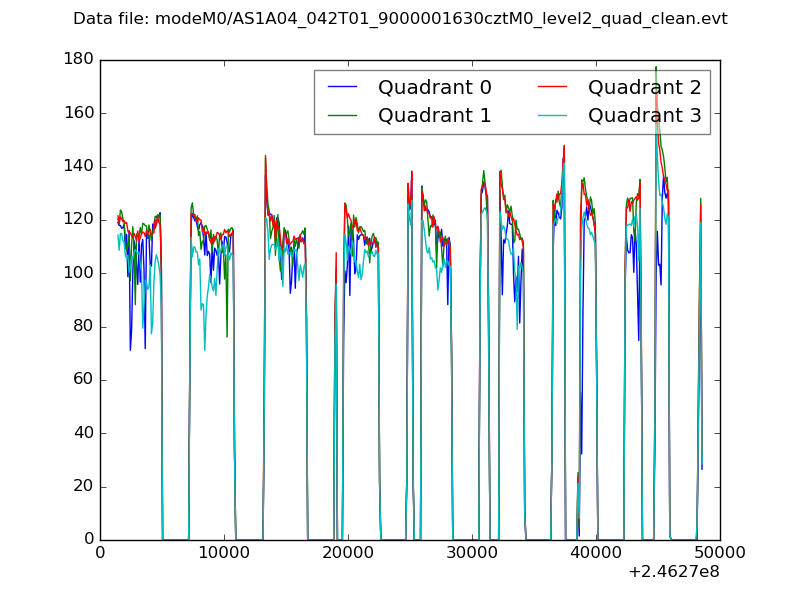 |
|
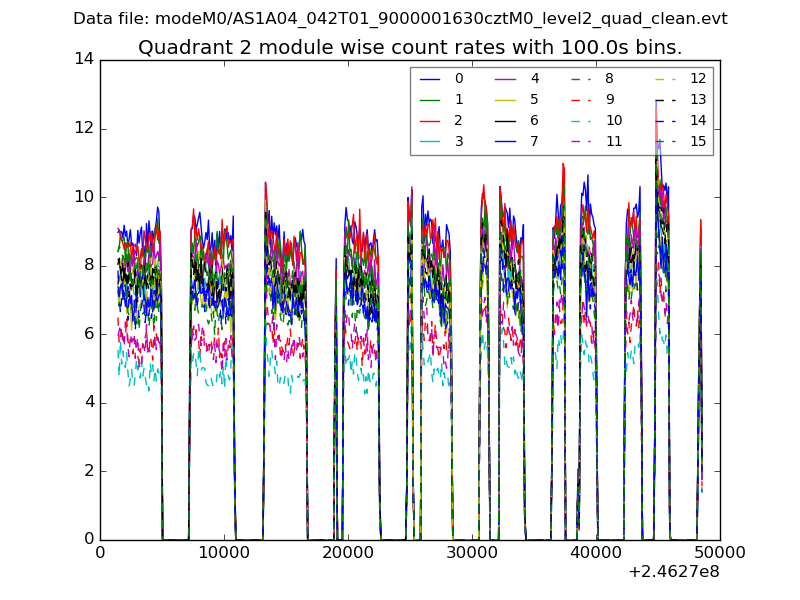
| Module-wise count rates for Quadrant A Data is divided into 100 sec bins |
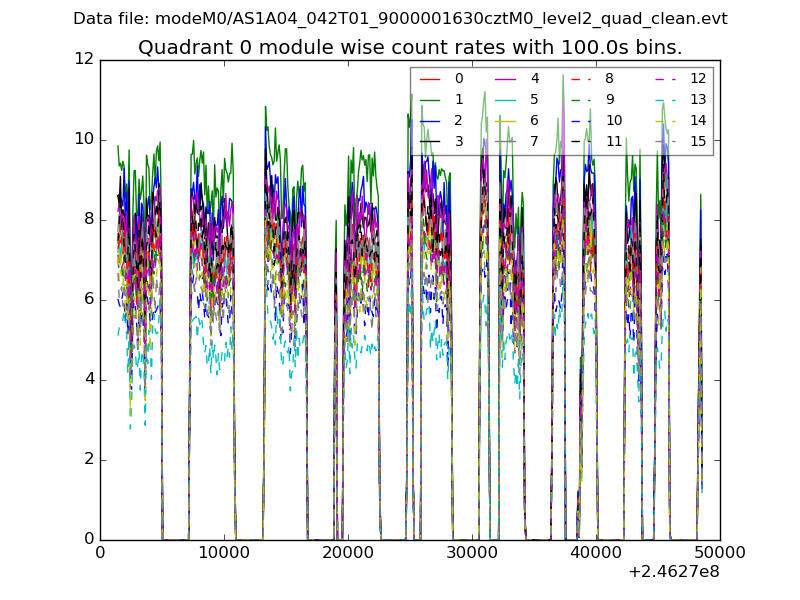 |
 |
| Module-wise count rates for Quadrant B Data is divided into 100 sec bins |
 |
 |
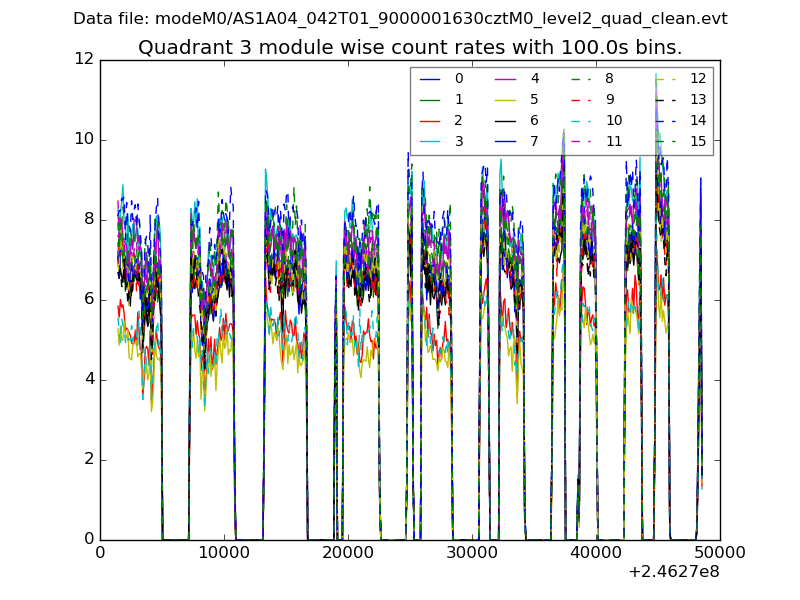
| Module-wise count rates for Quadrant C Data is divided into 100 sec bins |
 |
 |
| Module-wise count rates for Quadrant D Data is divided into 100 sec bins |
 |
 |
| Parameter | Plot |
|---|---|
| CZT HV Monitor | 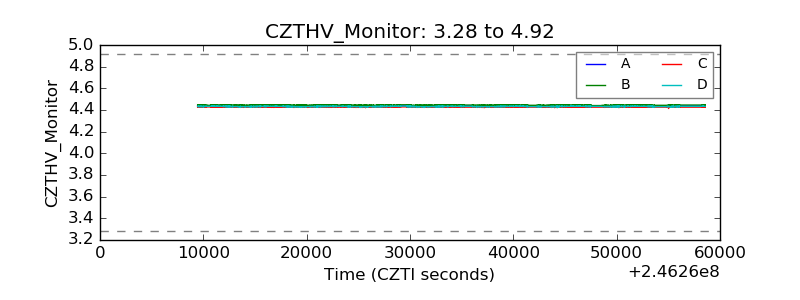 |
| D_VDD | 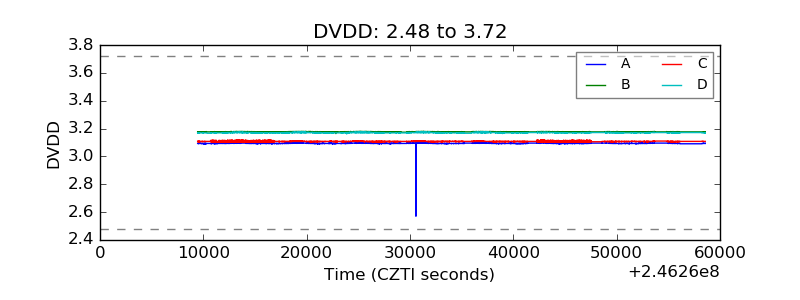 |
| Temperature 1 | 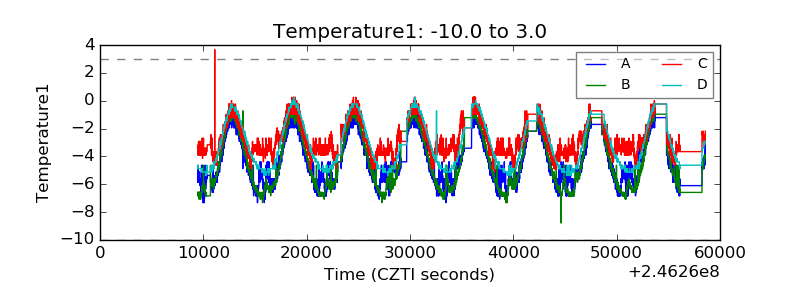 |
| Veto HV Monitor | 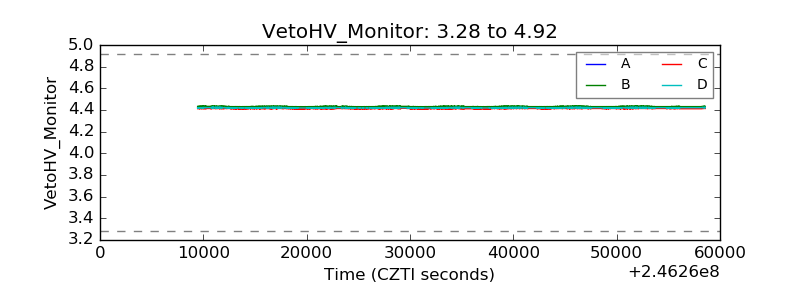 |
| Veto LLD | 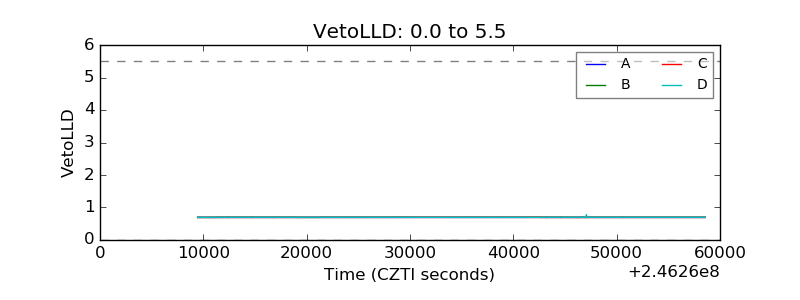 |
| Alpha Counter | 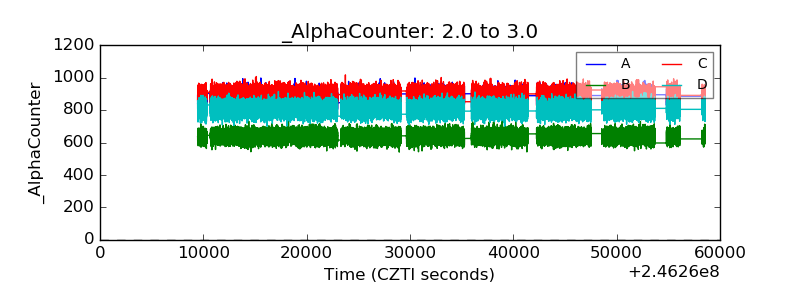 |
| _CPM_Rate | 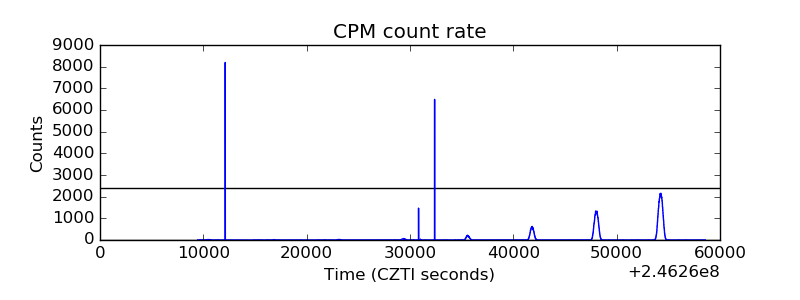 |
| CZT Counter | 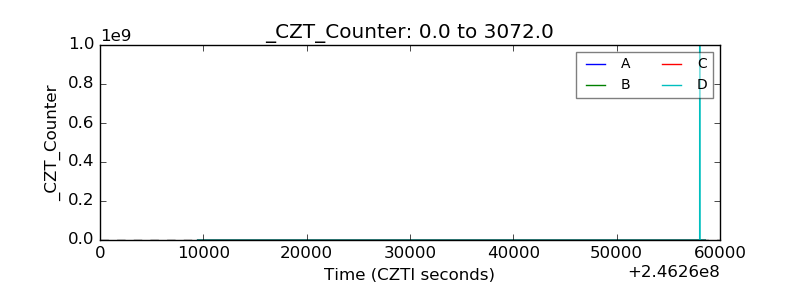 |
| +2.5 Volts monitor |  |
| +5 Volts monitor |  |
| _ROLL_ROT | 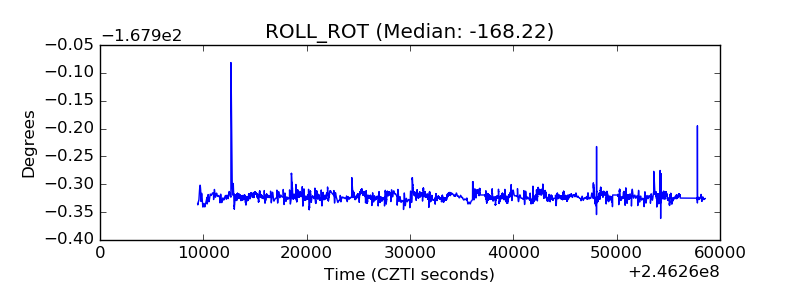 |
| _Roll_DEC | 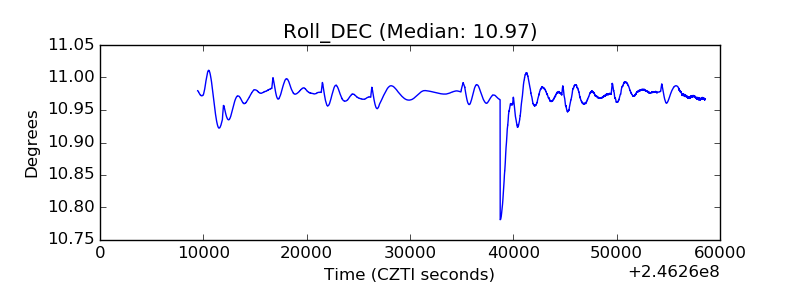 |
| _Roll_RA | 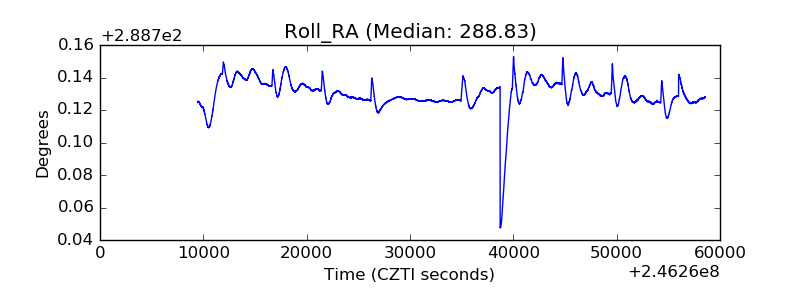 |
| Veto Counter | 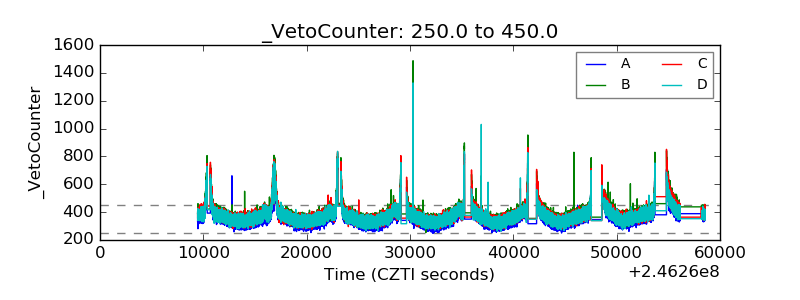 |