| Param | Original file | Final file |
|---|---|---|
| Filename | modeM0/AS1A04_042T01_9000001630_11163cztM0_level2.evt | modeM0/AS1A04_042T01_9000001630_11163cztM0_level2_quad_clean.evt |
| Size (bytes) | 216,146,880 | 17,847,360 |
| Size | 206.1 MB | 17.0 MB |
| Events in quadrant A | 1,652,777 | 91,294 |
| Events in quadrant B | 1,796,439 | 92,926 |
| Events in quadrant C | 1,218,874 | 93,709 |
| Events in quadrant D | 1,711,076 | 87,226 |
| Mode SS | |||
|---|---|---|---|
| Quadrant | BADHDUFLAG | Total packets | Discarded packets |
| A | 0 | 52 | 0 |
| B | 0 | 52 | 0 |
| C | 0 | 52 | 0 |
| D | 0 | 52 | 0 |
| Mode M9 | |||
|---|---|---|---|
| Quadrant | BADHDUFLAG | Total packets | Discarded packets |
| A | 0 | 3 | 0 |
| B | 0 | 3 | 0 |
| C | 0 | 3 | 0 |
| D | 0 | 3 | 0 |
| Mode M0 | |||
|---|---|---|---|
| Quadrant | BADHDUFLAG | Total packets | Discarded packets |
| A | 0 | 6461 | 2 |
| B | 0 | 6915 | 1 |
| C | 0 | 5155 | 1 |
| D | 0 | 6678 | 1 |
| Quadrant | Total seconds | Saturated seconds | Saturation percentage |
|---|---|---|---|
| A | 2421 | 192 | 7.930607% |
| B | 2421 | 300 | 12.391574% |
| C | 2421 | 60 | 2.478315% |
| D | 2421 | 146 | 6.030566% |
Noise dominated data is calculated using 1-second bins in cleaned event files. If a bin has >2000 counts, and if more than 50% of those come from <1% of pixels, then it is considered to be noise-dominated and hence unusable.
| Quadrant | # 1 sec bins | Bins with >0 counts | Bins with >2000 counts | High rate bins dominated by noise | Noise dominated (total time) | Noise dominated (detector-on time) | Marked lightcurve |
|---|---|---|---|---|---|---|---|
| A | 2781 | 2422 | 30 | 30 | 1.08% | 1.24% | 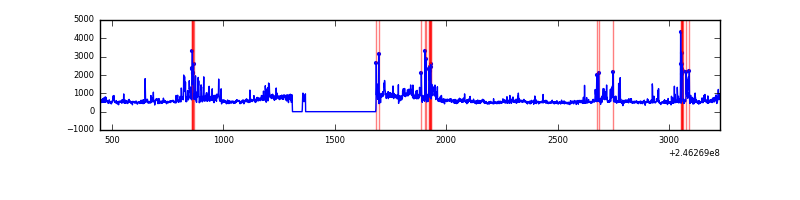 |
| B | 2781 | 2423 | 78 | 78 | 2.80% | 3.22% | 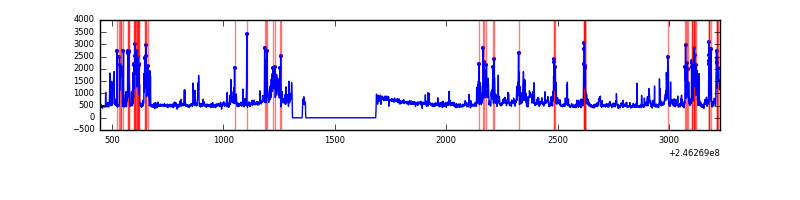 |
| C | 2781 | 2423 | 1 | 1 | 0.04% | 0.04% | 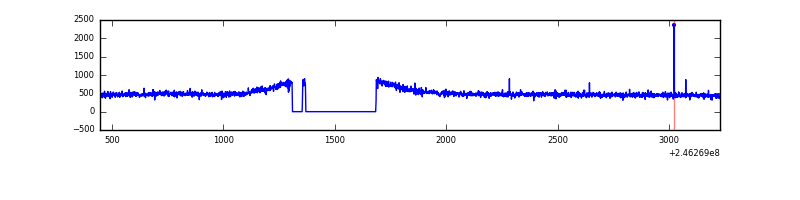 |
| D | 2781 | 2422 | 45 | 45 | 1.62% | 1.86% | 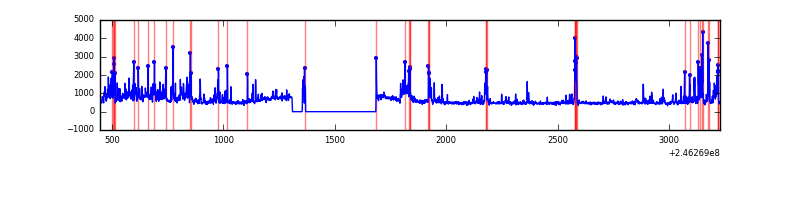 |
Top three noisy pixels from each quadrant. If the there are fewer than three noisy pixels in the level2.evt file, extra rows are filled as -1
| Pixel properties | Quadrant properties | ||||||
|---|---|---|---|---|---|---|---|
| Quadrant | DetID | PixID | Counts | Sigma | Mean | Median | Sigma |
| A | 14 | 238 | 202303 | 3027.36 | 314 | 306 | 66.7 |
| A | 8 | 15 | 125335 | 1873.83 | 314 | 306 | 66.7 |
| A | 8 | 5 | 101823 | 1521.45 | 314 | 306 | 66.7 |
| B | 4 | 239 | 488838 | 7711.74 | 310 | 302 | 63.3 |
| B | 10 | 16 | 42373 | 664.11 | 310 | 302 | 63.3 |
| B | 11 | 51 | 10444 | 160.1 | 310 | 302 | 63.3 |
| C | 8 | 128 | 4642 | 58.44 | 309 | 309 | 74.1 |
| C | 14 | 234 | 2858 | 34.38 | 309 | 309 | 74.1 |
| C | 13 | 61 | 2294 | 26.77 | 309 | 309 | 74.1 |
| D | 12 | 16 | 365440 | 4764.09 | 306 | 296 | 76.6 |
| D | 10 | 157 | 115437 | 1502.26 | 306 | 296 | 76.6 |
| D | 1 | 52 | 24561 | 316.59 | 306 | 296 | 76.6 |
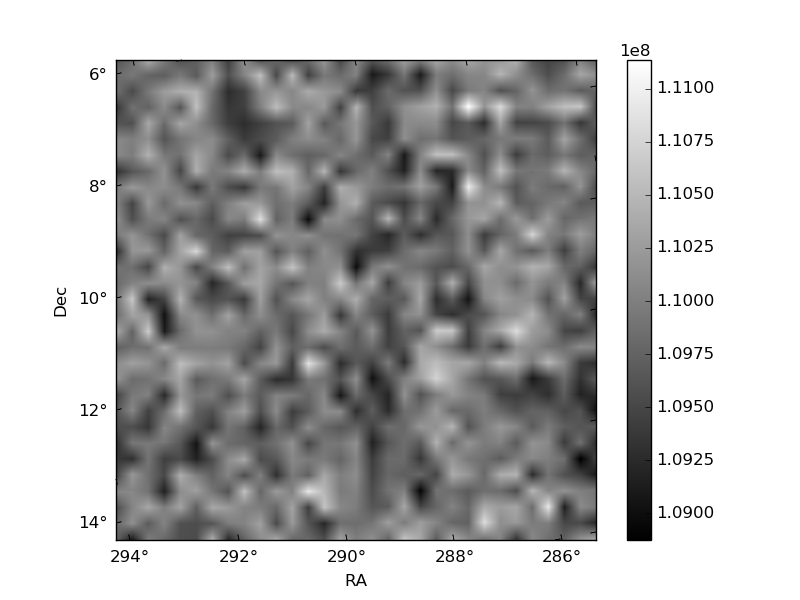
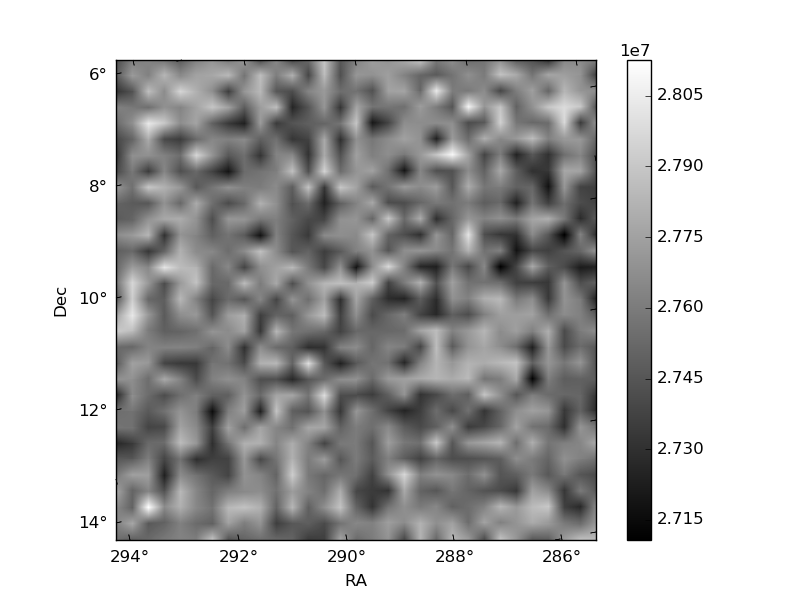
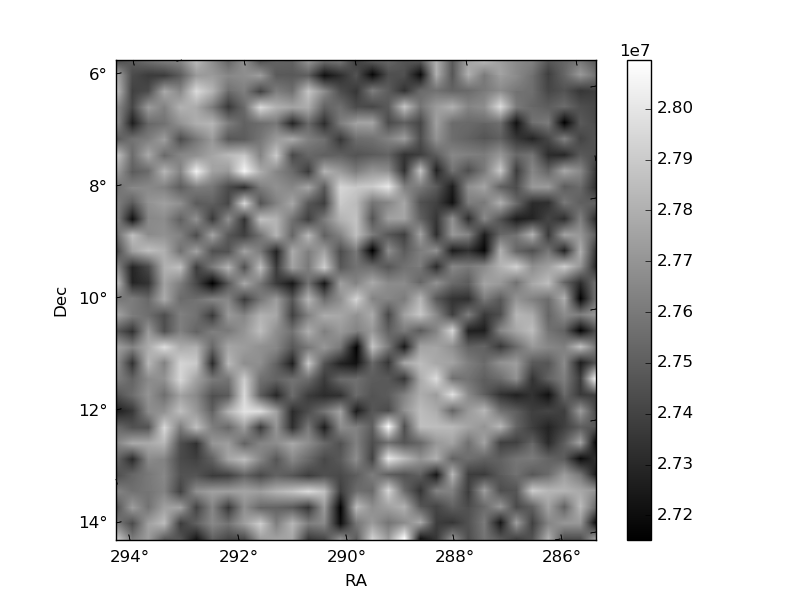
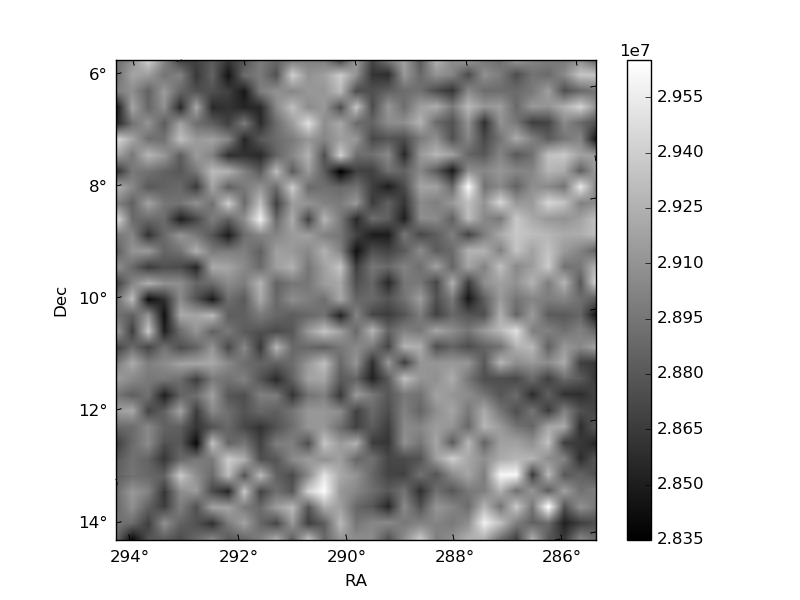
Histogram calculated using DETX and DETY for each event in the final _common_clean file
| Quadrant A | 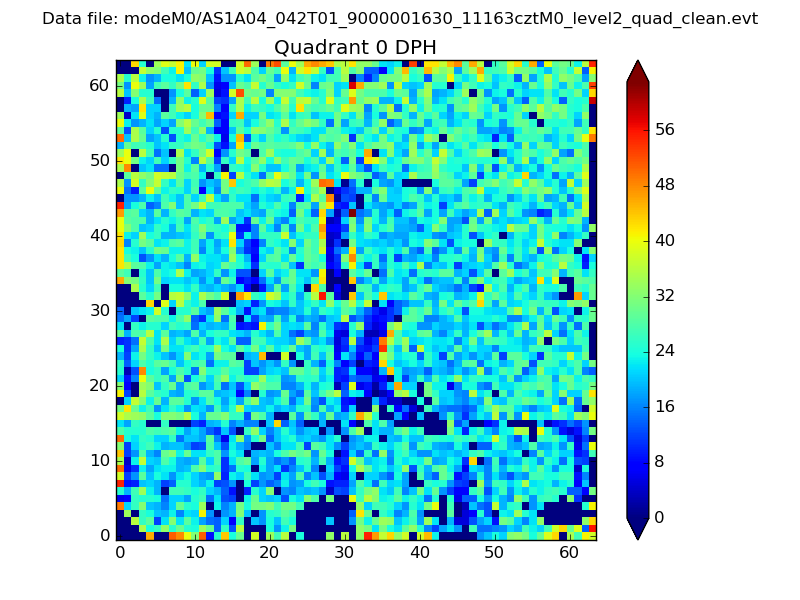 |
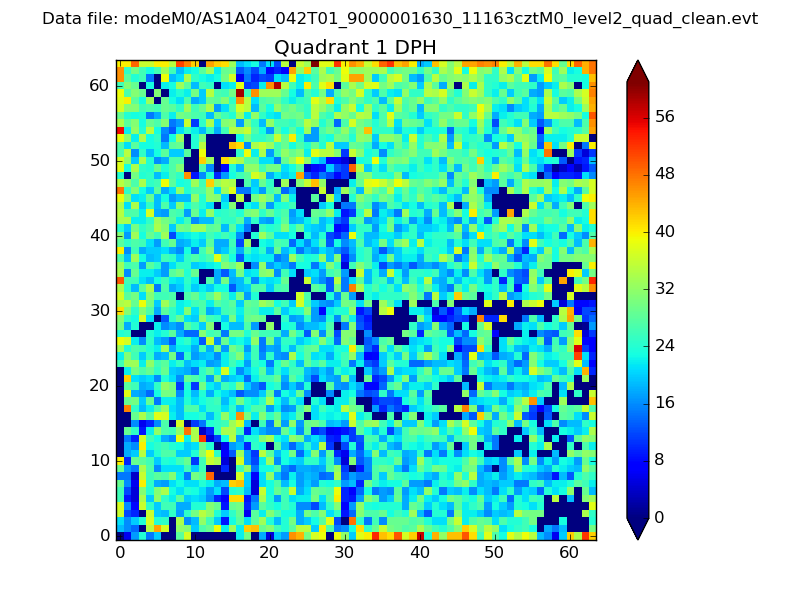 |
Quadrant B |
|---|---|---|---|
| Quadrant D | 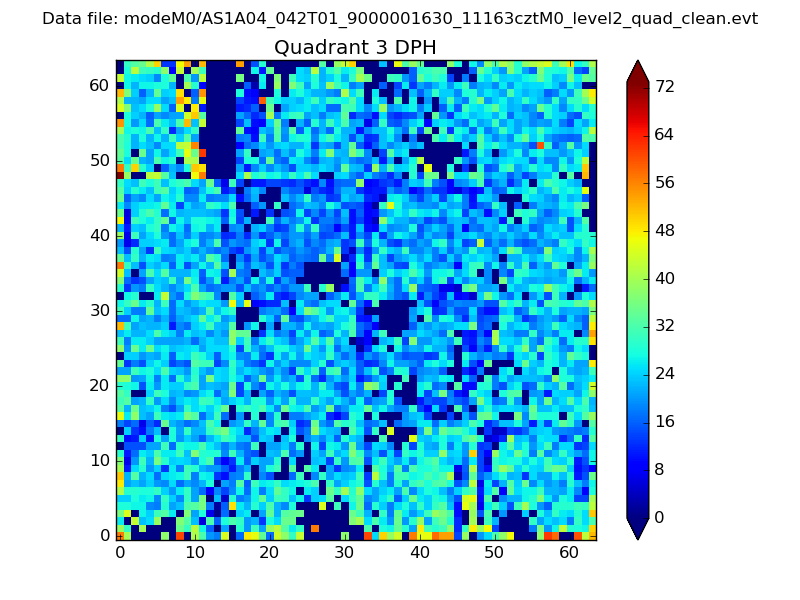 |
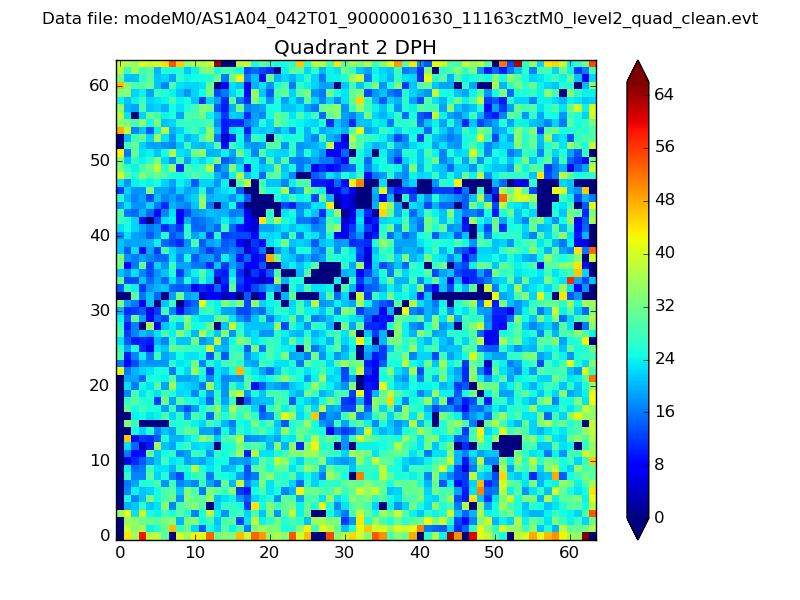 |
Quadrant C |
| Plot type | Count rate plots | Images |
|---|---|---|
| Comparison with Poisson distribution Blue bars denote a histogram of data divided into 1 sec bins. Red curve is a Poisson curve with rate = median count rate of data. |
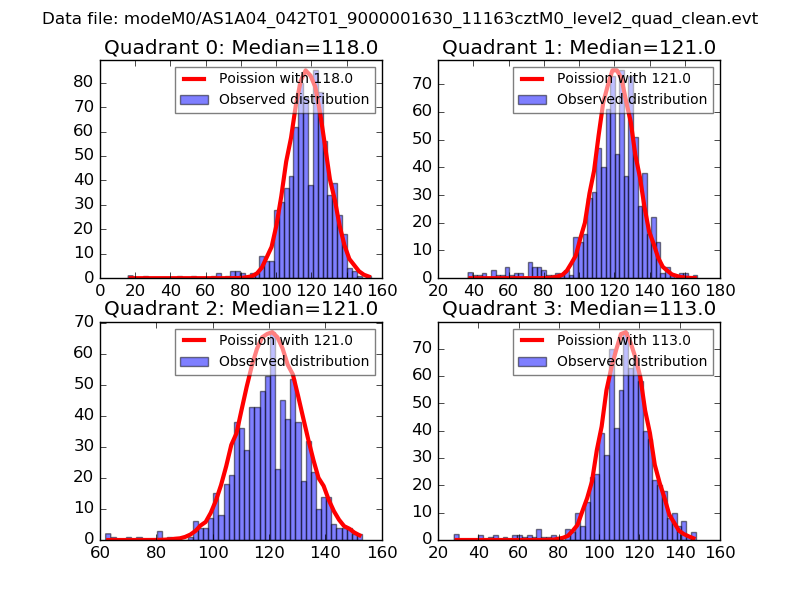 |
 |
| Quadrant-wise count rates Data is divided into 100 sec bins |
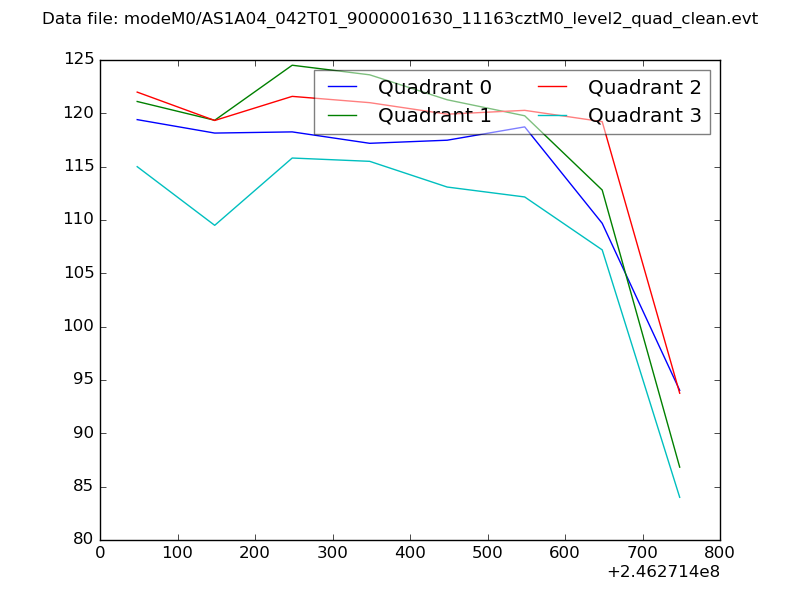 |
|
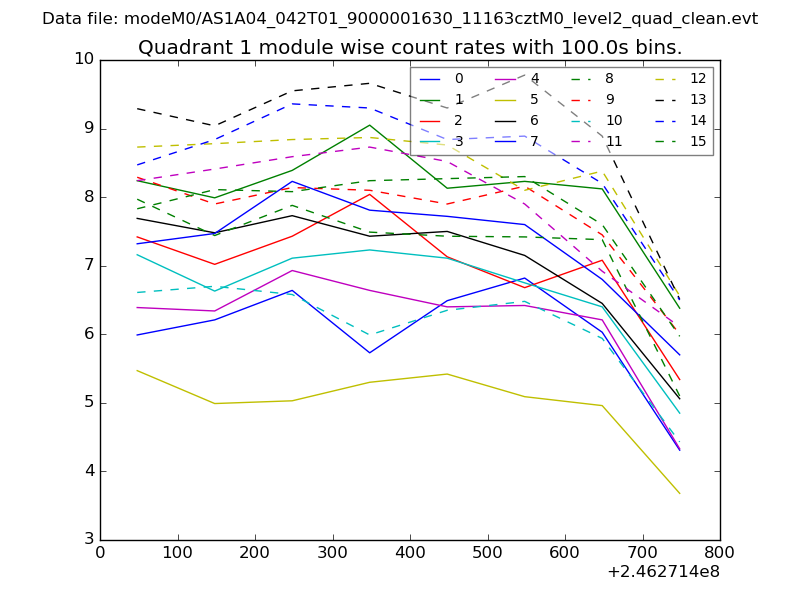
| Module-wise count rates for Quadrant A Data is divided into 100 sec bins |
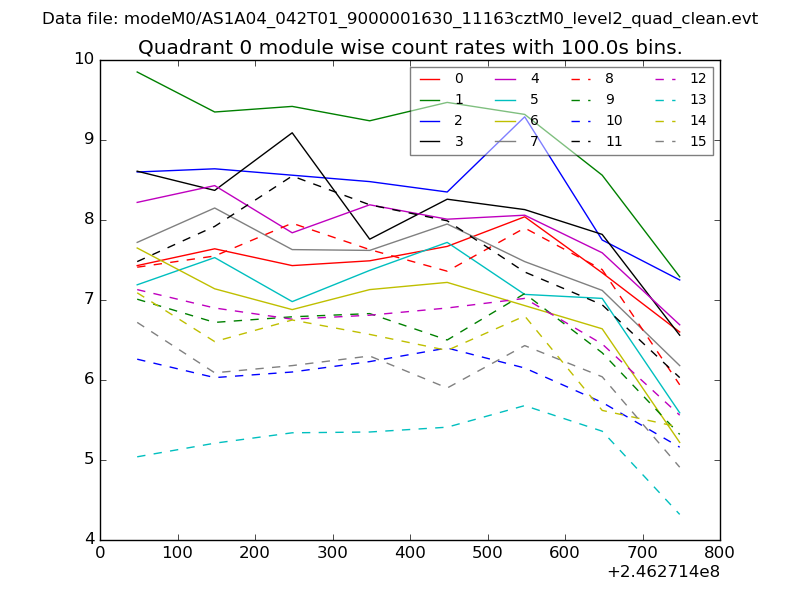 |
 |
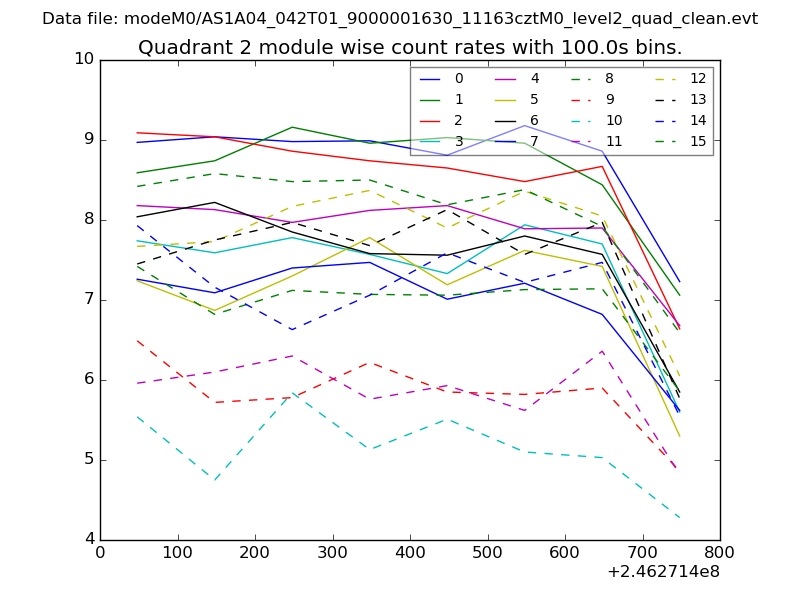
| Module-wise count rates for Quadrant B Data is divided into 100 sec bins |
 |
 |
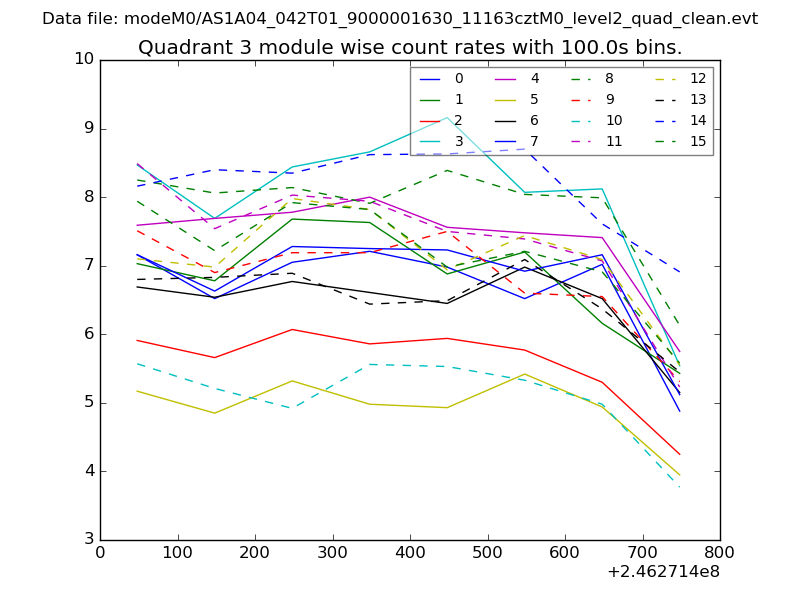
| Module-wise count rates for Quadrant C Data is divided into 100 sec bins |
 |
 |
| Module-wise count rates for Quadrant D Data is divided into 100 sec bins |
 |
 |
| Parameter | Plot |
|---|---|
| CZT HV Monitor | 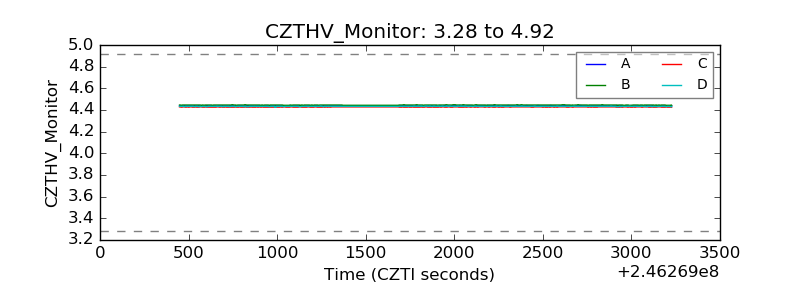 |
| D_VDD | 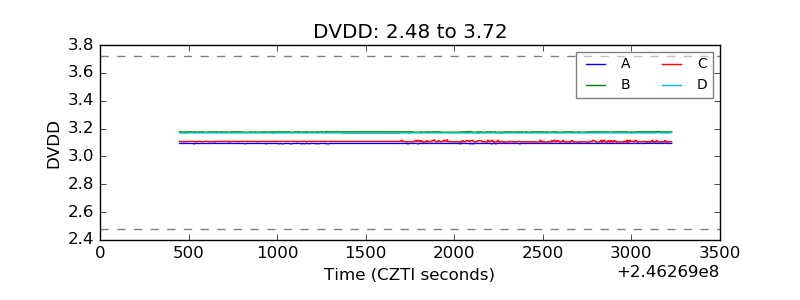 |
| Temperature 1 | 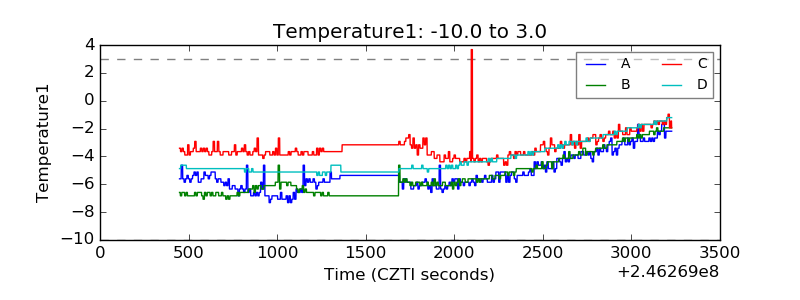 |
| Veto HV Monitor | 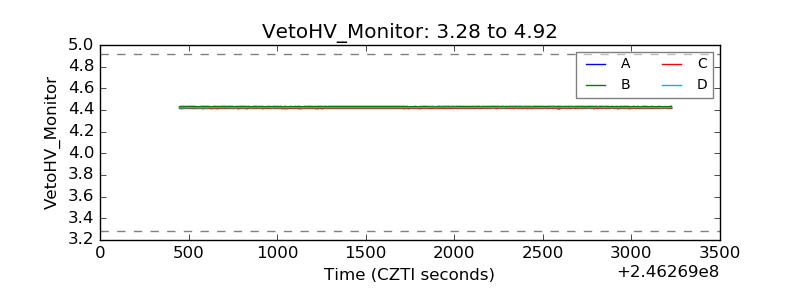 |
| Veto LLD | 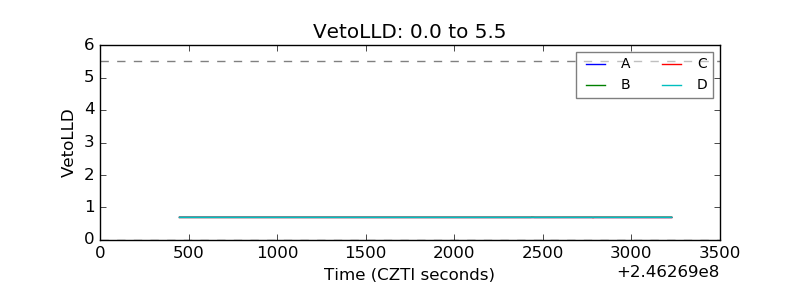 |
| Alpha Counter | 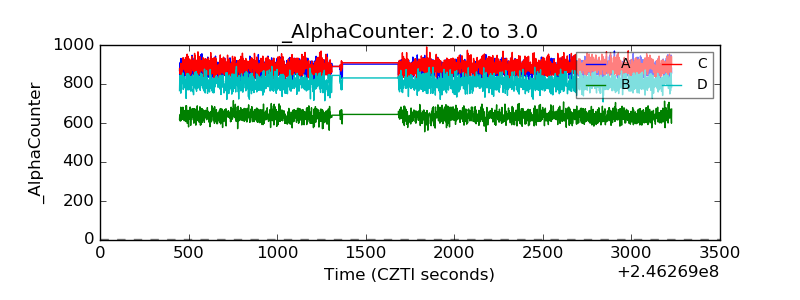 |
| _CPM_Rate | 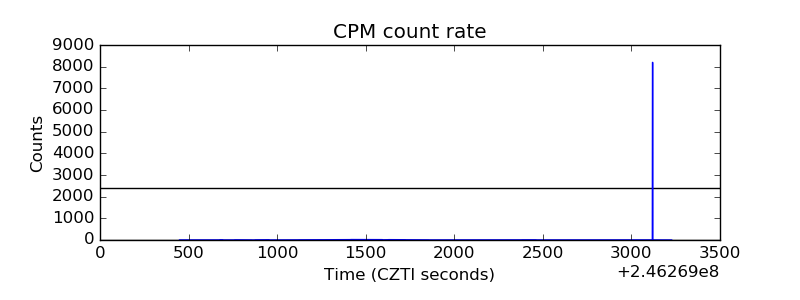 |
| CZT Counter | 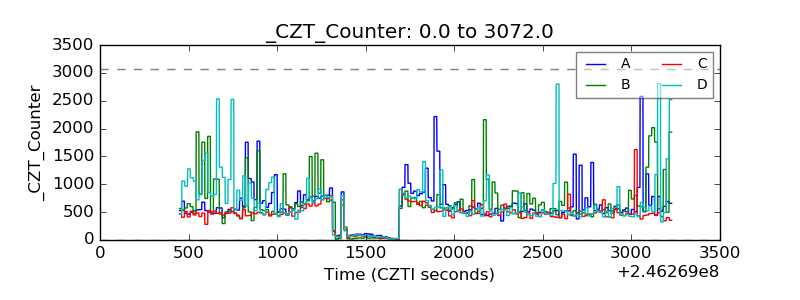 |
| +2.5 Volts monitor |  |
| +5 Volts monitor |  |
| _ROLL_ROT | 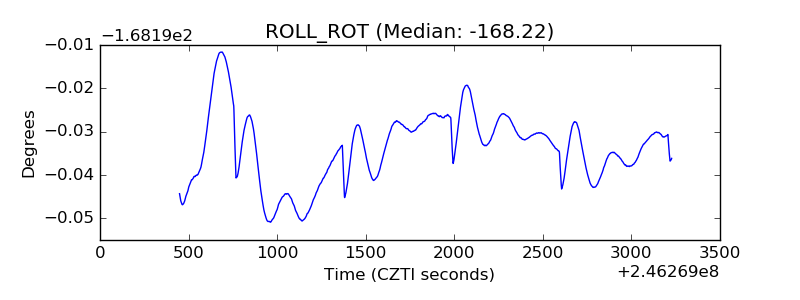 |
| _Roll_DEC | 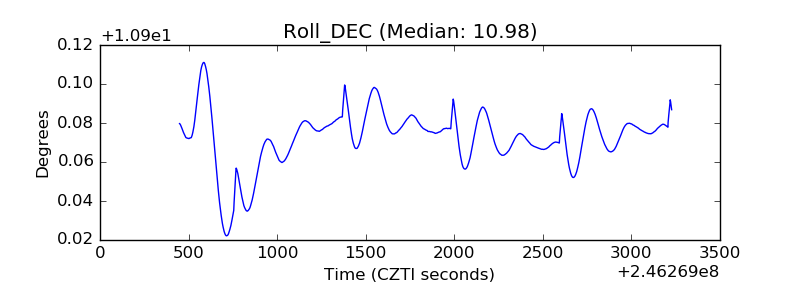 |
| _Roll_RA | 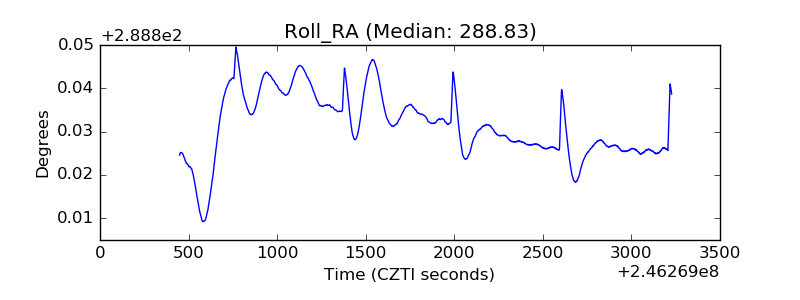 |
| Veto Counter | 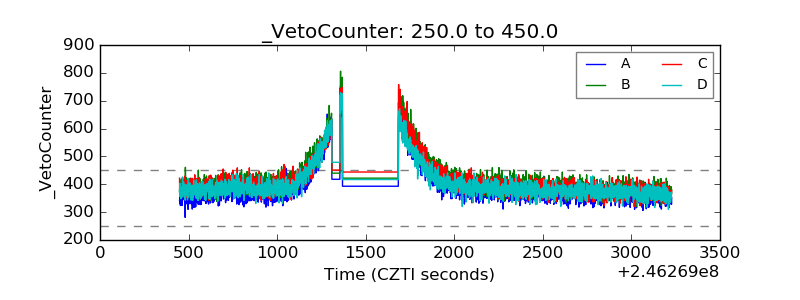 |