| Param | Original file | Final file |
|---|---|---|
| Filename | modeM0/AS1A04_042T01_9000001630_11164cztM0_level2.evt | modeM0/AS1A04_042T01_9000001630_11164cztM0_level2_quad_clean.evt |
| Size (bytes) | 760,726,080 | 84,136,320 |
| Size | 725.5 MB | 80.2 MB |
| Events in quadrant A | 5,952,075 | 515,203 |
| Events in quadrant B | 4,722,168 | 539,437 |
| Events in quadrant C | 3,215,605 | 543,521 |
| Events in quadrant D | 8,684,557 | 469,625 |
| Mode SS | |||
|---|---|---|---|
| Quadrant | BADHDUFLAG | Total packets | Discarded packets |
| A | 0 | 138 | 0 |
| B | 0 | 138 | 0 |
| C | 0 | 138 | 0 |
| D | 0 | 138 | 0 |
| Mode M0 | |||
|---|---|---|---|
| Quadrant | BADHDUFLAG | Total packets | Discarded packets |
| A | 0 | 22379 | 4 |
| B | 0 | 18504 | 1 |
| C | 0 | 14401 | 1 |
| D | 0 | 30583 | 1 |
| Quadrant | Total seconds | Saturated seconds | Saturation percentage |
|---|---|---|---|
| A | 6876 | 847 | 12.318208% |
| B | 6877 | 586 | 8.521157% |
| C | 6877 | 138 | 2.006689% |
| D | 6877 | 1122 | 16.315254% |
Noise dominated data is calculated using 1-second bins in cleaned event files. If a bin has >2000 counts, and if more than 50% of those come from <1% of pixels, then it is considered to be noise-dominated and hence unusable.
| Quadrant | # 1 sec bins | Bins with >0 counts | Bins with >2000 counts | High rate bins dominated by noise | Noise dominated (total time) | Noise dominated (detector-on time) | Marked lightcurve |
|---|---|---|---|---|---|---|---|
| A | 6897 | 6878 | 382 | 382 | 5.54% | 5.55% | 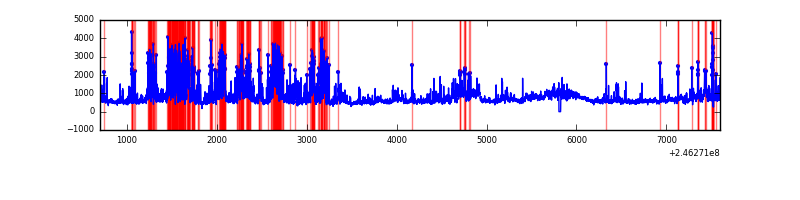 |
| B | 6897 | 6878 | 217 | 217 | 3.15% | 3.15% | 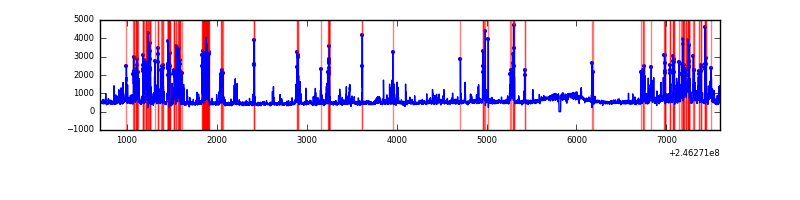 |
| C | 6897 | 6878 | 4 | 4 | 0.06% | 0.06% | 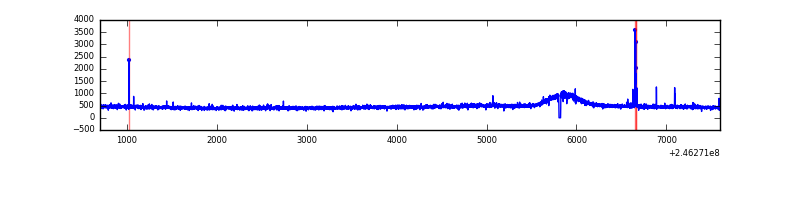 |
| D | 6897 | 6878 | 940 | 940 | 13.63% | 13.67% | 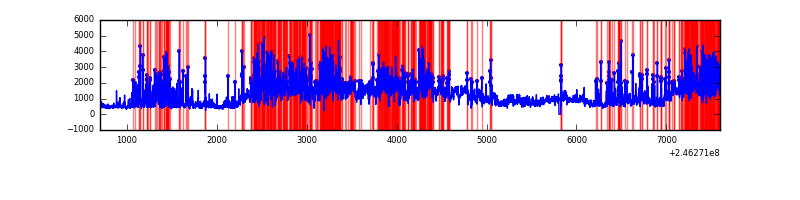 |
Top three noisy pixels from each quadrant. If the there are fewer than three noisy pixels in the level2.evt file, extra rows are filled as -1
| Pixel properties | Quadrant properties | ||||||
|---|---|---|---|---|---|---|---|
| Quadrant | DetID | PixID | Counts | Sigma | Mean | Median | Sigma |
| A | 14 | 238 | 1776586 | 10602.85 | 809 | 790 | 167.5 |
| A | 8 | 15 | 728192 | 4343.14 | 809 | 790 | 167.5 |
| A | 8 | 5 | 275660 | 1641.18 | 809 | 790 | 167.5 |
| B | 4 | 239 | 1019729 | 6375.11 | 826 | 804 | 159.8 |
| B | 10 | 16 | 133366 | 829.4 | 826 | 804 | 159.8 |
| B | 4 | 80 | 87526 | 542.59 | 826 | 804 | 159.8 |
| C | 14 | 234 | 25669 | 130.17 | 812 | 814 | 190.9 |
| C | 8 | 128 | 9100 | 43.39 | 812 | 814 | 190.9 |
| C | 13 | 61 | 5974 | 27.02 | 812 | 814 | 190.9 |
| D | 10 | 157 | 3430769 | 18068.96 | 777 | 751 | 189.8 |
| D | 12 | 16 | 1914789 | 10082.94 | 777 | 751 | 189.8 |
| D | 8 | 195 | 111589 | 583.88 | 777 | 751 | 189.8 |
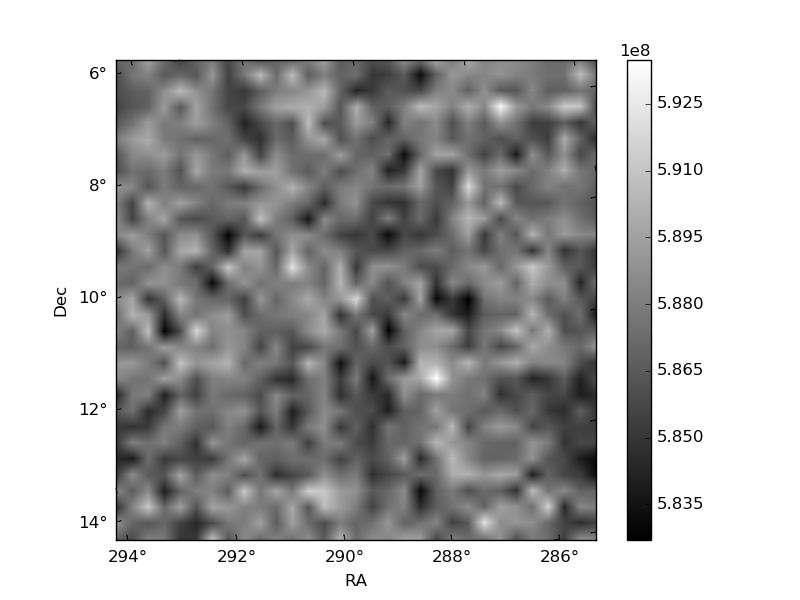
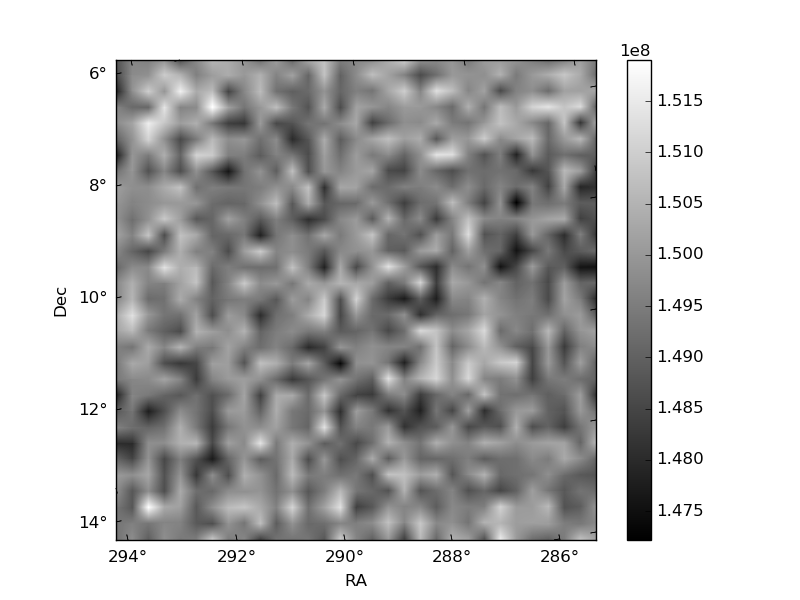
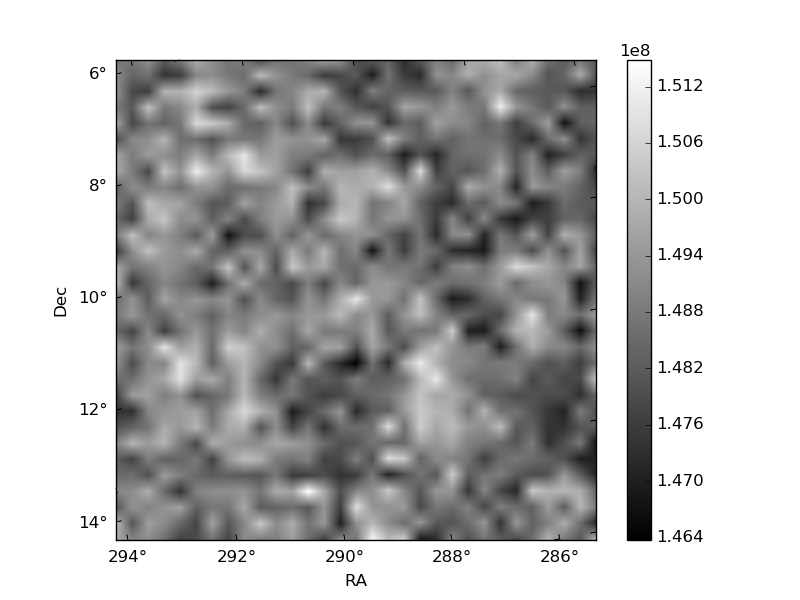
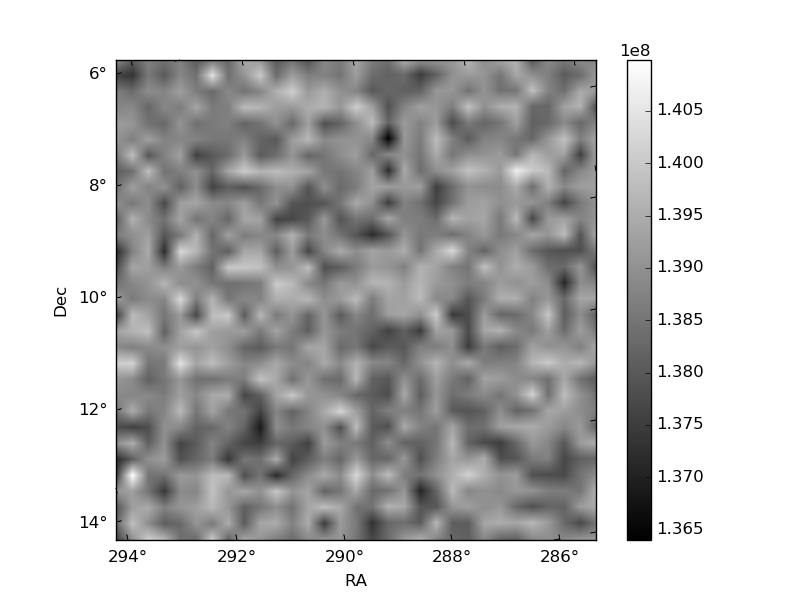
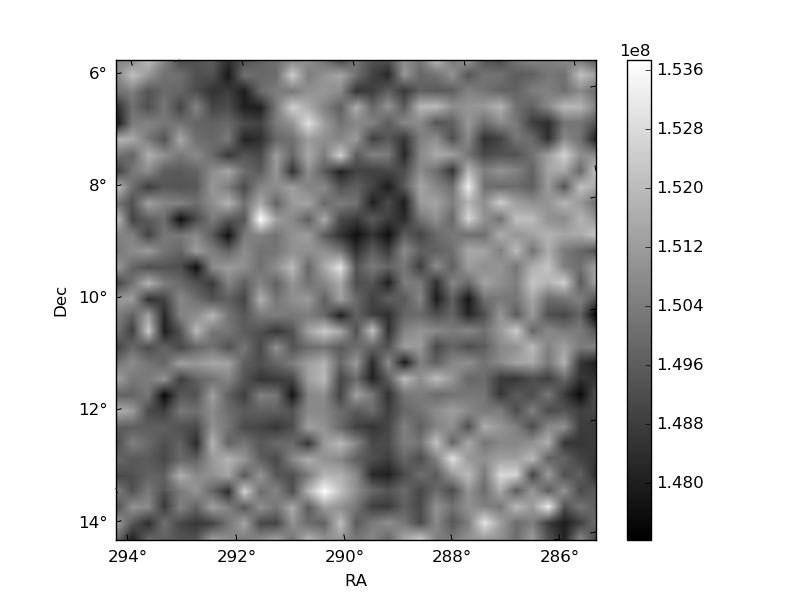
Histogram calculated using DETX and DETY for each event in the final _common_clean file
| Quadrant A | 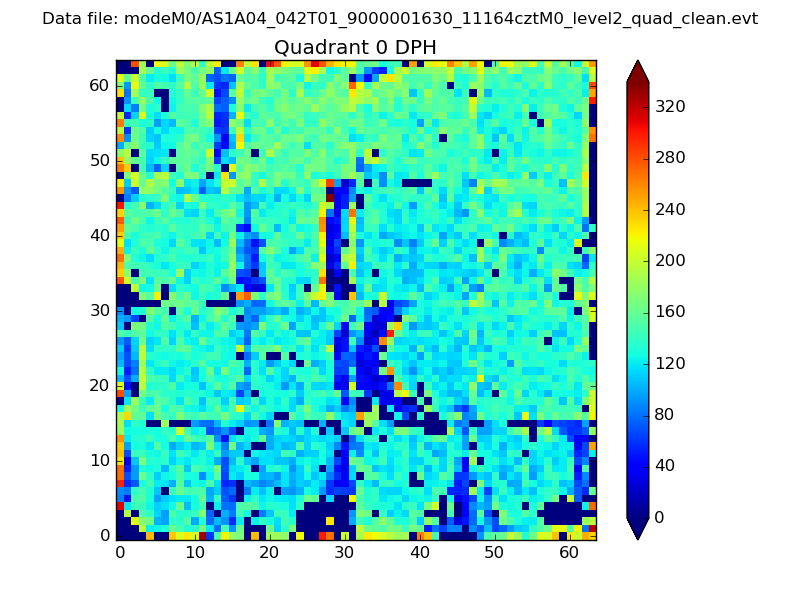 |
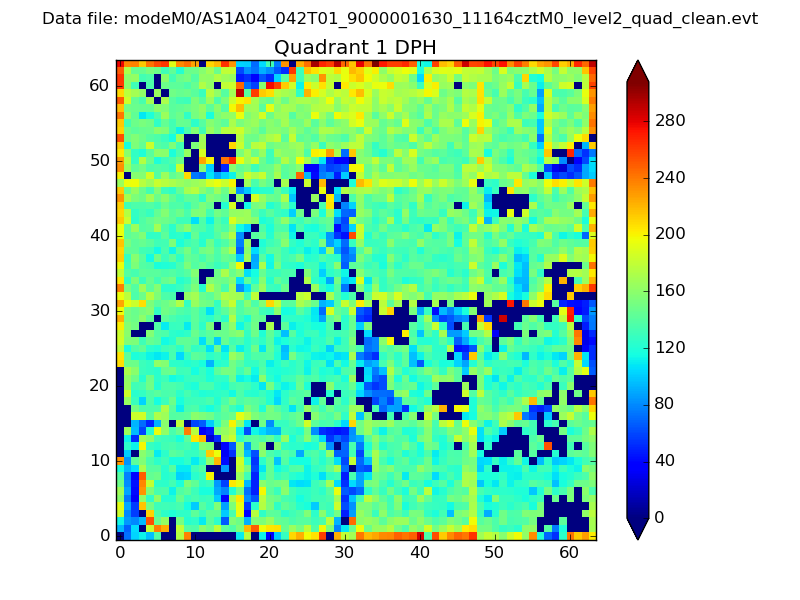 |
Quadrant B |
|---|---|---|---|
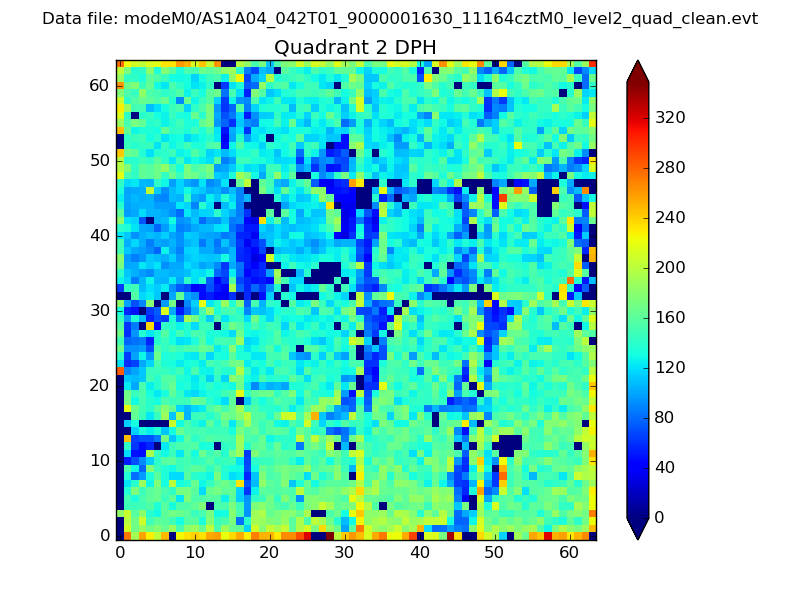
| Quadrant D | 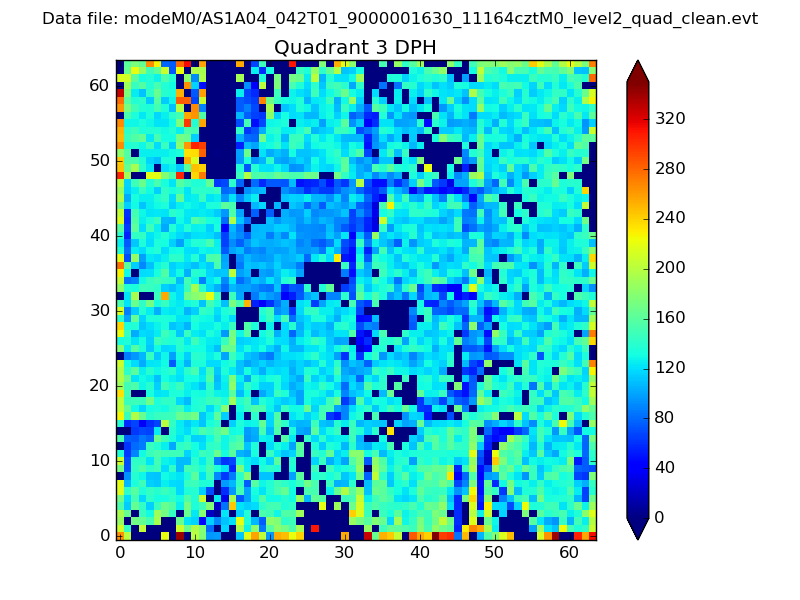 |
 |
Quadrant C |
| Plot type | Count rate plots | Images |
|---|---|---|
| Comparison with Poisson distribution Blue bars denote a histogram of data divided into 1 sec bins. Red curve is a Poisson curve with rate = median count rate of data. |
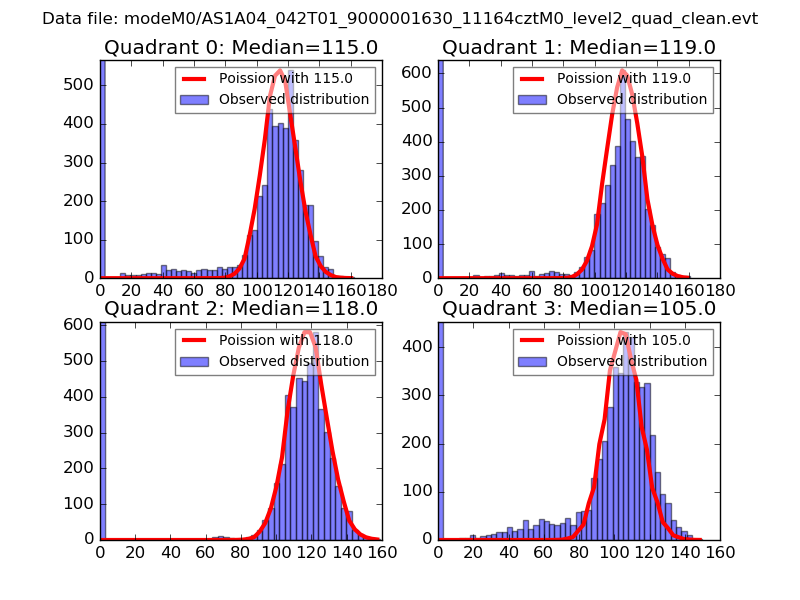 |
 |
| Quadrant-wise count rates Data is divided into 100 sec bins |
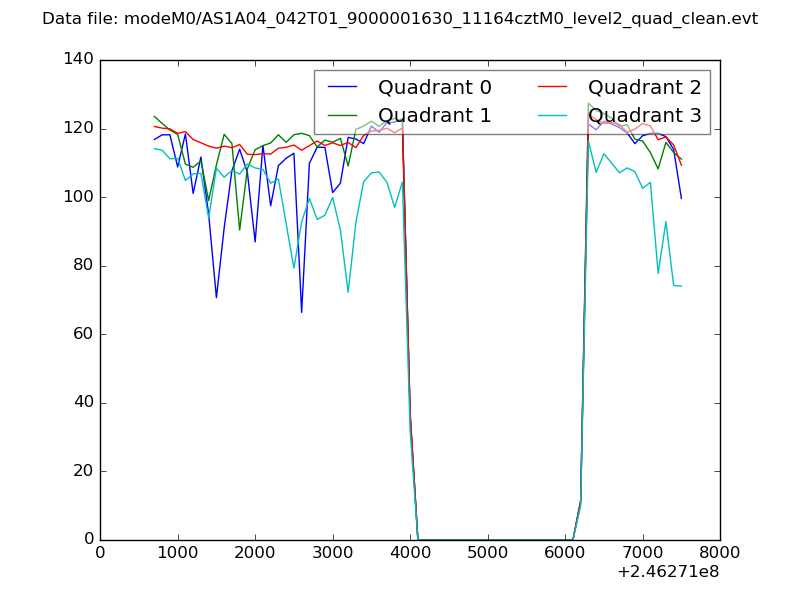 |
|
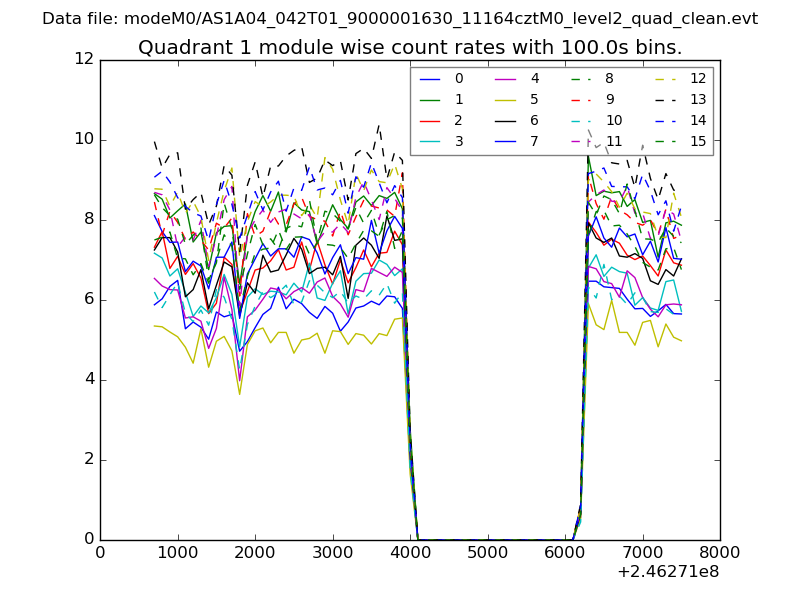
| Module-wise count rates for Quadrant A Data is divided into 100 sec bins |
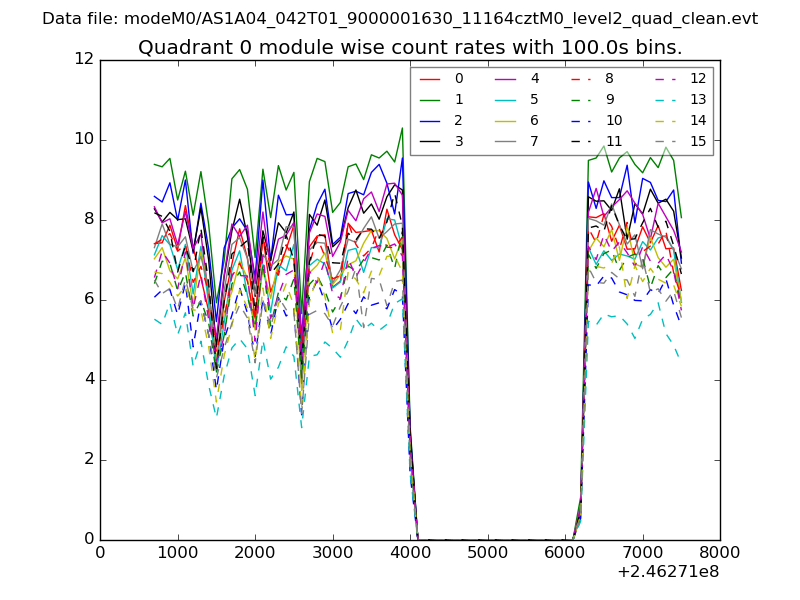 |
 |
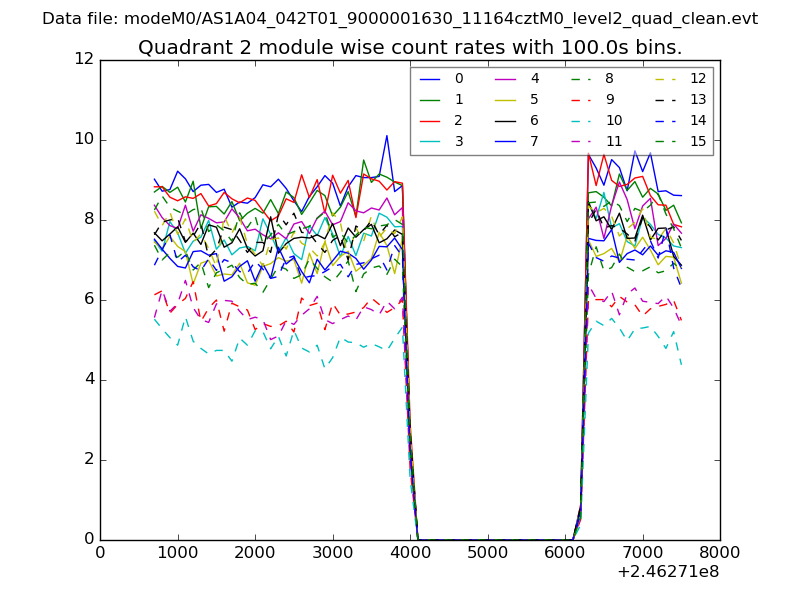
| Module-wise count rates for Quadrant B Data is divided into 100 sec bins |
 |
 |
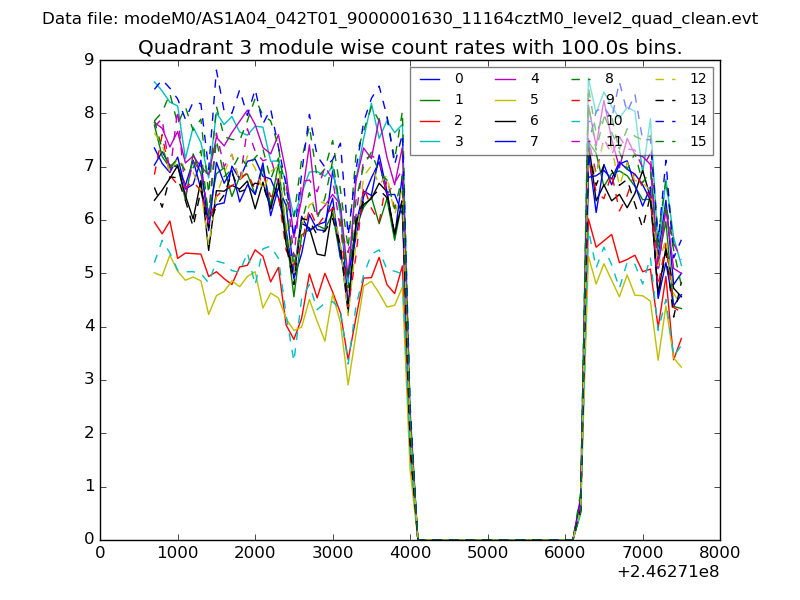
| Module-wise count rates for Quadrant C Data is divided into 100 sec bins |
 |
 |
| Module-wise count rates for Quadrant D Data is divided into 100 sec bins |
 |
 |
| Parameter | Plot |
|---|---|
| CZT HV Monitor | 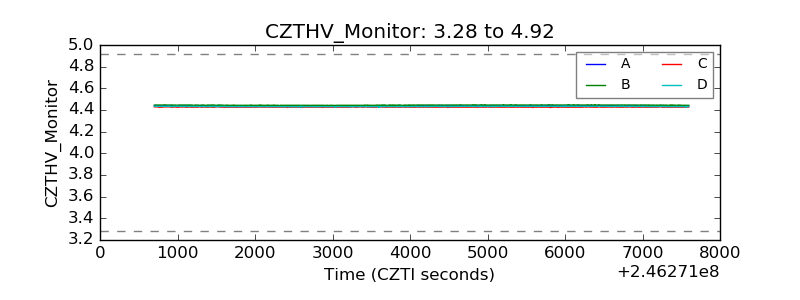 |
| D_VDD | 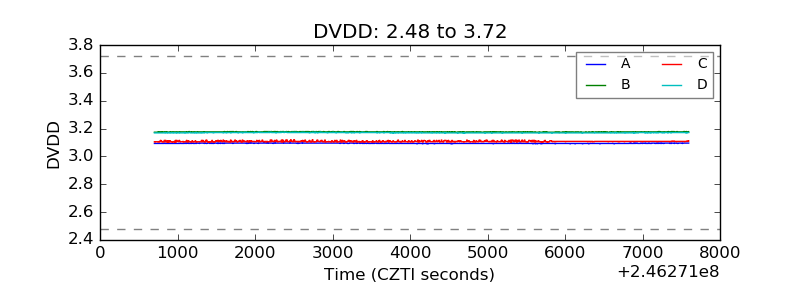 |
| Temperature 1 |  |
| Veto HV Monitor | 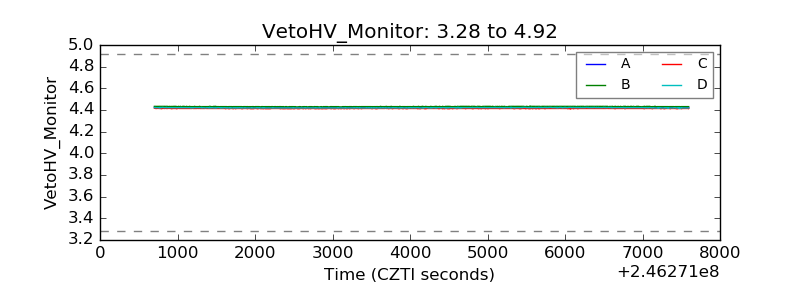 |
| Veto LLD | 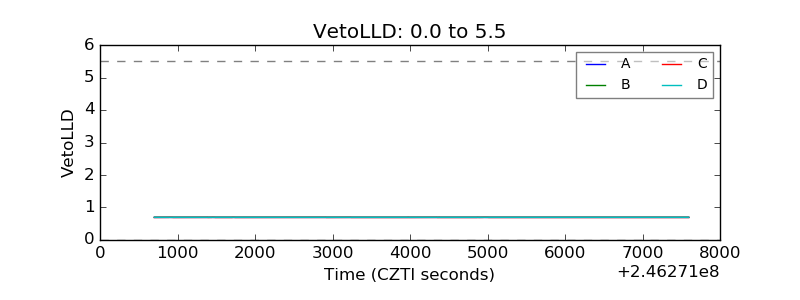 |
| Alpha Counter | 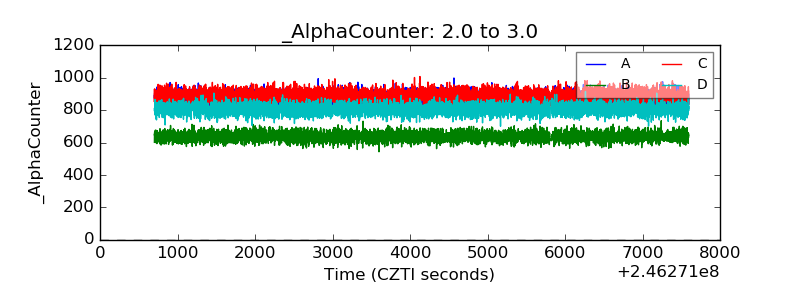 |
| _CPM_Rate | 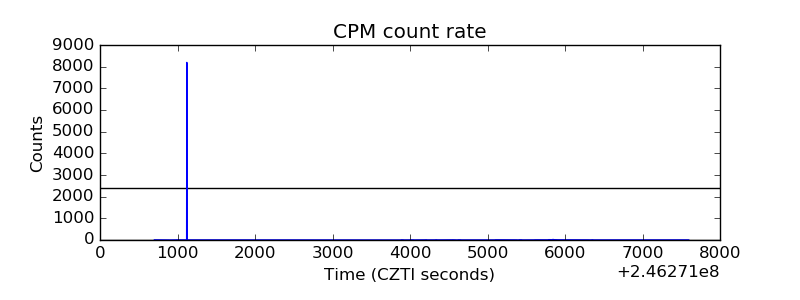 |
| CZT Counter | 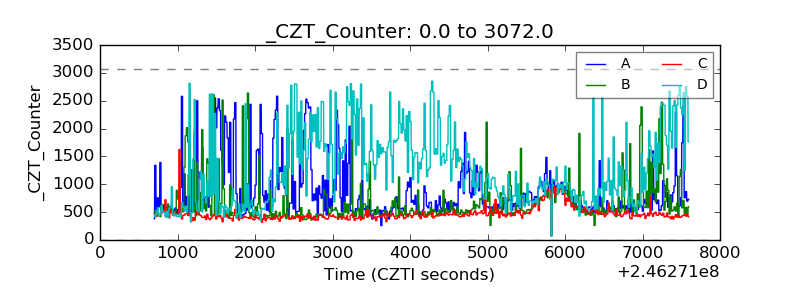 |
| +2.5 Volts monitor |  |
| +5 Volts monitor |  |
| _ROLL_ROT | 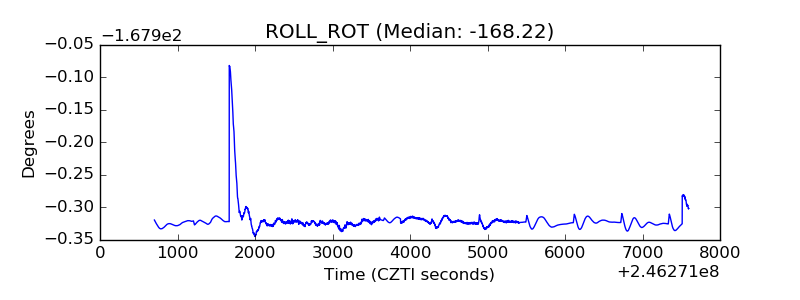 |
| _Roll_DEC |  |
| _Roll_RA | 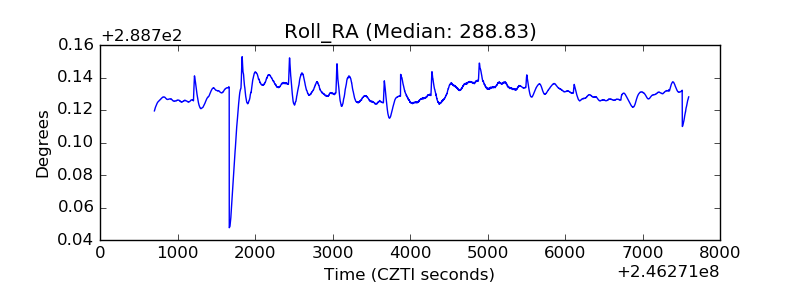 |
| Veto Counter | 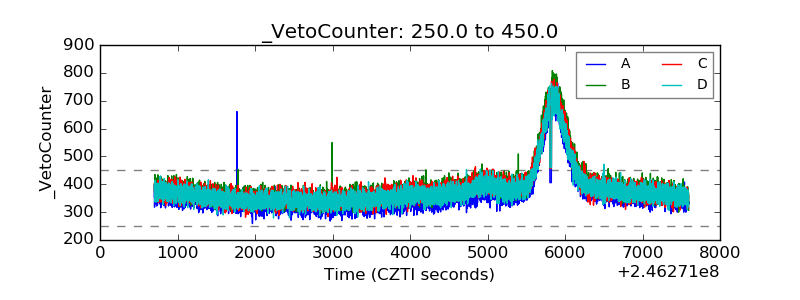 |