| Param | Original file | Final file |
|---|---|---|
| Filename | modeM0/AS1A04_042T01_9000001630_11165cztM0_level2.evt | modeM0/AS1A04_042T01_9000001630_11165cztM0_level2_quad_clean.evt |
| Size (bytes) | 645,719,040 | 77,670,720 |
| Size | 615.8 MB | 74.1 MB |
| Events in quadrant A | 5,035,500 | 481,375 |
| Events in quadrant B | 4,711,481 | 485,906 |
| Events in quadrant C | 2,848,062 | 499,376 |
| Events in quadrant D | 6,531,107 | 441,418 |
| Mode SS | |||
|---|---|---|---|
| Quadrant | BADHDUFLAG | Total packets | Discarded packets |
| A | 0 | 132 | 0 |
| B | 0 | 132 | 0 |
| C | 0 | 132 | 0 |
| D | 0 | 132 | 2 |
| Mode M9 | |||
|---|---|---|---|
| Quadrant | BADHDUFLAG | Total packets | Discarded packets |
| A | 0 | 3 | 0 |
| B | 0 | 3 | 0 |
| C | 0 | 3 | 0 |
| D | 0 | 3 | 0 |
| Mode M0 | |||
|---|---|---|---|
| Quadrant | BADHDUFLAG | Total packets | Discarded packets |
| A | 0 | 19247 | 125 |
| B | 0 | 18437 | 250 |
| C | 0 | 13105 | 61 |
| D | 0 | 24115 | 247 |
| Quadrant | Total seconds | Saturated seconds | Saturation percentage |
|---|---|---|---|
| A | 6345 | 397 | 6.256895% |
| B | 6330 | 460 | 7.266983% |
| C | 6365 | 37 | 0.581304% |
| D | 6343 | 667 | 10.515529% |
Noise dominated data is calculated using 1-second bins in cleaned event files. If a bin has >2000 counts, and if more than 50% of those come from <1% of pixels, then it is considered to be noise-dominated and hence unusable.
| Quadrant | # 1 sec bins | Bins with >0 counts | Bins with >2000 counts | High rate bins dominated by noise | Noise dominated (total time) | Noise dominated (detector-on time) | Marked lightcurve |
|---|---|---|---|---|---|---|---|
| A | 6710 | 6381 | 251 | 251 | 3.74% | 3.93% | 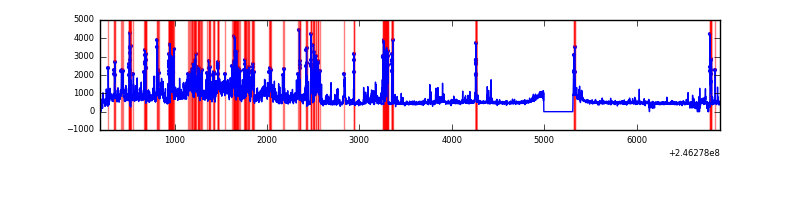 |
| B | 6709 | 6368 | 239 | 239 | 3.56% | 3.75% | 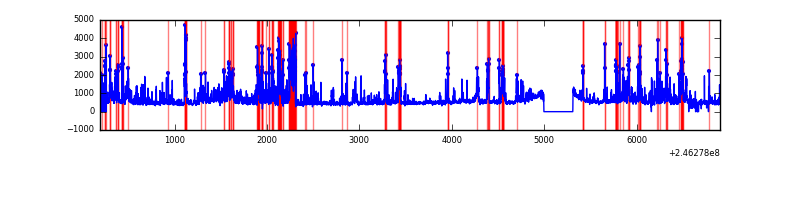 |
| C | 6710 | 6392 | 0 | 0 | 0.00% | 0.00% | 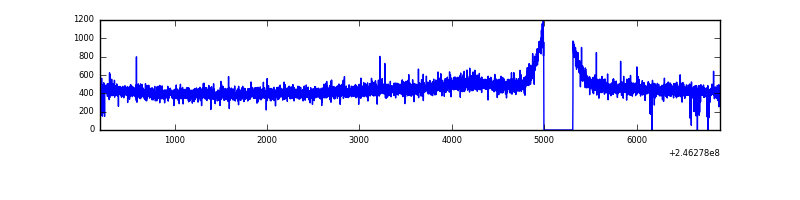 |
| D | 6710 | 6382 | 659 | 659 | 9.82% | 10.33% | 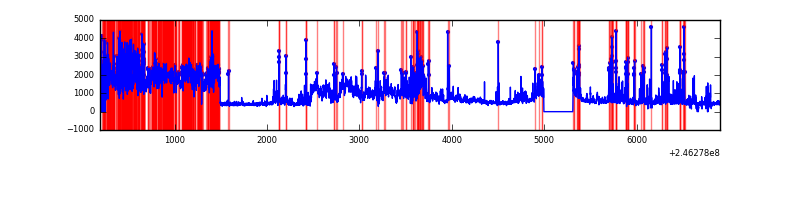 |
Top three noisy pixels from each quadrant. If the there are fewer than three noisy pixels in the level2.evt file, extra rows are filled as -1
| Pixel properties | Quadrant properties | ||||||
|---|---|---|---|---|---|---|---|
| Quadrant | DetID | PixID | Counts | Sigma | Mean | Median | Sigma |
| A | 8 | 15 | 1018462 | 6602.87 | 737 | 719 | 154.1 |
| A | 14 | 238 | 862617 | 5591.79 | 737 | 719 | 154.1 |
| A | 8 | 5 | 280103 | 1812.58 | 737 | 719 | 154.1 |
| B | 4 | 239 | 994572 | 7014.93 | 735 | 718 | 141.7 |
| B | 10 | 16 | 473459 | 3336.75 | 735 | 718 | 141.7 |
| B | 15 | 204 | 100203 | 702.2 | 735 | 718 | 141.7 |
| C | 13 | 61 | 5474 | 27.77 | 729 | 732 | 170.8 |
| C | 14 | 67 | 2126 | 8.16 | 729 | 732 | 170.8 |
| C | 3 | 202 | 1828 | 6.42 | 729 | 732 | 170.8 |
| D | 10 | 157 | 2585321 | 14842.52 | 704 | 684 | 174.1 |
| D | 12 | 16 | 953076 | 5469.2 | 704 | 684 | 174.1 |
| D | 14 | 34 | 93177 | 531.15 | 704 | 684 | 174.1 |
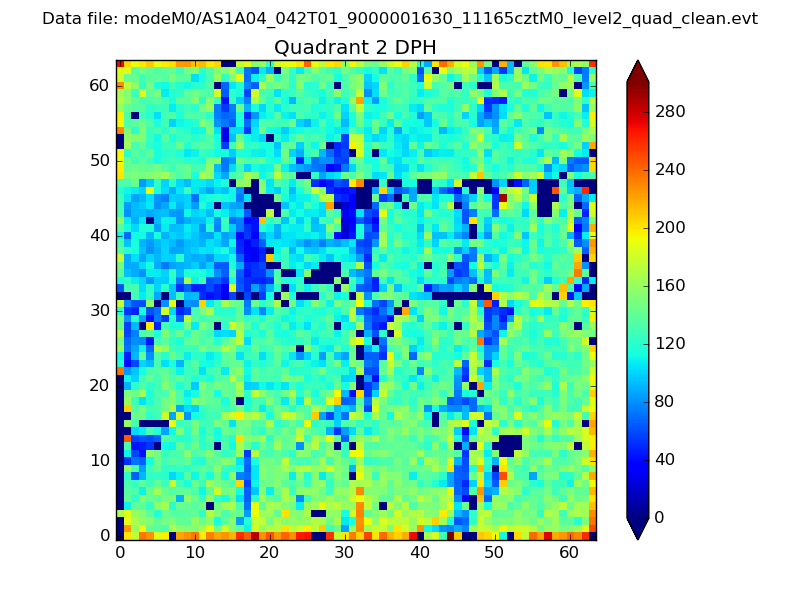
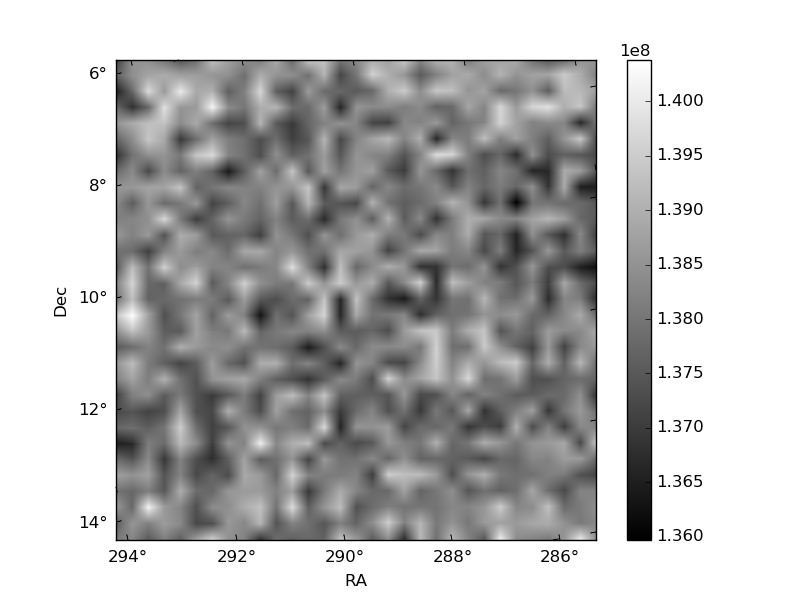
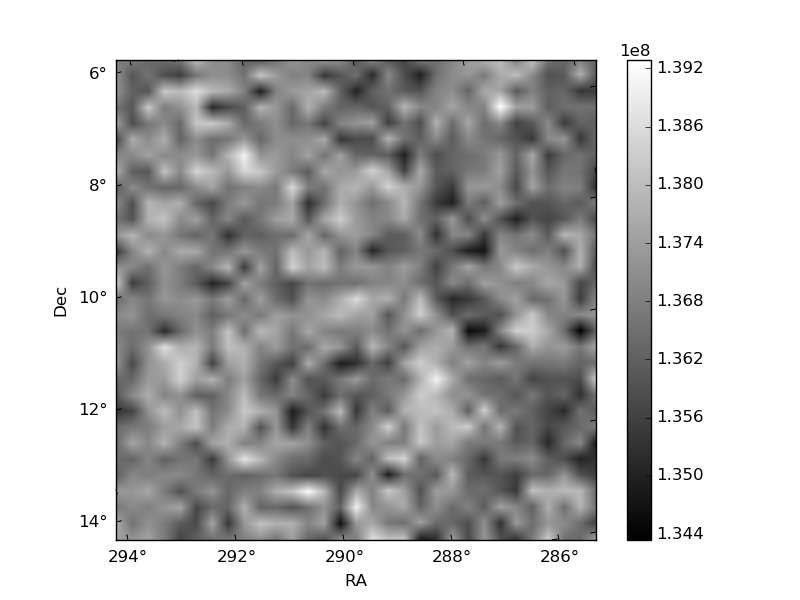
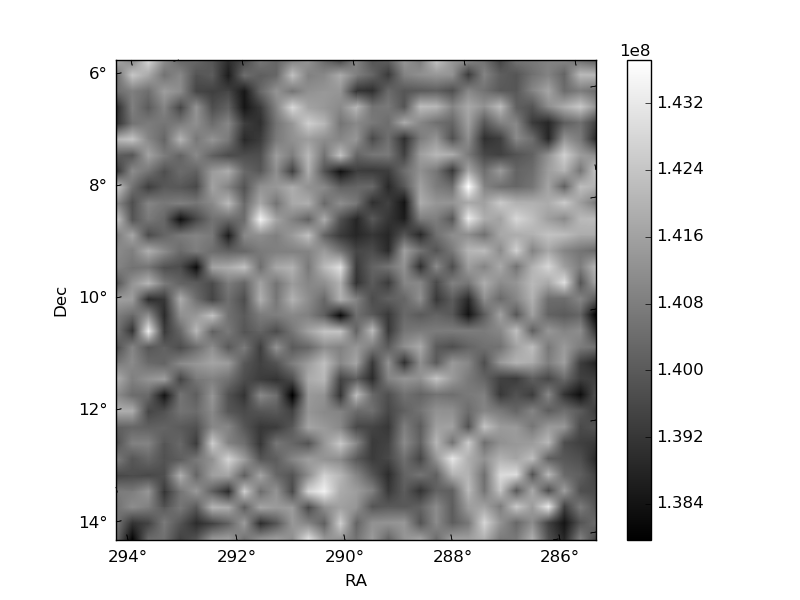
Histogram calculated using DETX and DETY for each event in the final _common_clean file
| Quadrant A |  |
 |
Quadrant B |
|---|---|---|---|
| Quadrant D | 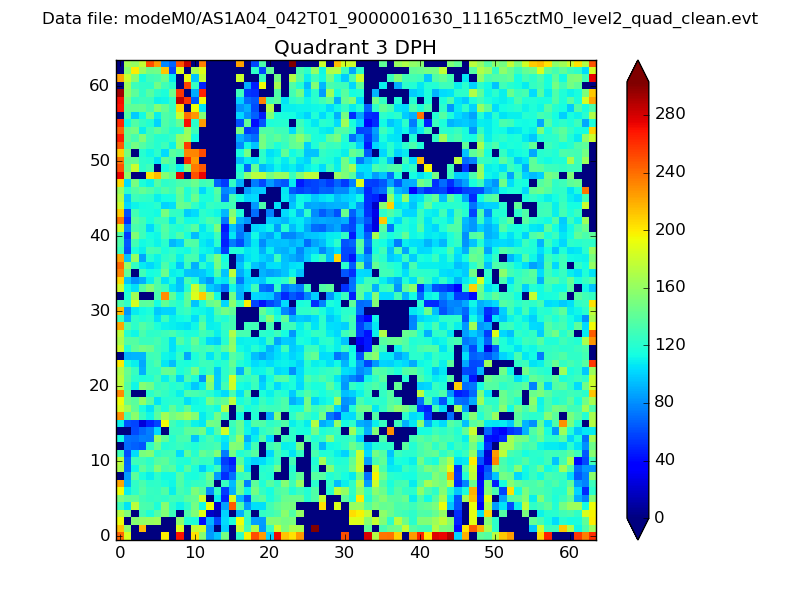 |
 |
Quadrant C |
| Plot type | Count rate plots | Images |
|---|---|---|
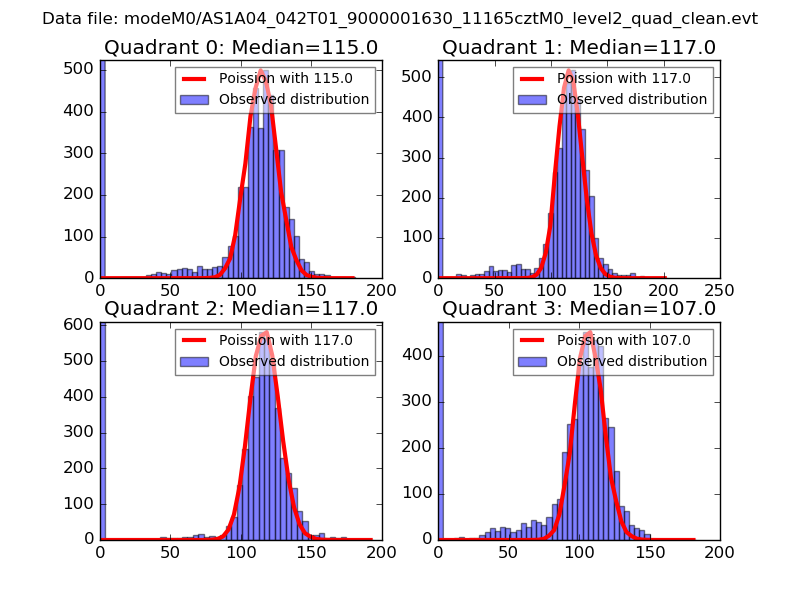
| Comparison with Poisson distribution Blue bars denote a histogram of data divided into 1 sec bins. Red curve is a Poisson curve with rate = median count rate of data. |
 |
 |
| Quadrant-wise count rates Data is divided into 100 sec bins |
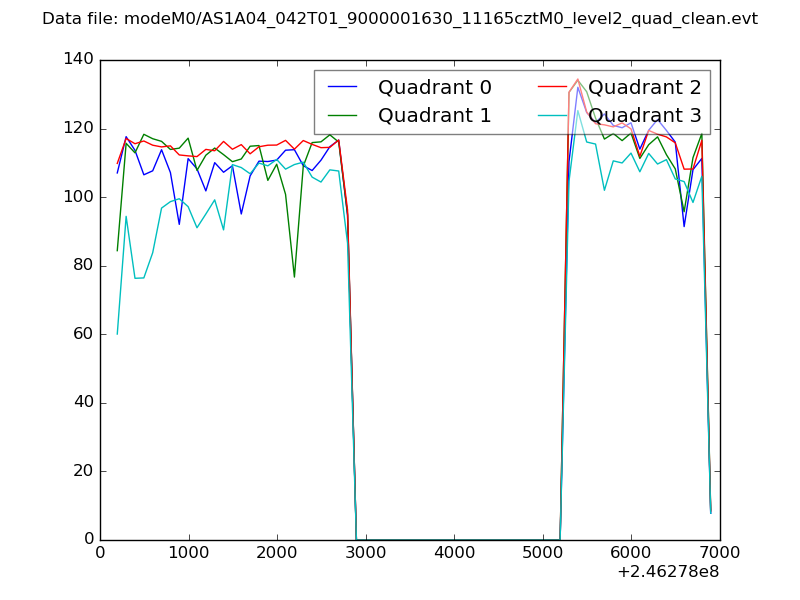 |
|
| Module-wise count rates for Quadrant A Data is divided into 100 sec bins |
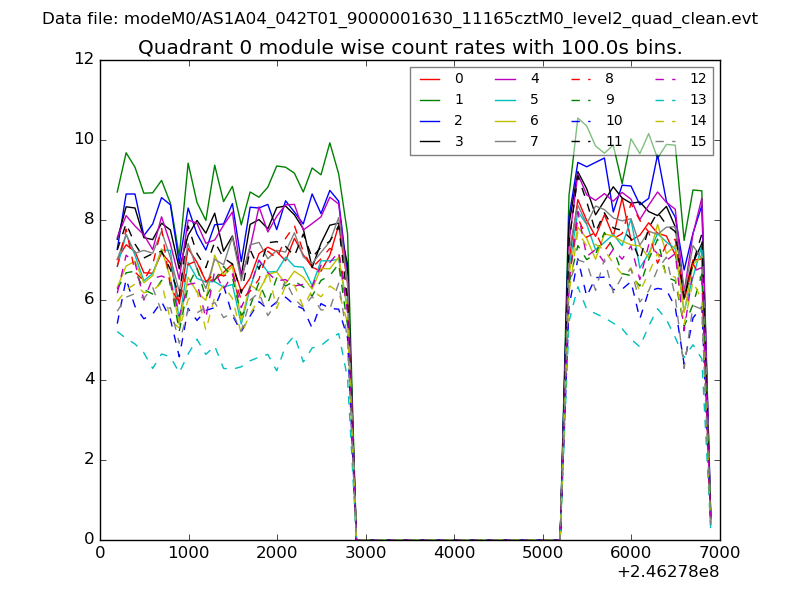 |
 |
| Module-wise count rates for Quadrant B Data is divided into 100 sec bins |
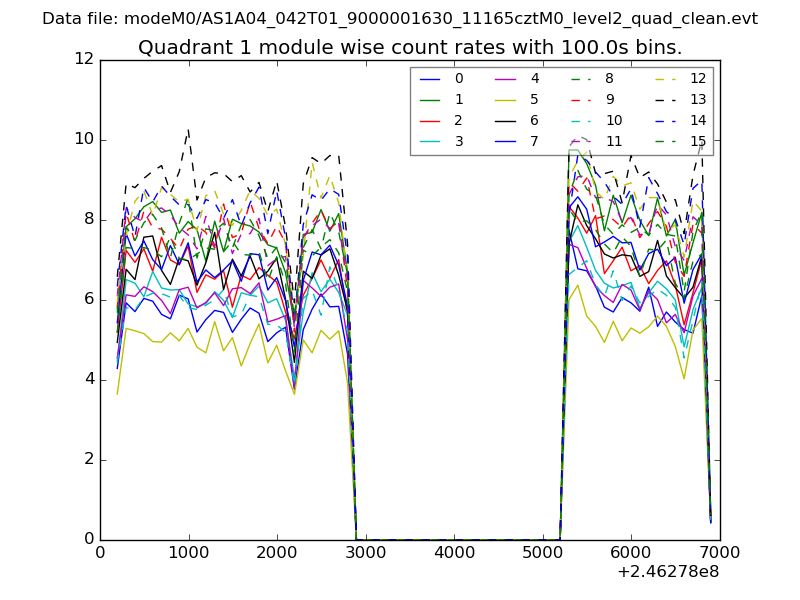 |
 |
| Module-wise count rates for Quadrant C Data is divided into 100 sec bins |
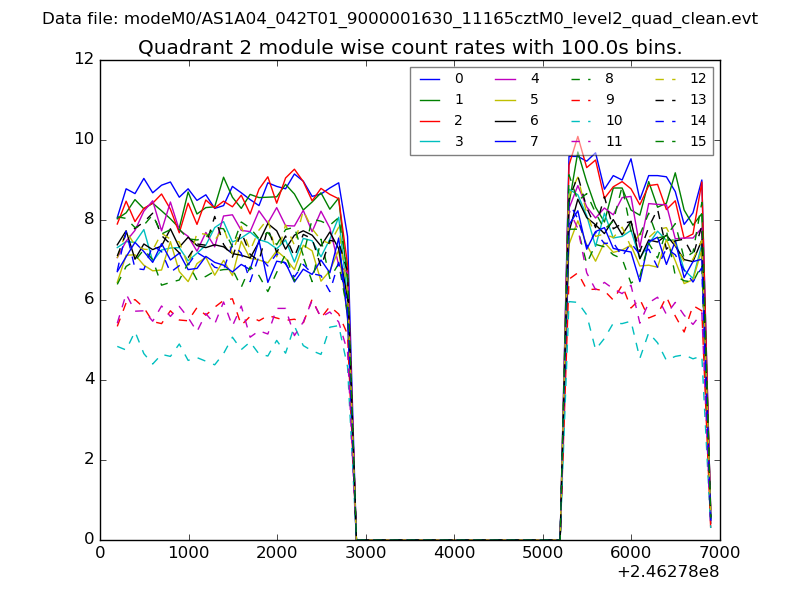 |
 |
| Module-wise count rates for Quadrant D Data is divided into 100 sec bins |
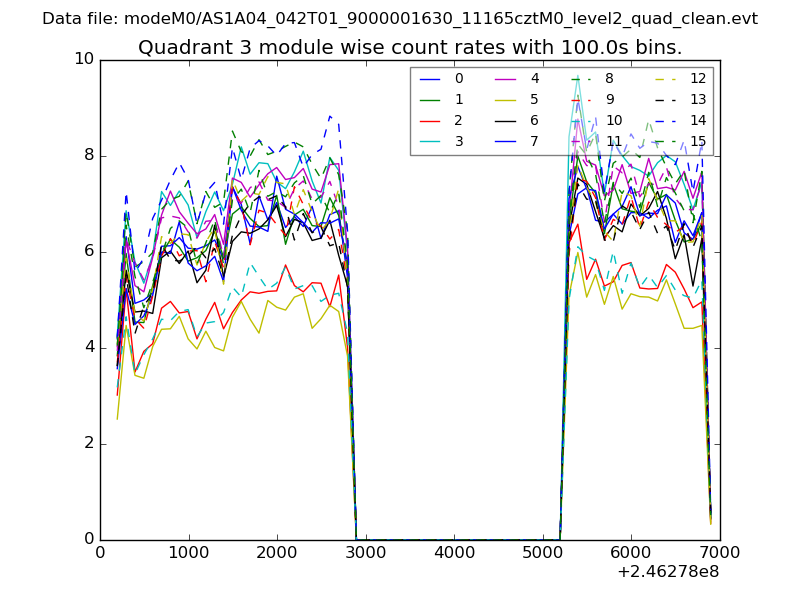 |
 |
| Parameter | Plot |
|---|---|
| CZT HV Monitor | 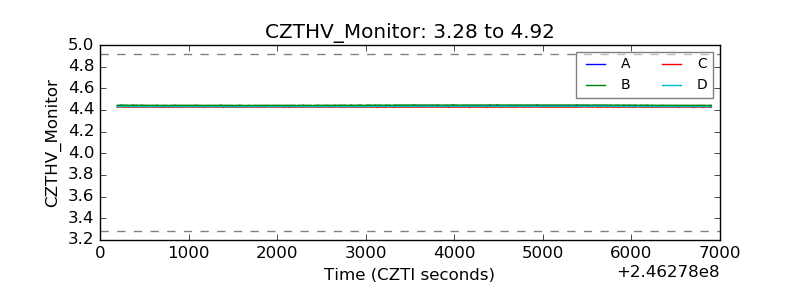 |
| D_VDD | 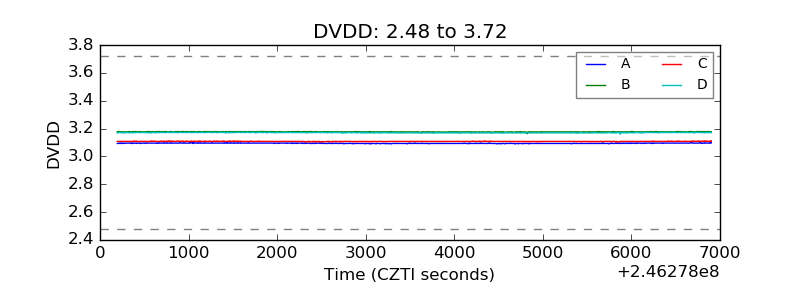 |
| Temperature 1 | 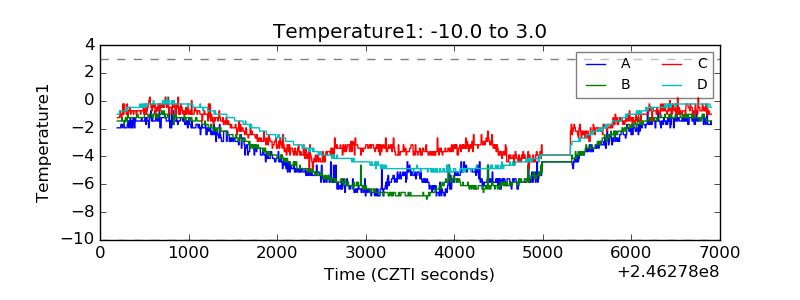 |
| Veto HV Monitor | 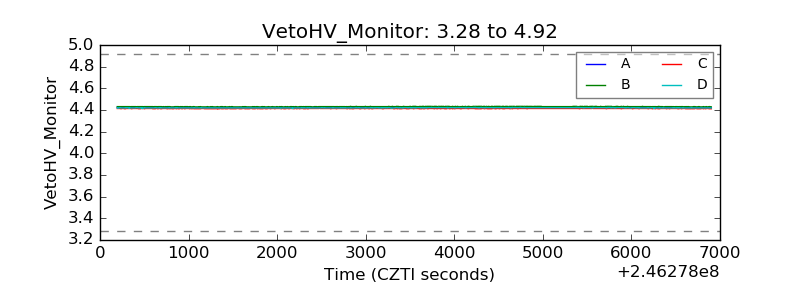 |
| Veto LLD |  |
| Alpha Counter | 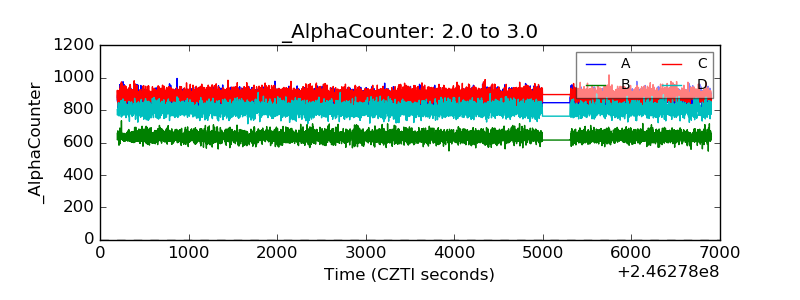 |
| _CPM_Rate | 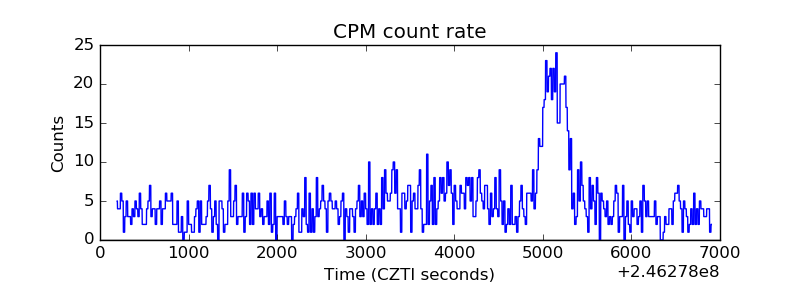 |
| CZT Counter | 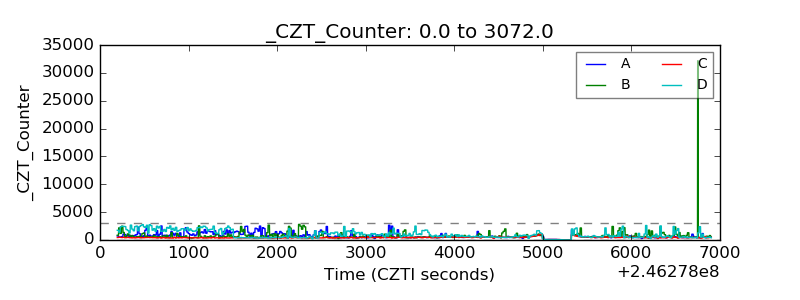 |
| +2.5 Volts monitor | 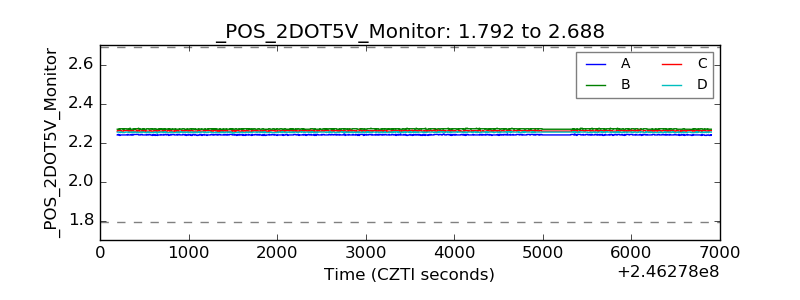 |
| +5 Volts monitor | 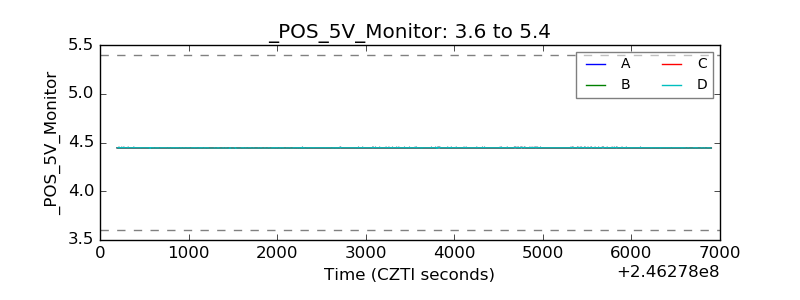 |
| _ROLL_ROT | 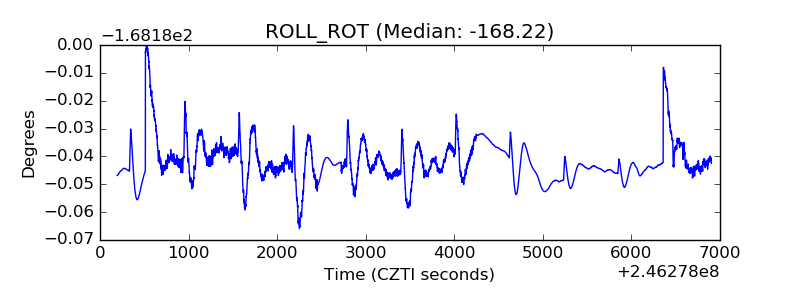 |
| _Roll_DEC | 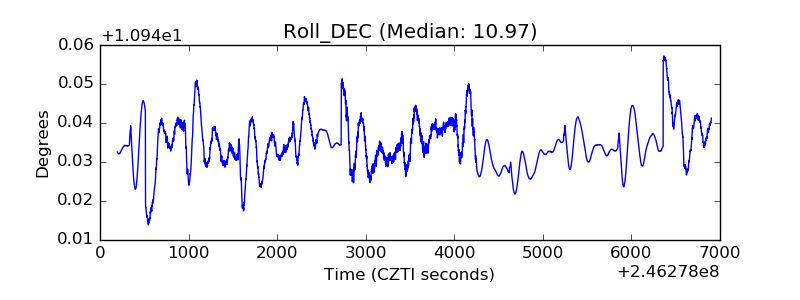 |
| _Roll_RA |  |
| Veto Counter | 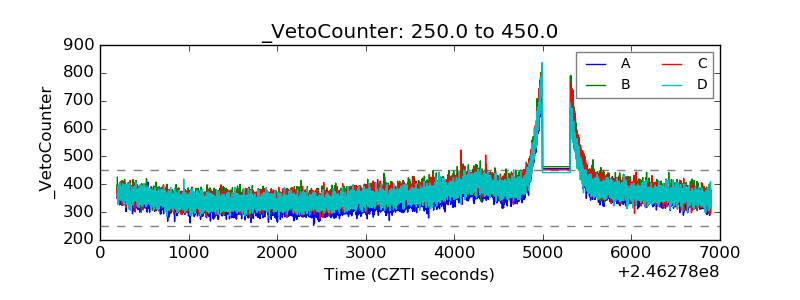 |