| Param | Original file | Final file |
|---|---|---|
| Filename | modeM0/AS1A04_042T01_9000001630_11167cztM0_level2.evt | modeM0/AS1A04_042T01_9000001630_11167cztM0_level2_quad_clean.evt |
| Size (bytes) | 114,641,280 | 11,168,640 |
| Size | 109.3 MB | 10.7 MB |
| Events in quadrant A | 907,518 | 56,611 |
| Events in quadrant B | 940,805 | 56,658 |
| Events in quadrant C | 714,680 | 57,547 |
| Events in quadrant D | 802,891 | 54,287 |
| Mode SS | |||
|---|---|---|---|
| Quadrant | BADHDUFLAG | Total packets | Discarded packets |
| A | 0 | 64 | 32 |
| B | 0 | 67 | 35 |
| C | 0 | 66 | 36 |
| D | 0 | 64 | 31 |
| Mode M9 | |||
|---|---|---|---|
| Quadrant | BADHDUFLAG | Total packets | Discarded packets |
| A | 0 | 8 | 4 |
| B | 0 | 7 | 3 |
| C | 0 | 7 | 3 |
| D | 0 | 7 | 3 |
| Mode M0 | |||
|---|---|---|---|
| Quadrant | BADHDUFLAG | Total packets | Discarded packets |
| A | 0 | 7468 | 3823 |
| B | 0 | 7565 | 3828 |
| C | 0 | 6415 | 3215 |
| D | 0 | 7490 | 4035 |
| Quadrant | Total seconds | Saturated seconds | Saturation percentage |
|---|---|---|---|
| A | 1506 | 36 | 2.390438% |
| B | 1510 | 82 | 5.430464% |
| C | 1530 | 13 | 0.849673% |
| D | 1533 | 23 | 1.500326% |
Noise dominated data is calculated using 1-second bins in cleaned event files. If a bin has >2000 counts, and if more than 50% of those come from <1% of pixels, then it is considered to be noise-dominated and hence unusable.
| Quadrant | # 1 sec bins | Bins with >0 counts | Bins with >2000 counts | High rate bins dominated by noise | Noise dominated (total time) | Noise dominated (detector-on time) | Marked lightcurve |
|---|---|---|---|---|---|---|---|
| A | 3842 | 1632 | 9 | 9 | 0.23% | 0.55% | 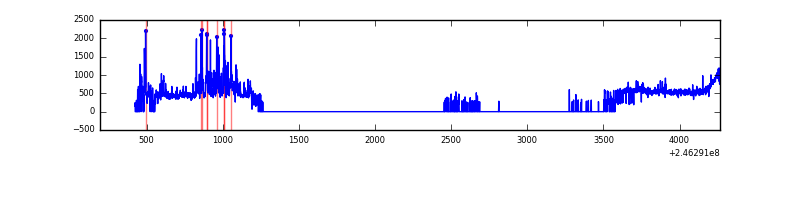 |
| B | 3831 | 1625 | 23 | 23 | 0.60% | 1.42% | 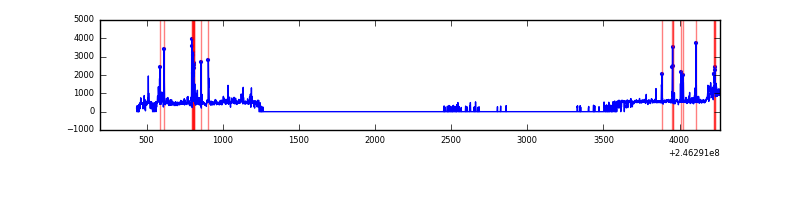 |
| C | 4072 | 1653 | 0 | 0 | 0.00% | 0.00% | 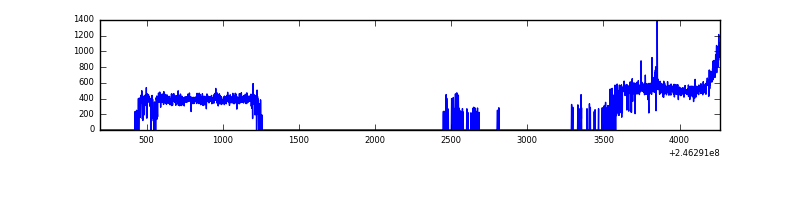 |
| D | 3840 | 1646 | 5 | 5 | 0.13% | 0.30% | 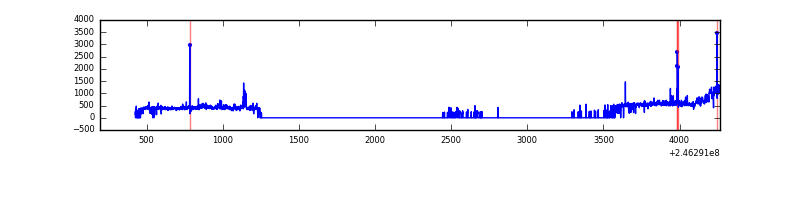 |
Top three noisy pixels from each quadrant. If the there are fewer than three noisy pixels in the level2.evt file, extra rows are filled as -1
| Pixel properties | Quadrant properties | ||||||
|---|---|---|---|---|---|---|---|
| Quadrant | DetID | PixID | Counts | Sigma | Mean | Median | Sigma |
| A | 14 | 238 | 126350 | 3166.97 | 184 | 180 | 39.8 |
| A | 8 | 5 | 64425 | 1612.6 | 184 | 180 | 39.8 |
| A | 8 | 15 | 6928 | 169.38 | 184 | 180 | 39.8 |
| B | 4 | 239 | 91049 | 2436.42 | 182 | 177 | 37.3 |
| B | 10 | 16 | 37572 | 1002.62 | 182 | 177 | 37.3 |
| B | 4 | 80 | 28880 | 769.57 | 182 | 177 | 37.3 |
| C | 5 | 128 | 4813 | 103.76 | 181 | 182 | 44.6 |
| C | 13 | 61 | 1442 | 28.23 | 181 | 182 | 44.6 |
| C | 12 | 4 | 794 | 13.71 | 181 | 182 | 44.6 |
| D | 10 | 157 | 46526 | 1017.52 | 180 | 175 | 45.6 |
| D | 10 | 253 | 14959 | 324.54 | 180 | 175 | 45.6 |
| D | 5 | 222 | 12060 | 260.9 | 180 | 175 | 45.6 |
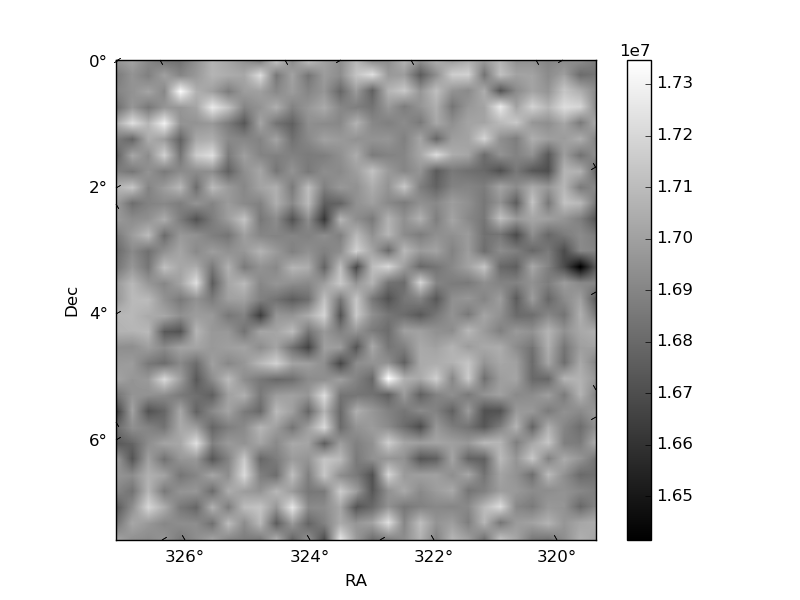
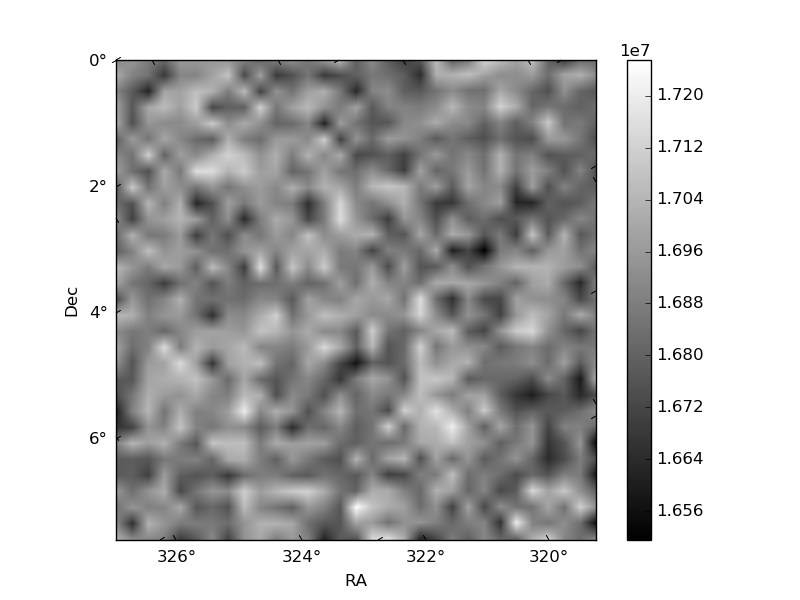
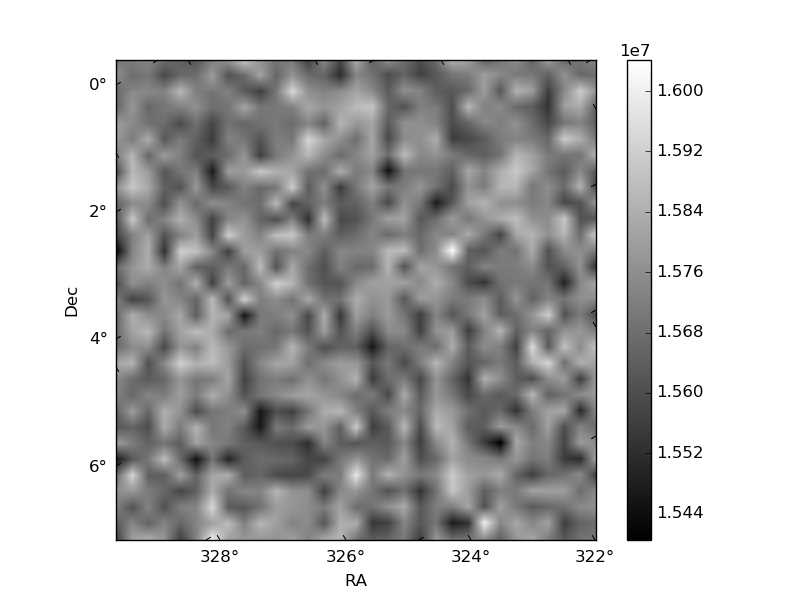
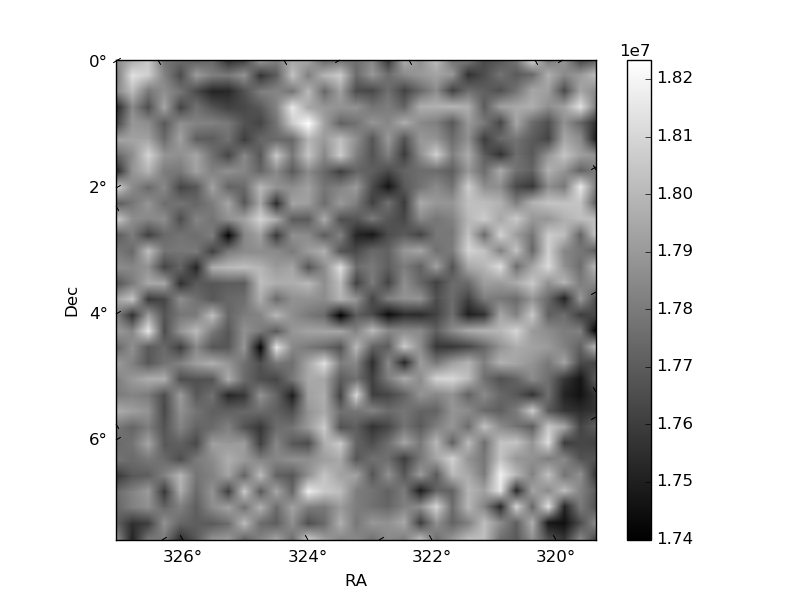
Histogram calculated using DETX and DETY for each event in the final _common_clean file
| Quadrant A | 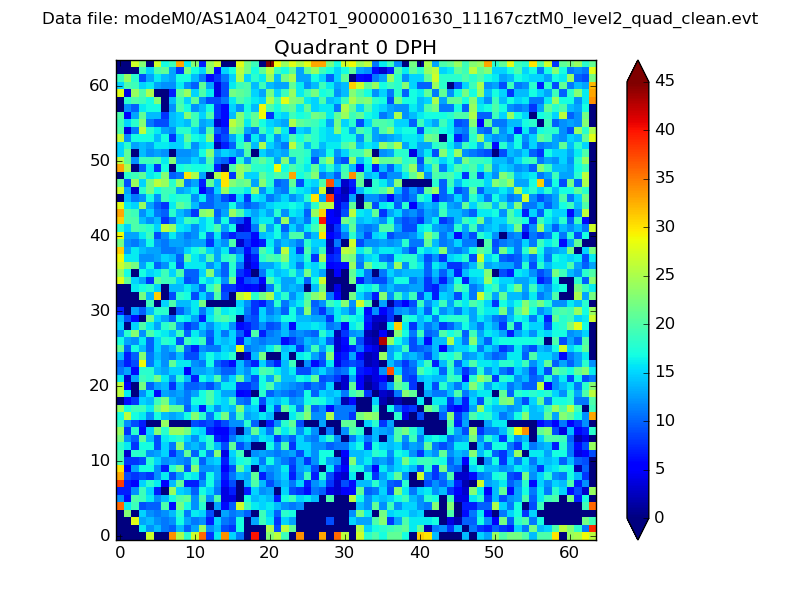 |
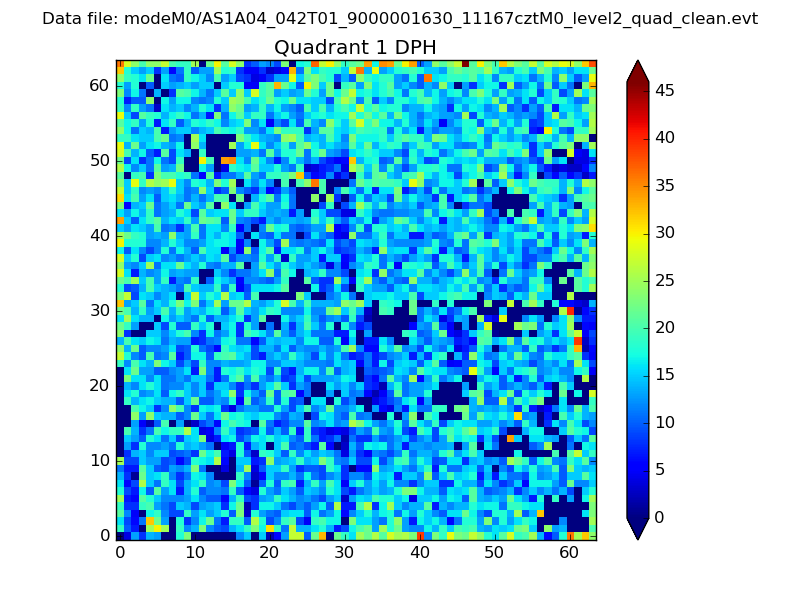 |
Quadrant B |
|---|---|---|---|
| Quadrant D | 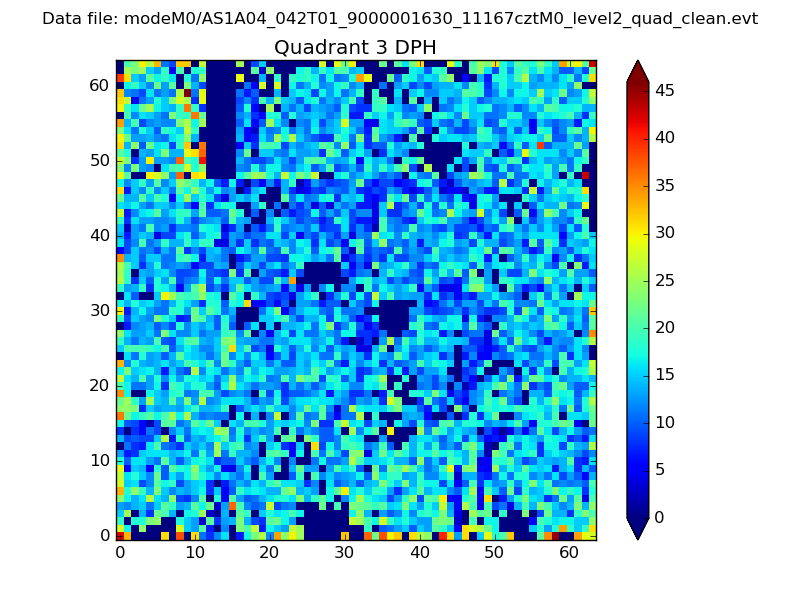 |
 |
Quadrant C |
| Plot type | Count rate plots | Images |
|---|---|---|
| Comparison with Poisson distribution Blue bars denote a histogram of data divided into 1 sec bins. Red curve is a Poisson curve with rate = median count rate of data. |
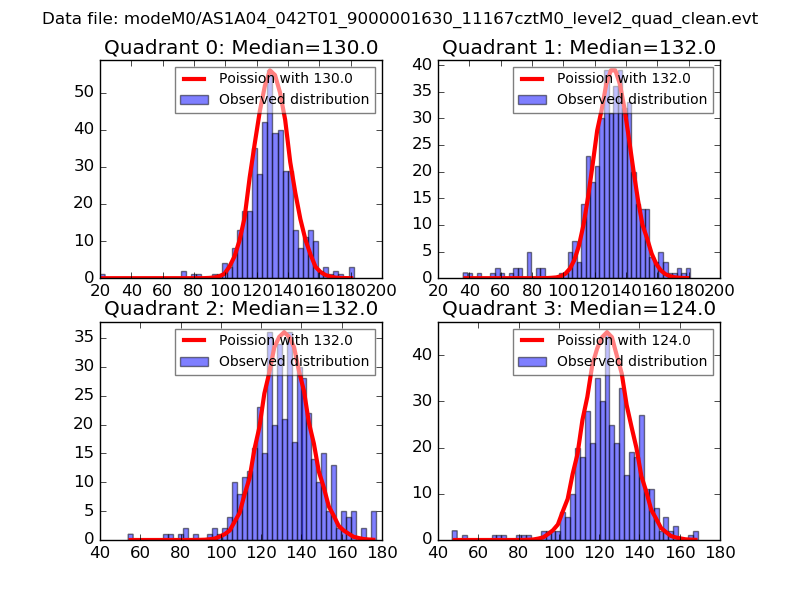 |
 |
| Quadrant-wise count rates Data is divided into 100 sec bins |
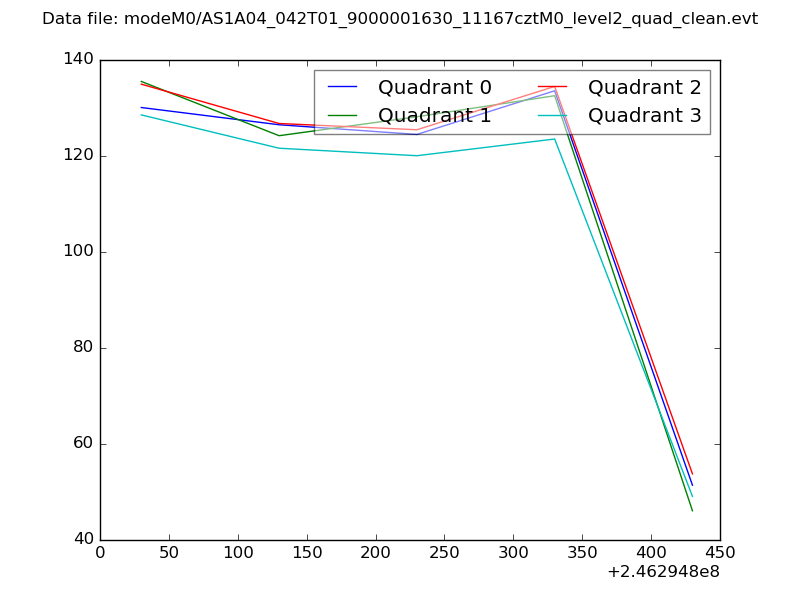 |
|
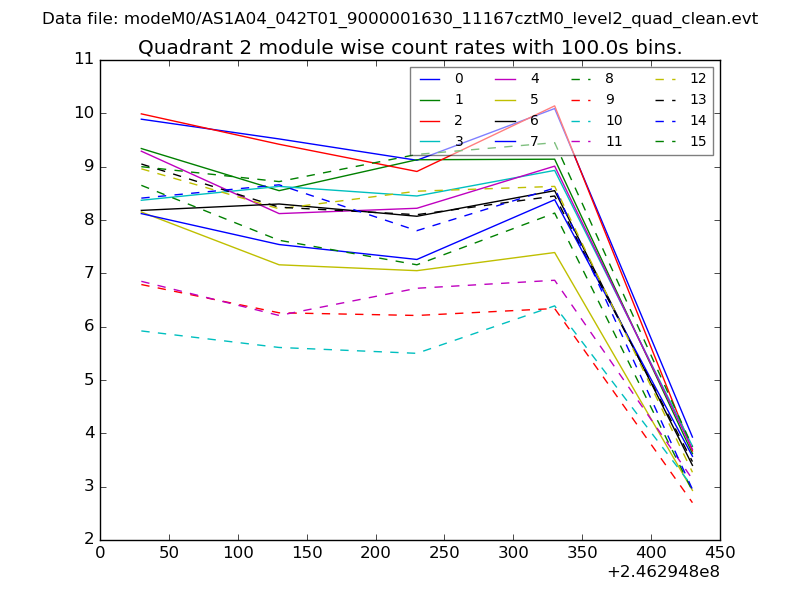
| Module-wise count rates for Quadrant A Data is divided into 100 sec bins |
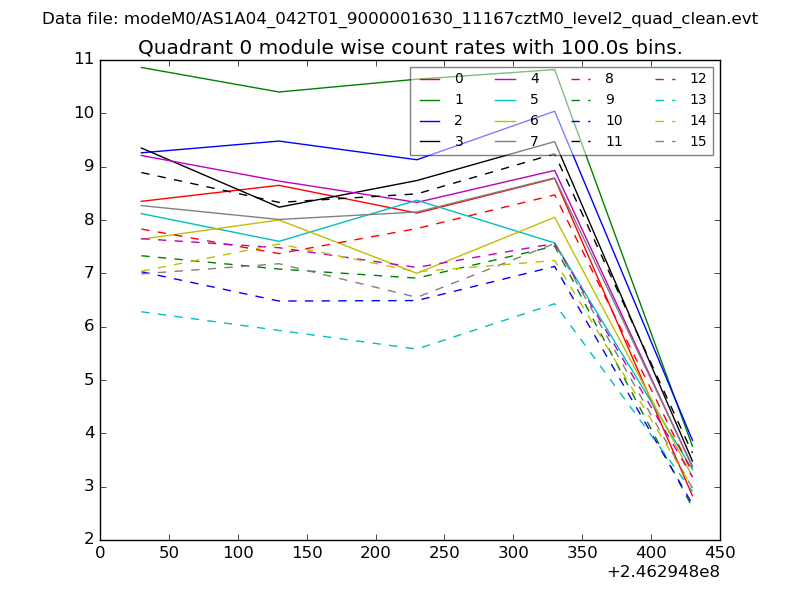 |
 |
| Module-wise count rates for Quadrant B Data is divided into 100 sec bins |
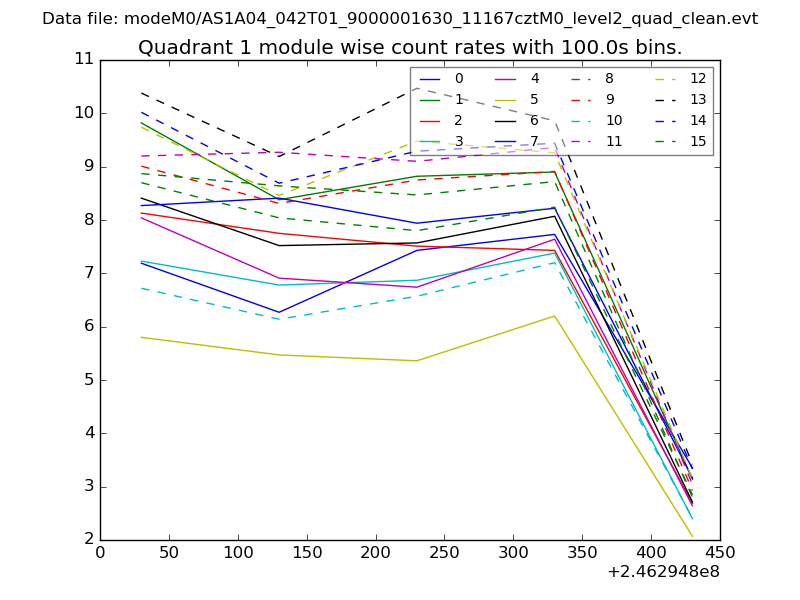 |
 |
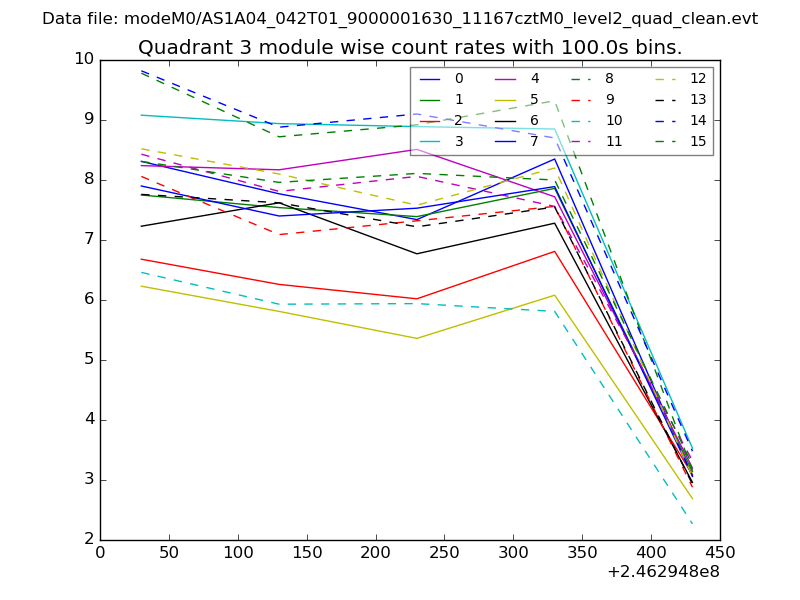
| Module-wise count rates for Quadrant C Data is divided into 100 sec bins |
 |
 |
| Module-wise count rates for Quadrant D Data is divided into 100 sec bins |
 |
 |
| Parameter | Plot |
|---|---|
| CZT HV Monitor | 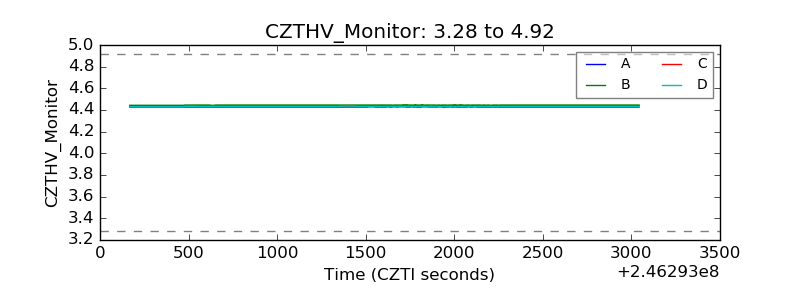 |
| D_VDD | 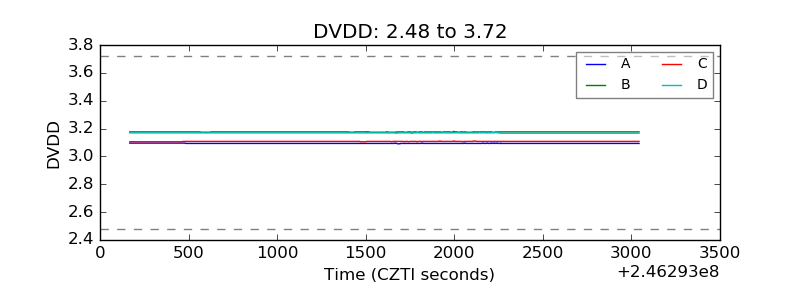 |
| Temperature 1 | 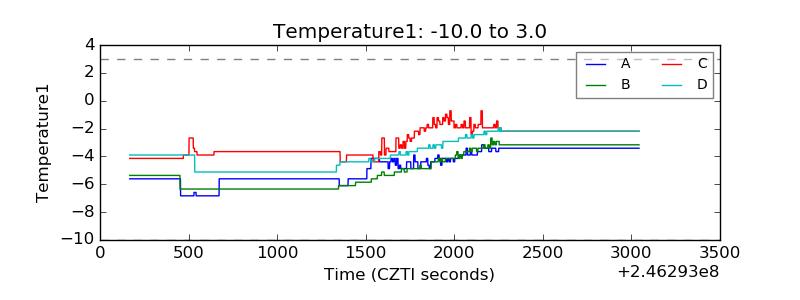 |
| Veto HV Monitor | 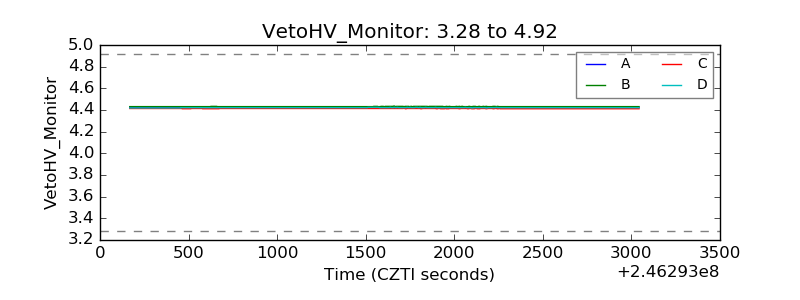 |
| Veto LLD | 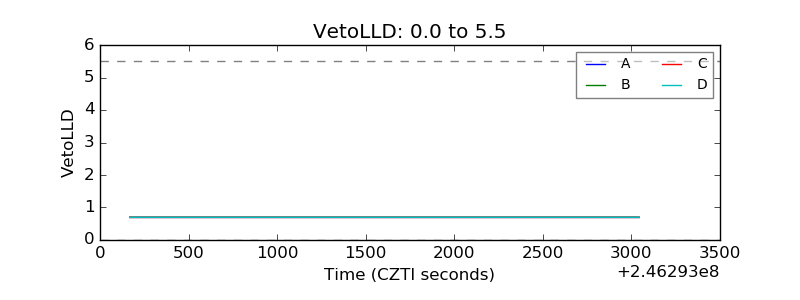 |
| Alpha Counter | 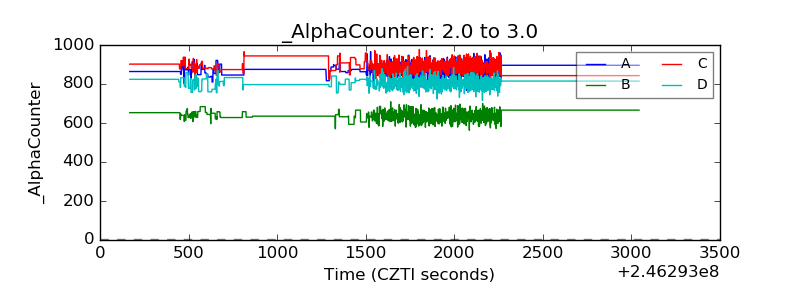 |
| _CPM_Rate | 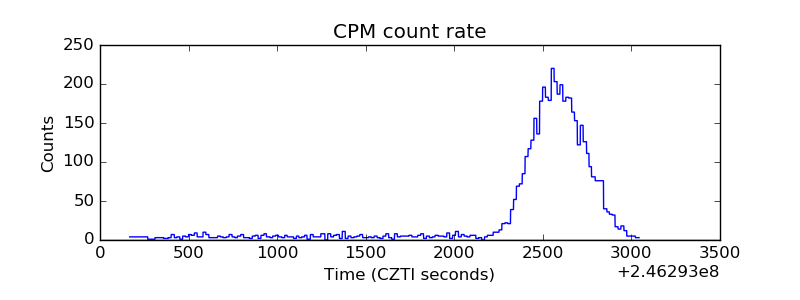 |
| CZT Counter |  |
| +2.5 Volts monitor |  |
| +5 Volts monitor | 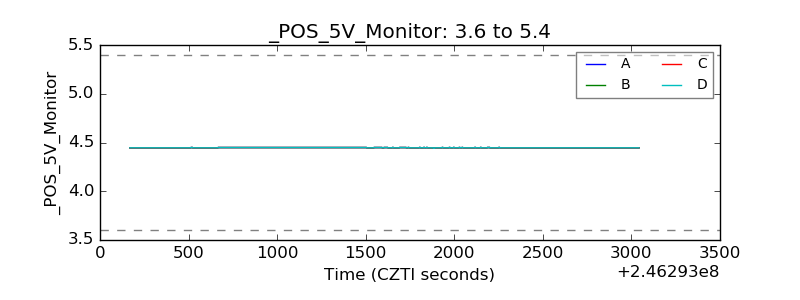 |
| _ROLL_ROT | 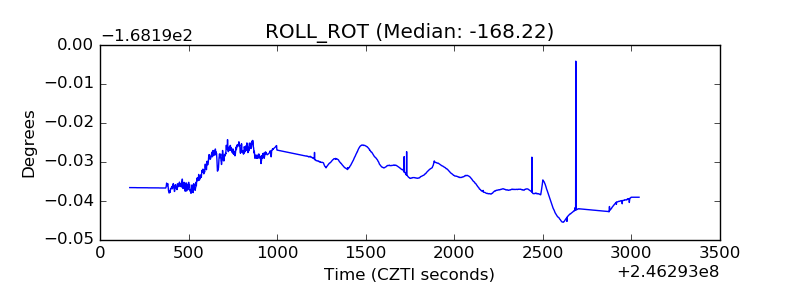 |
| _Roll_DEC | 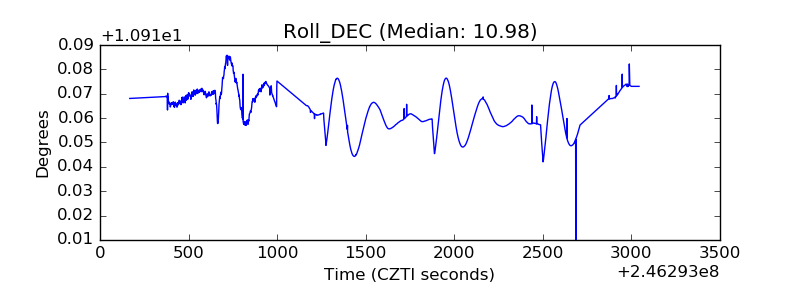 |
| _Roll_RA | 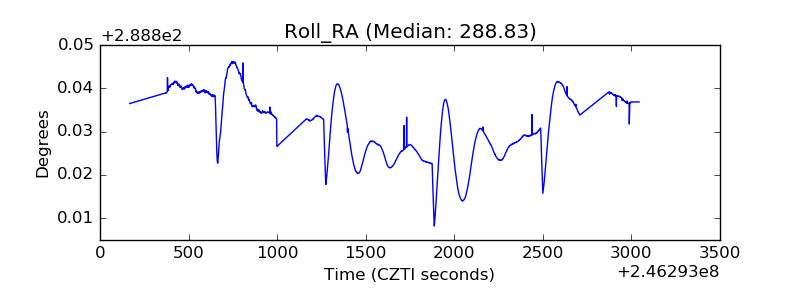 |
| Veto Counter | 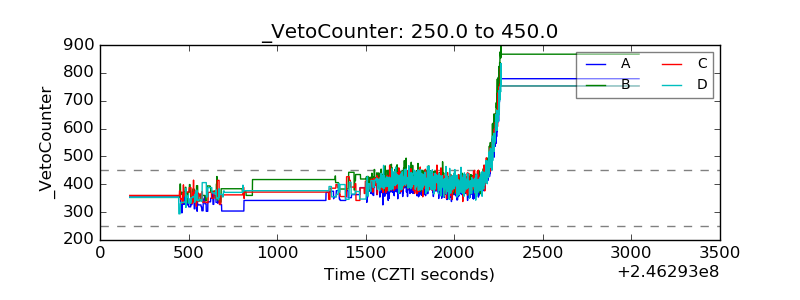 |