| Param | Original file | Final file |
|---|---|---|
| Filename | modeM0/AS1A04_042T01_9000001630_11168cztM0_level2.evt | modeM0/AS1A04_042T01_9000001630_11168cztM0_level2_quad_clean.evt |
| Size (bytes) | 1,591,894,080 | 193,199,040 |
| Size | 1.5 GB | 184.2 MB |
| Events in quadrant A | 13,034,076 | 1,159,192 |
| Events in quadrant B | 10,915,894 | 1,205,640 |
| Events in quadrant C | 7,474,858 | 1,214,166 |
| Events in quadrant D | 15,643,229 | 1,100,503 |
| Mode SS | |||
|---|---|---|---|
| Quadrant | BADHDUFLAG | Total packets | Discarded packets |
| A | 0 | 352 | 0 |
| B | 0 | 352 | 2 |
| C | 0 | 352 | 4 |
| D | 0 | 352 | 2 |
| Mode M9 | |||
|---|---|---|---|
| Quadrant | BADHDUFLAG | Total packets | Discarded packets |
| A | 0 | 20 | 3 |
| B | 0 | 20 | 3 |
| C | 0 | 20 | 3 |
| D | 0 | 20 | 3 |
| Mode M0 | |||
|---|---|---|---|
| Quadrant | BADHDUFLAG | Total packets | Discarded packets |
| A | 0 | 50809 | 695 |
| B | 0 | 44304 | 752 |
| C | 0 | 34941 | 469 |
| D | 0 | 59642 | 1113 |
| Quadrant | Total seconds | Saturated seconds | Saturation percentage |
|---|---|---|---|
| A | 16961 | 1290 | 7.605684% |
| B | 16966 | 733 | 4.320406% |
| C | 16994 | 52 | 0.305990% |
| D | 16926 | 806 | 4.761905% |
Noise dominated data is calculated using 1-second bins in cleaned event files. If a bin has >2000 counts, and if more than 50% of those come from <1% of pixels, then it is considered to be noise-dominated and hence unusable.
| Quadrant | # 1 sec bins | Bins with >0 counts | Bins with >2000 counts | High rate bins dominated by noise | Noise dominated (total time) | Noise dominated (detector-on time) | Marked lightcurve |
|---|---|---|---|---|---|---|---|
| A | 19265 | 17035 | 787 | 787 | 4.09% | 4.62% | 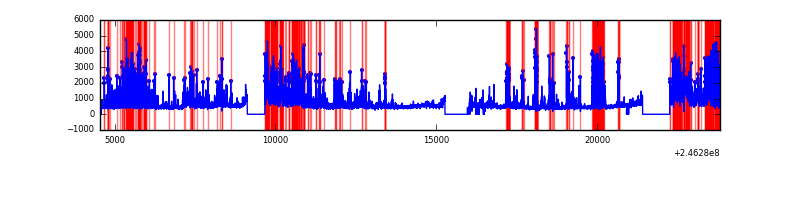 |
| B | 19249 | 17032 | 350 | 350 | 1.82% | 2.05% | 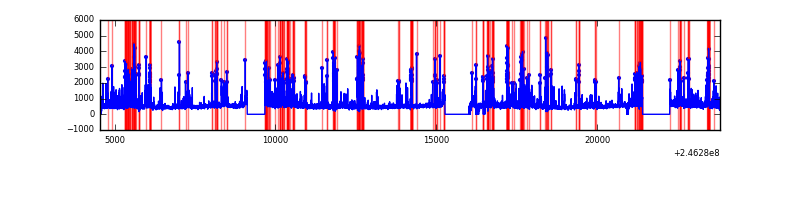 |
| C | 19255 | 17071 | 0 | 0 | 0.00% | 0.00% | 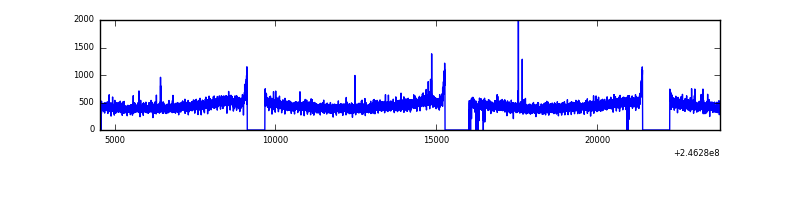 |
| D | 19242 | 16999 | 864 | 864 | 4.49% | 5.08% |  |
Top three noisy pixels from each quadrant. If the there are fewer than three noisy pixels in the level2.evt file, extra rows are filled as -1
| Pixel properties | Quadrant properties | ||||||
|---|---|---|---|---|---|---|---|
| Quadrant | DetID | PixID | Counts | Sigma | Mean | Median | Sigma |
| A | 14 | 238 | 2715582 | 6976.47 | 1910 | 1867 | 389.0 |
| A | 8 | 5 | 1911108 | 4908.32 | 1910 | 1867 | 389.0 |
| A | 8 | 15 | 980350 | 2515.5 | 1910 | 1867 | 389.0 |
| B | 4 | 239 | 1433819 | 3857.05 | 1951 | 1904 | 371.2 |
| B | 10 | 16 | 721599 | 1938.59 | 1951 | 1904 | 371.2 |
| B | 11 | 51 | 284590 | 761.45 | 1951 | 1904 | 371.2 |
| C | 13 | 61 | 14510 | 28.23 | 1912 | 1920 | 445.9 |
| C | 14 | 234 | 10939 | 20.22 | 1912 | 1920 | 445.9 |
| C | 5 | 128 | 7309 | 12.08 | 1912 | 1920 | 445.9 |
| D | 10 | 157 | 6982193 | 15409.35 | 1869 | 1815 | 453.0 |
| D | 2 | 14 | 457300 | 1005.49 | 1869 | 1815 | 453.0 |
| D | 1 | 52 | 294897 | 646.98 | 1869 | 1815 | 453.0 |
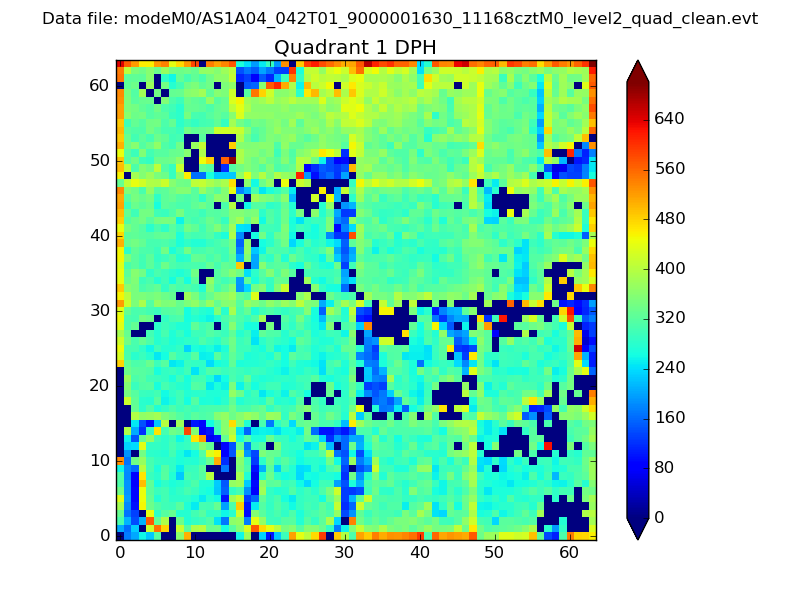
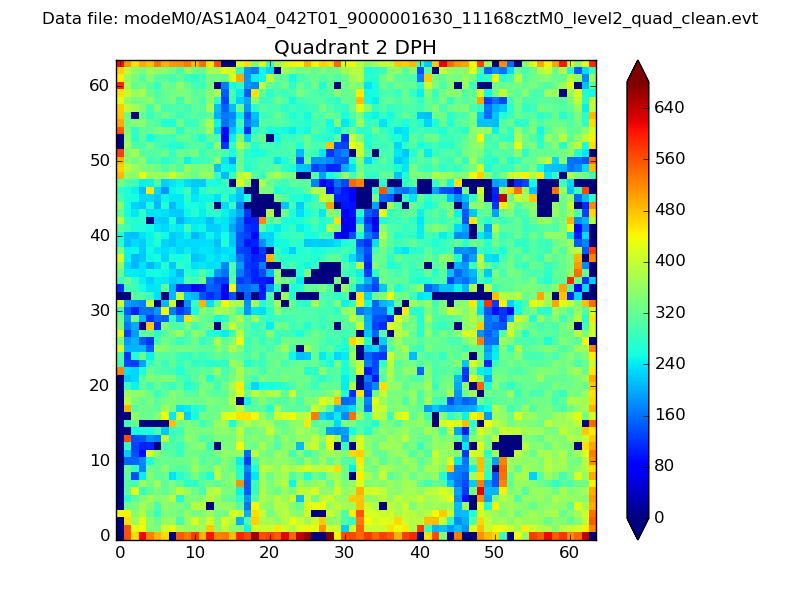
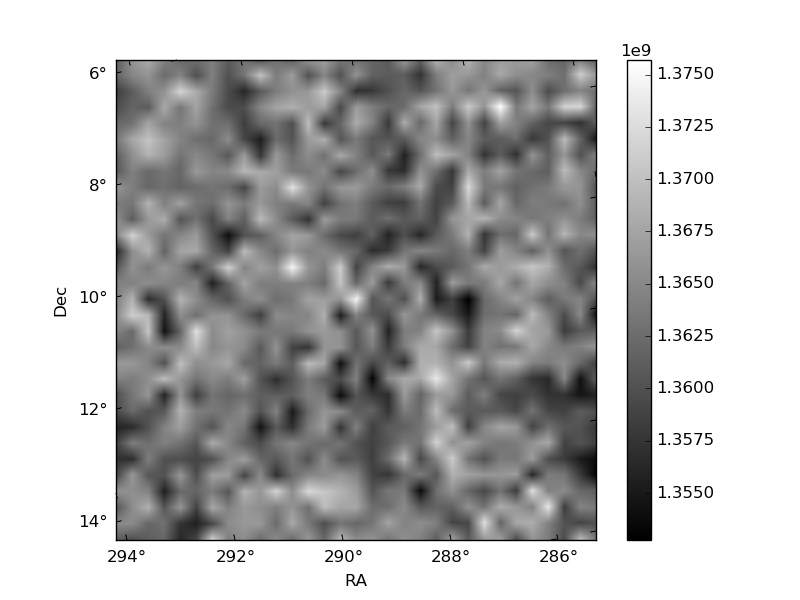
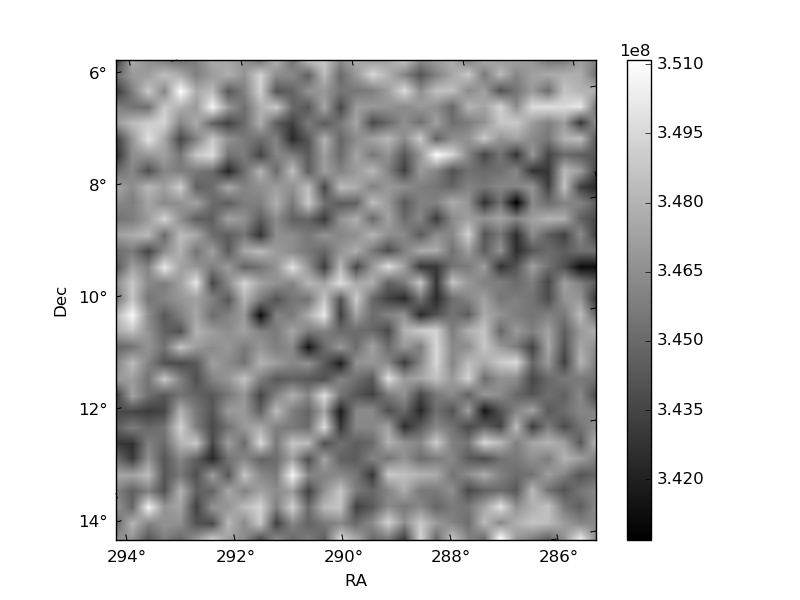
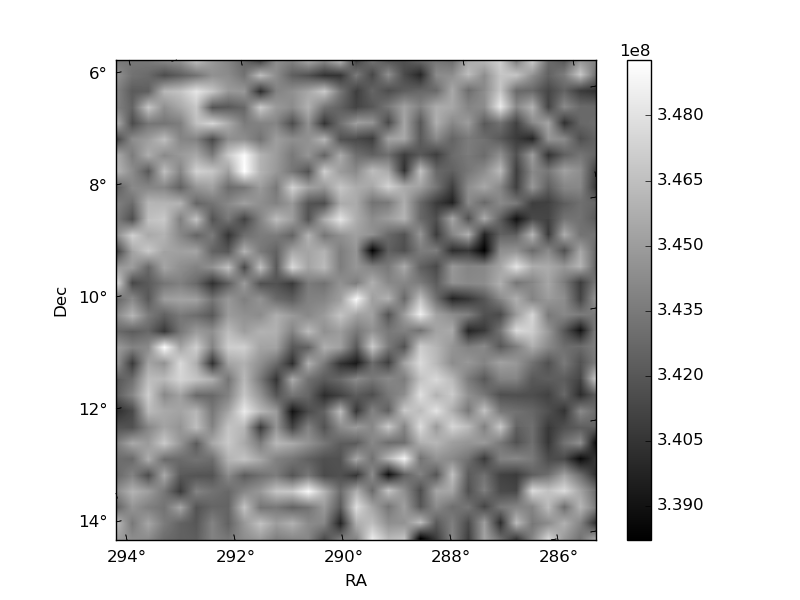
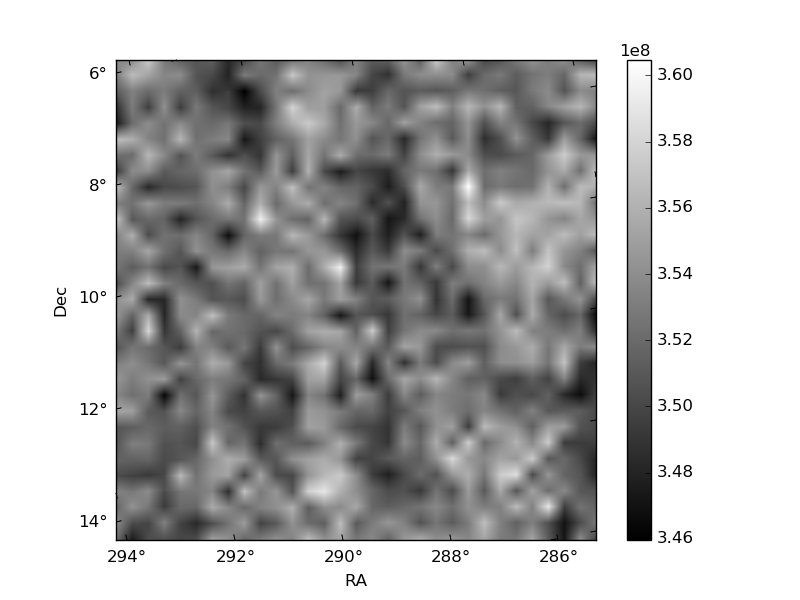
Histogram calculated using DETX and DETY for each event in the final _common_clean file
| Quadrant A | 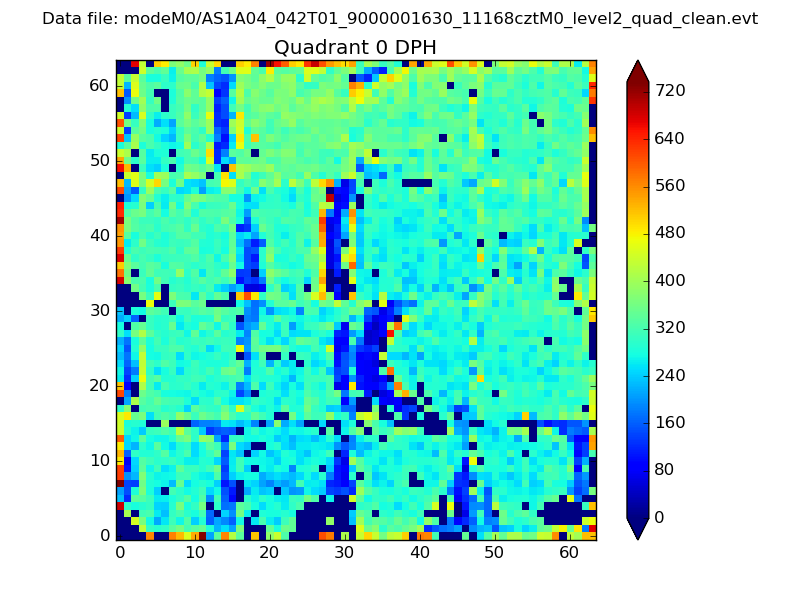 |
 |
Quadrant B |
|---|---|---|---|
| Quadrant D | 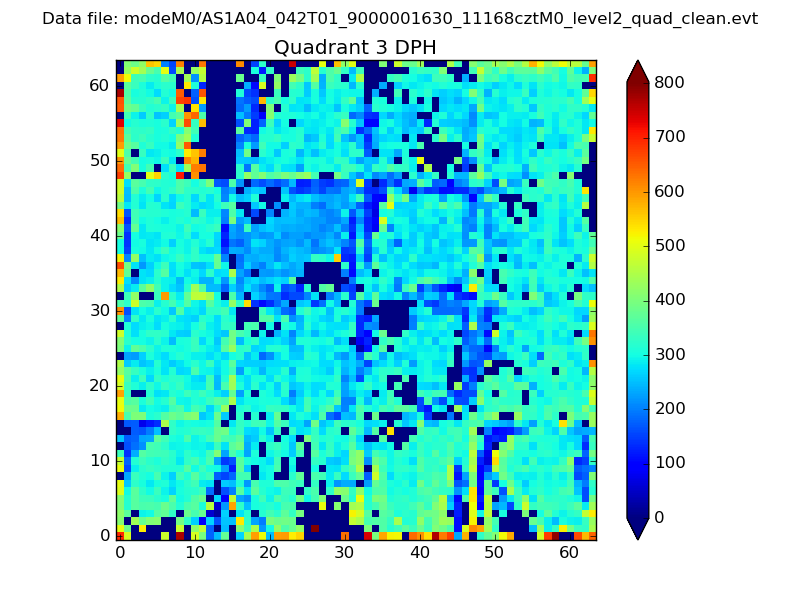 |
 |
Quadrant C |
| Plot type | Count rate plots | Images |
|---|---|---|
| Comparison with Poisson distribution Blue bars denote a histogram of data divided into 1 sec bins. Red curve is a Poisson curve with rate = median count rate of data. |
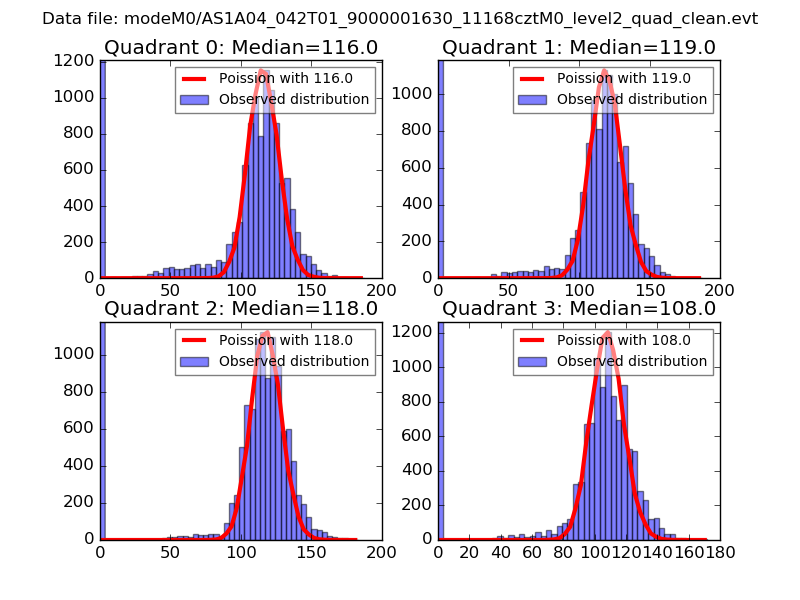 |
 |
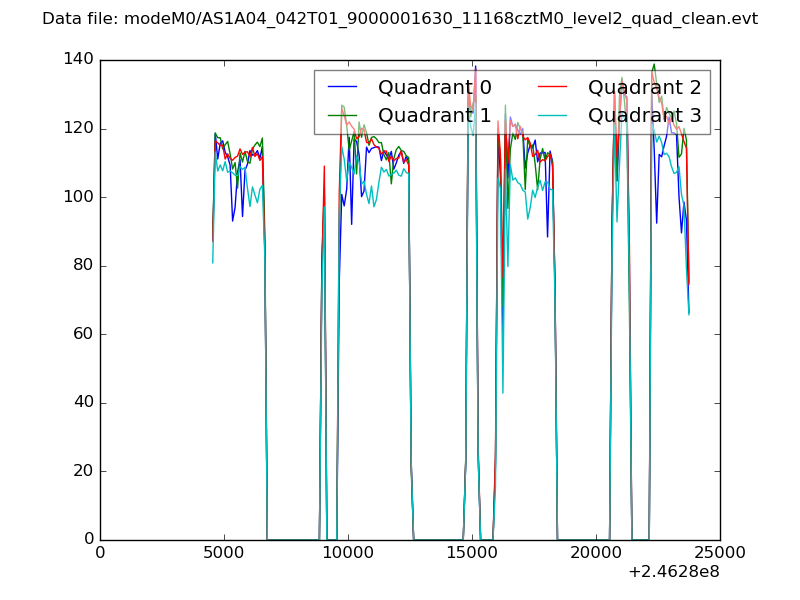
| Quadrant-wise count rates Data is divided into 100 sec bins |
 |
|
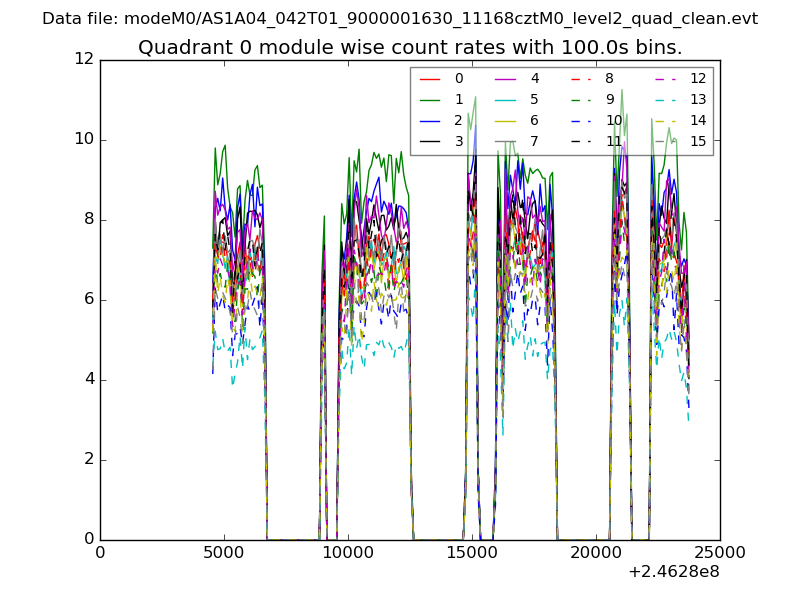
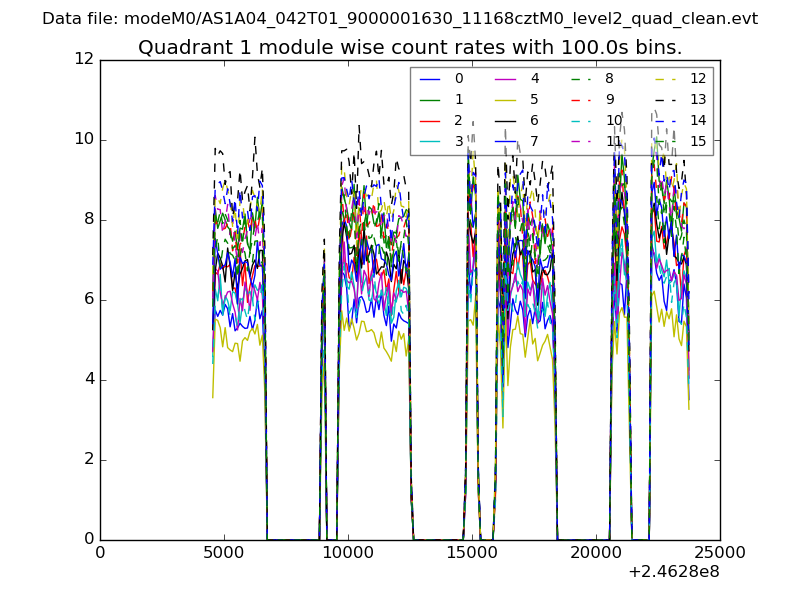
| Module-wise count rates for Quadrant A Data is divided into 100 sec bins |
 |
 |
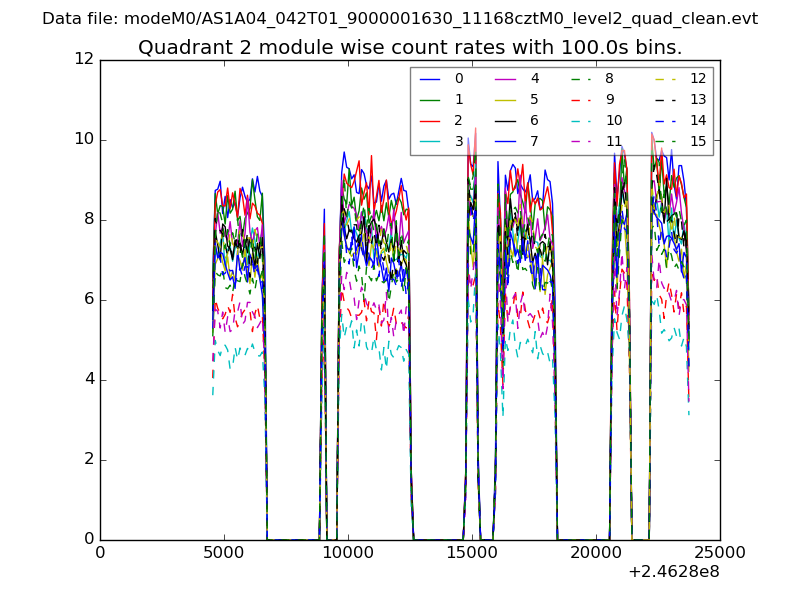
| Module-wise count rates for Quadrant B Data is divided into 100 sec bins |
 |
 |
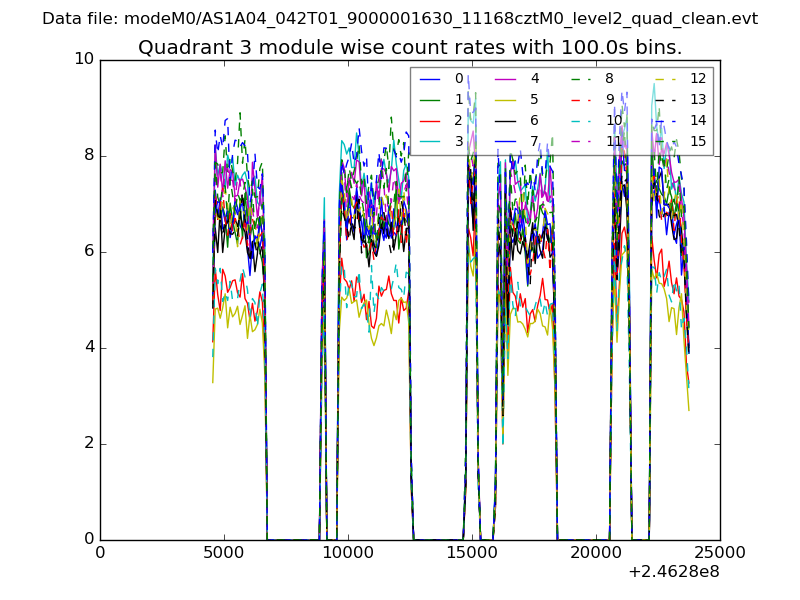
| Module-wise count rates for Quadrant C Data is divided into 100 sec bins |
 |
 |
| Module-wise count rates for Quadrant D Data is divided into 100 sec bins |
 |
 |
| Parameter | Plot |
|---|---|
| CZT HV Monitor | 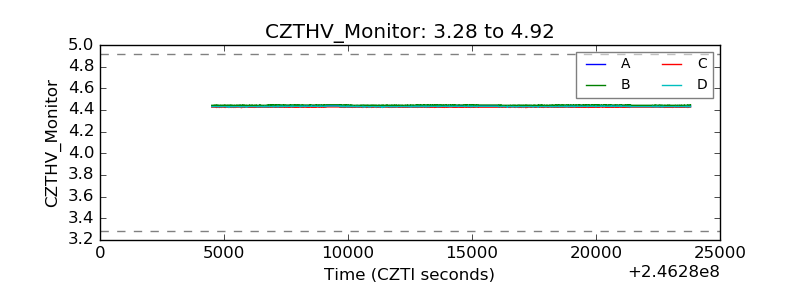 |
| D_VDD | 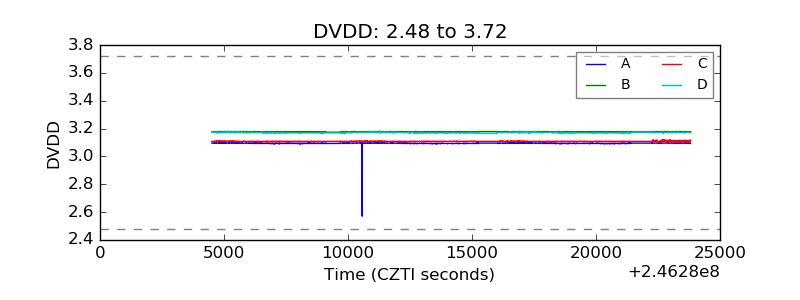 |
| Temperature 1 | 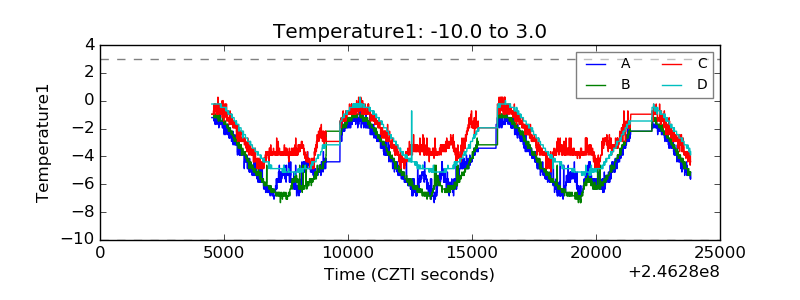 |
| Veto HV Monitor | 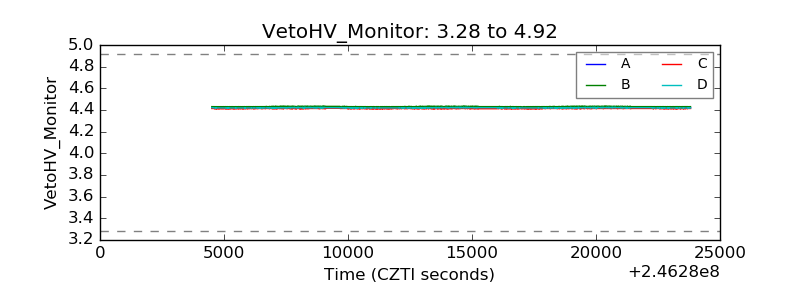 |
| Veto LLD | 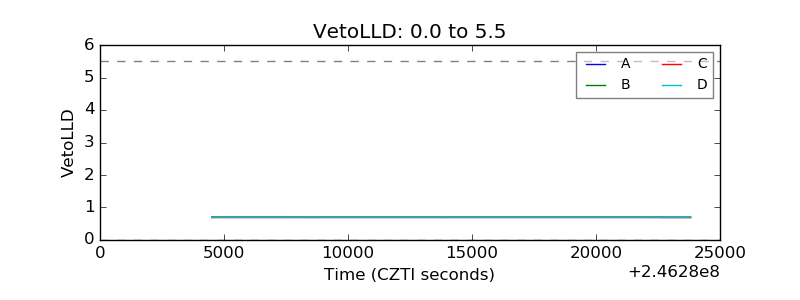 |
| Alpha Counter | 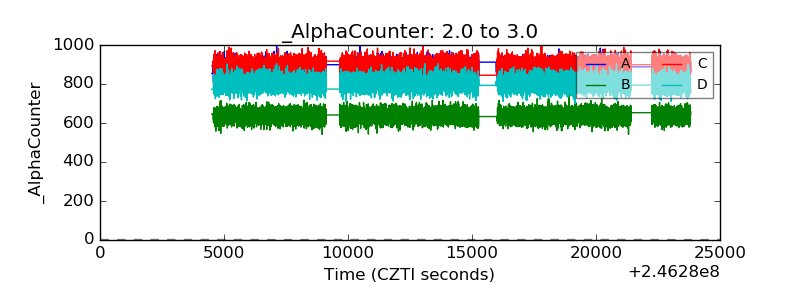 |
| _CPM_Rate | 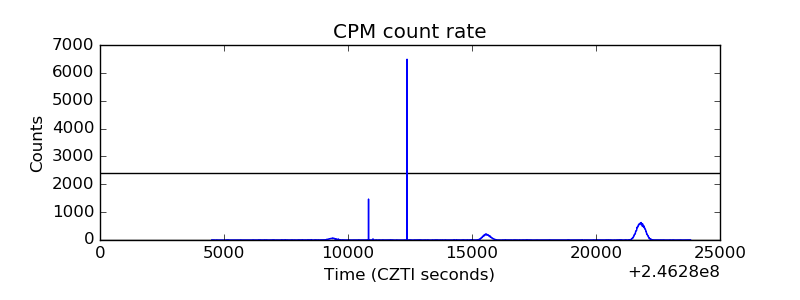 |
| CZT Counter | 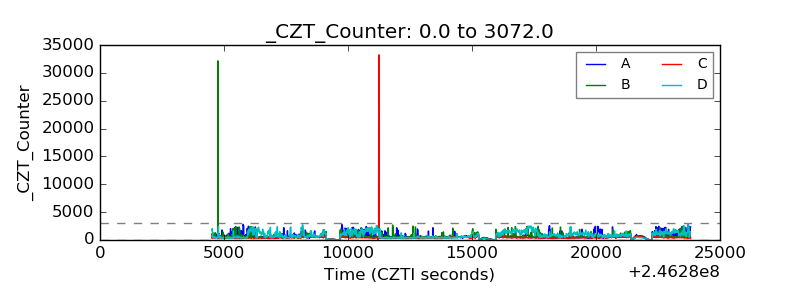 |
| +2.5 Volts monitor | 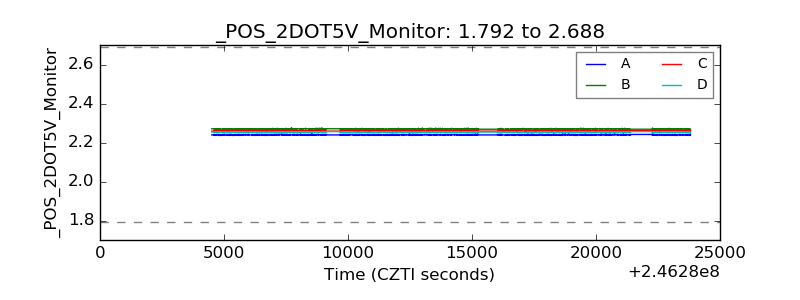 |
| +5 Volts monitor |  |
| _ROLL_ROT | 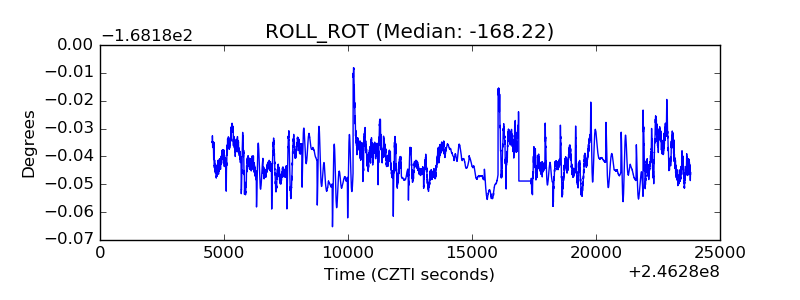 |
| _Roll_DEC | 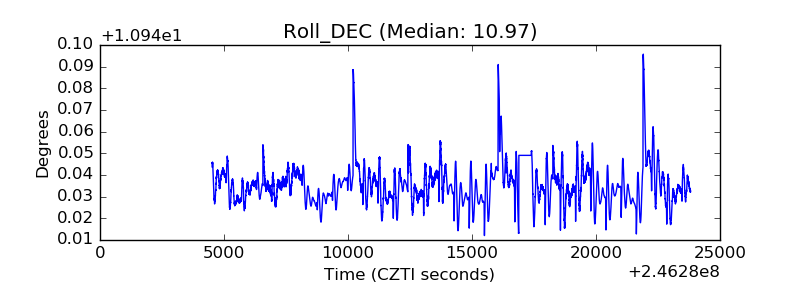 |
| _Roll_RA | 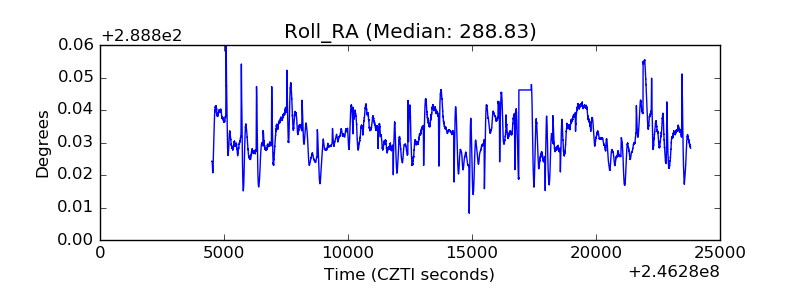 |
| Veto Counter | 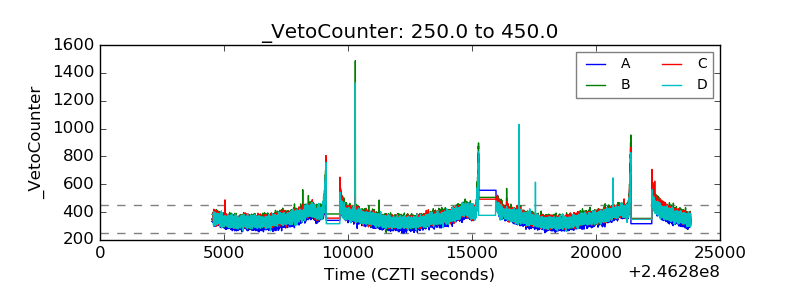 |