| Param | Original file | Final file |
|---|---|---|
| Filename | modeM0/AS1A04_042T01_9000001630_11169cztM0_level2.evt | modeM0/AS1A04_042T01_9000001630_11169cztM0_level2_quad_clean.evt |
| Size (bytes) | 540,109,440 | 66,415,680 |
| Size | 515.1 MB | 63.3 MB |
| Events in quadrant A | 5,466,910 | 366,972 |
| Events in quadrant B | 3,637,525 | 429,536 |
| Events in quadrant C | 2,509,450 | 428,568 |
| Events in quadrant D | 4,362,129 | 391,834 |
| Mode SS | |||
|---|---|---|---|
| Quadrant | BADHDUFLAG | Total packets | Discarded packets |
| A | 0 | 122 | 6 |
| B | 0 | 122 | 10 |
| C | 0 | 120 | 4 |
| D | 0 | 120 | 6 |
| Mode M9 | |||
|---|---|---|---|
| Quadrant | BADHDUFLAG | Total packets | Discarded packets |
| A | 0 | 10 | 0 |
| B | 0 | 10 | 0 |
| C | 0 | 10 | 0 |
| D | 0 | 10 | 0 |
| Mode M0 | |||
|---|---|---|---|
| Quadrant | BADHDUFLAG | Total packets | Discarded packets |
| A | 0 | 21206 | 1194 |
| B | 0 | 15283 | 751 |
| C | 0 | 11970 | 567 |
| D | 0 | 18303 | 1478 |
| Quadrant | Total seconds | Saturated seconds | Saturation percentage |
|---|---|---|---|
| A | 5615 | 890 | 15.850401% |
| B | 5636 | 222 | 3.938964% |
| C | 5643 | 8 | 0.141769% |
| D | 5615 | 135 | 2.404274% |
Noise dominated data is calculated using 1-second bins in cleaned event files. If a bin has >2000 counts, and if more than 50% of those come from <1% of pixels, then it is considered to be noise-dominated and hence unusable.
| Quadrant | # 1 sec bins | Bins with >0 counts | Bins with >2000 counts | High rate bins dominated by noise | Noise dominated (total time) | Noise dominated (detector-on time) | Marked lightcurve |
|---|---|---|---|---|---|---|---|
| A | 6756 | 5645 | 587 | 587 | 8.69% | 10.40% | 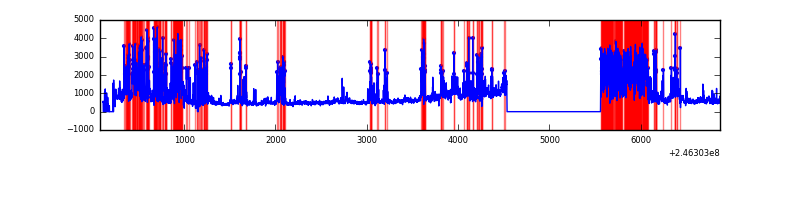 |
| B | 6786 | 5665 | 129 | 129 | 1.90% | 2.28% | 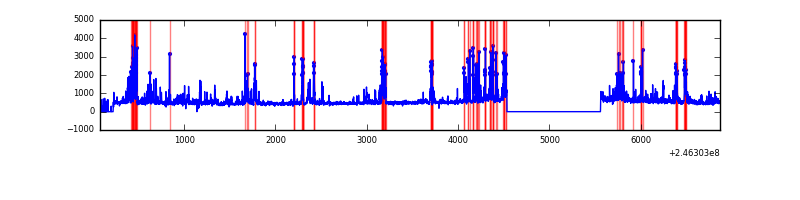 |
| C | 6790 | 5668 | 0 | 0 | 0.00% | 0.00% | 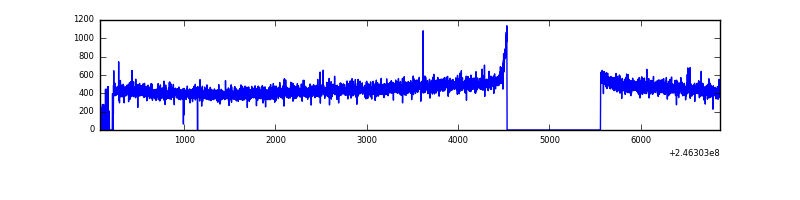 |
| D | 6772 | 5645 | 119 | 119 | 1.76% | 2.11% | 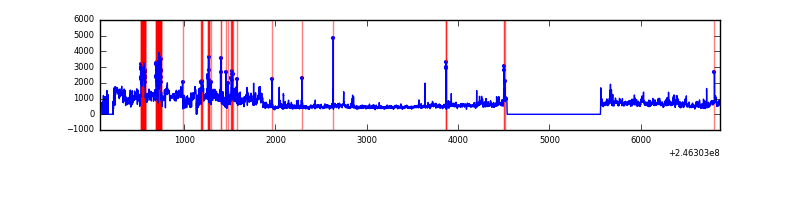 |
Top three noisy pixels from each quadrant. If the there are fewer than three noisy pixels in the level2.evt file, extra rows are filled as -1
| Pixel properties | Quadrant properties | ||||||
|---|---|---|---|---|---|---|---|
| Quadrant | DetID | PixID | Counts | Sigma | Mean | Median | Sigma |
| A | 14 | 238 | 1690286 | 13706.31 | 602 | 589 | 123.3 |
| A | 8 | 15 | 1082800 | 8778.57 | 602 | 589 | 123.3 |
| A | 8 | 5 | 332760 | 2694.47 | 602 | 589 | 123.3 |
| B | 4 | 239 | 695737 | 5609.32 | 653 | 639 | 123.9 |
| B | 15 | 204 | 107079 | 858.95 | 653 | 639 | 123.9 |
| B | 11 | 51 | 91840 | 735.98 | 653 | 639 | 123.9 |
| C | 8 | 128 | 7698 | 47.05 | 639 | 643 | 150.0 |
| C | 13 | 61 | 4862 | 28.14 | 639 | 643 | 150.0 |
| C | 8 | 112 | 4739 | 27.32 | 639 | 643 | 150.0 |
| D | 10 | 157 | 1170532 | 7637.21 | 625 | 607 | 153.2 |
| D | 8 | 195 | 318211 | 2073.3 | 625 | 607 | 153.2 |
| D | 1 | 52 | 304508 | 1983.85 | 625 | 607 | 153.2 |
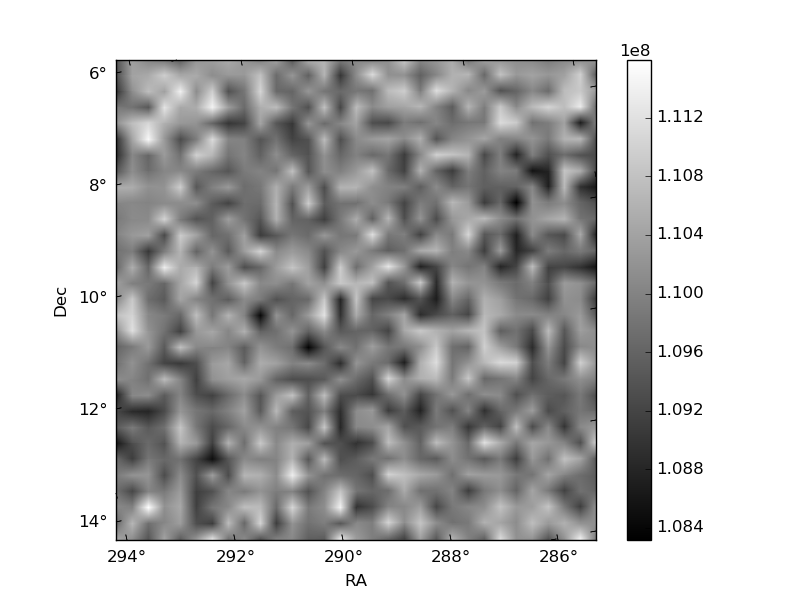
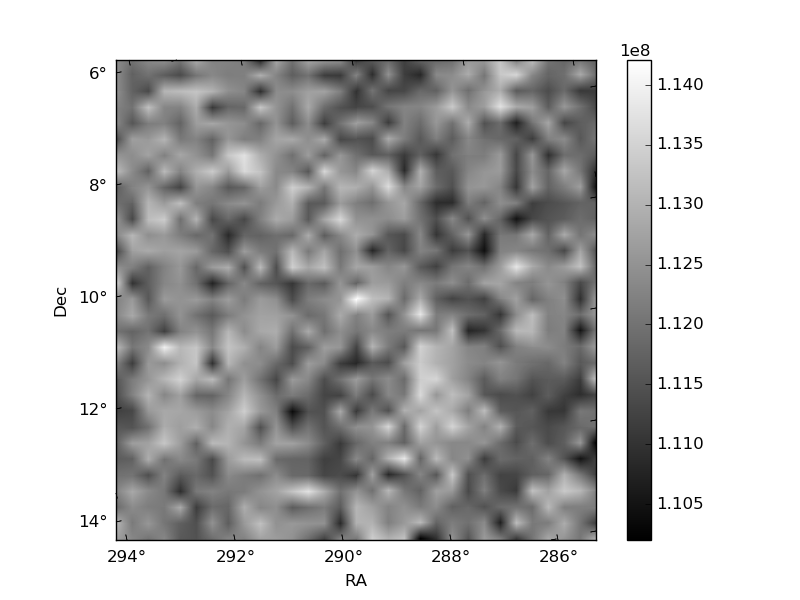
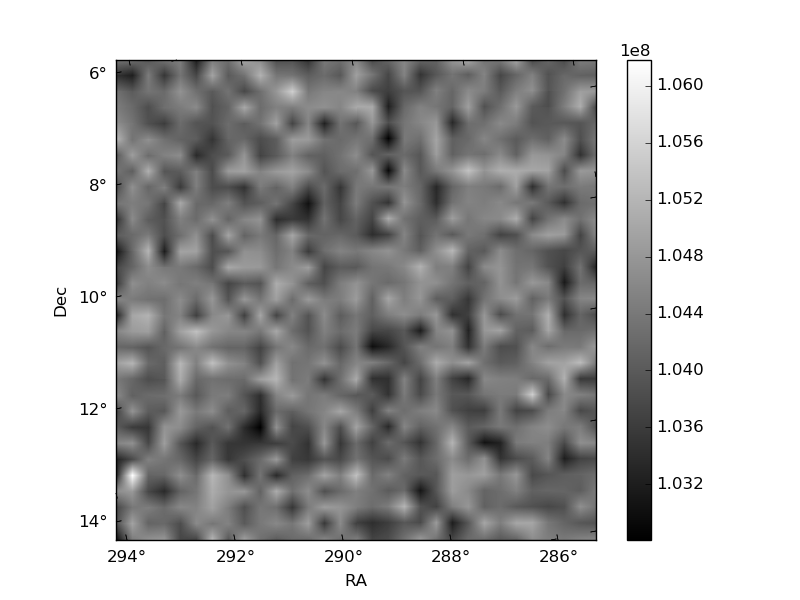
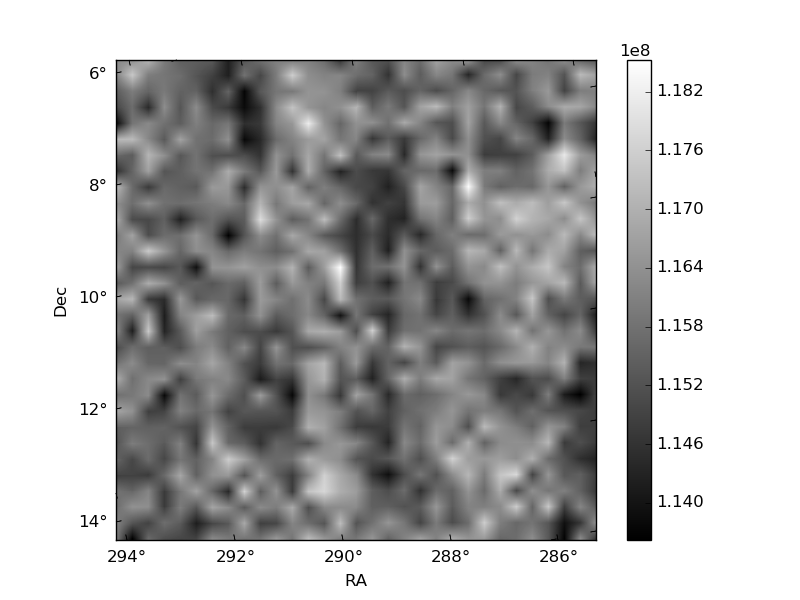
Histogram calculated using DETX and DETY for each event in the final _common_clean file
| Quadrant A | 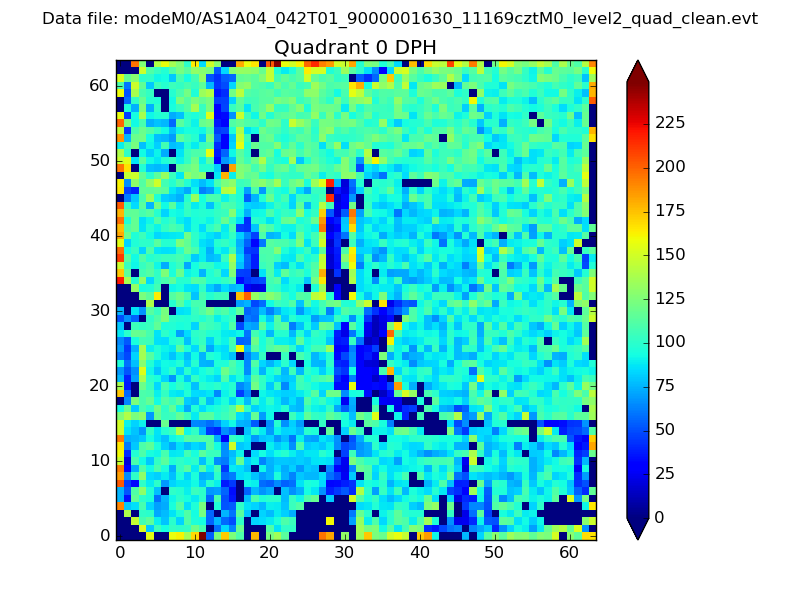 |
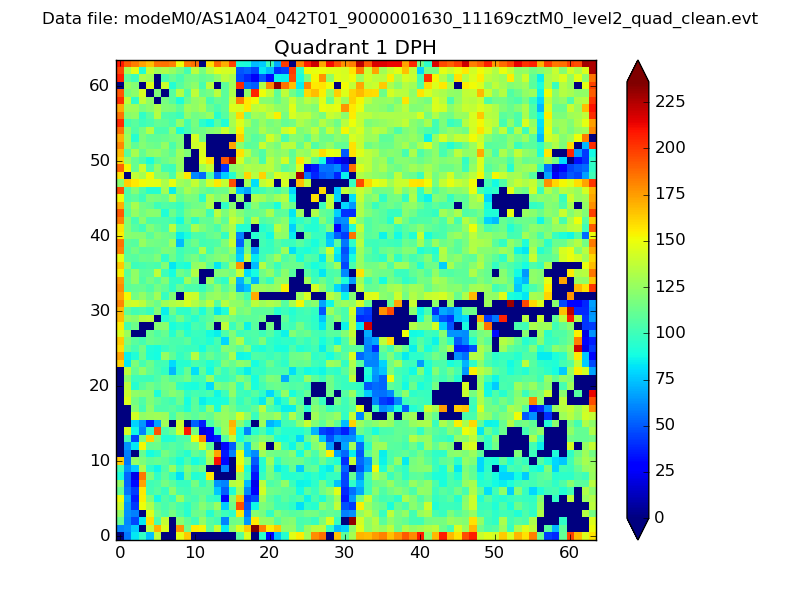 |
Quadrant B |
|---|---|---|---|
| Quadrant D |  |
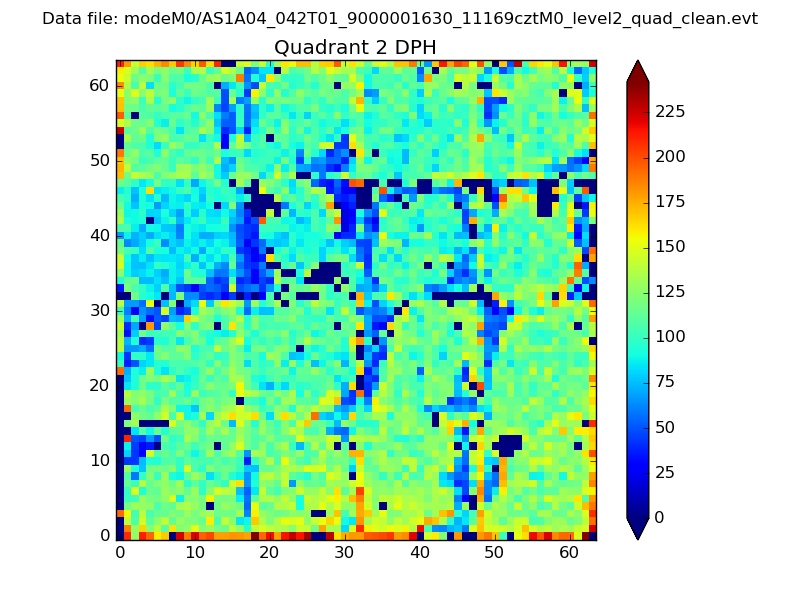 |
Quadrant C |
| Plot type | Count rate plots | Images |
|---|---|---|
| Comparison with Poisson distribution Blue bars denote a histogram of data divided into 1 sec bins. Red curve is a Poisson curve with rate = median count rate of data. |
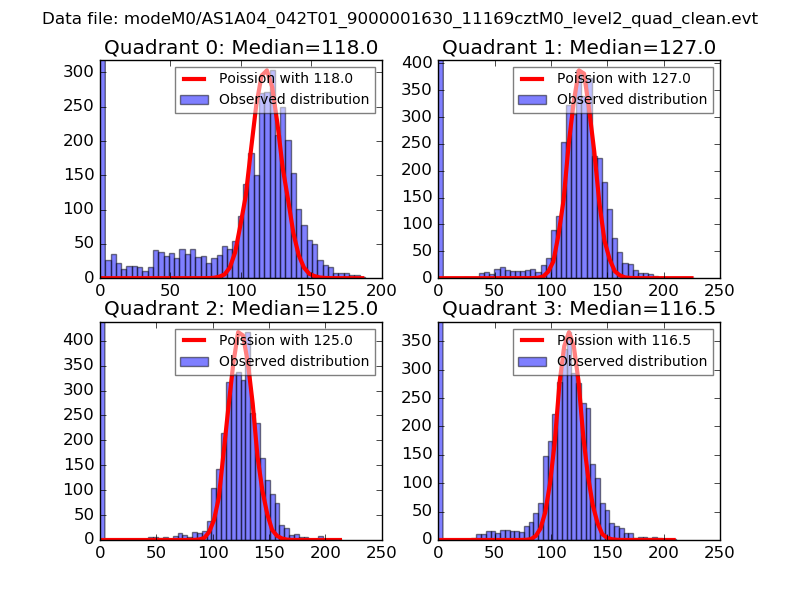 |
 |
| Quadrant-wise count rates Data is divided into 100 sec bins |
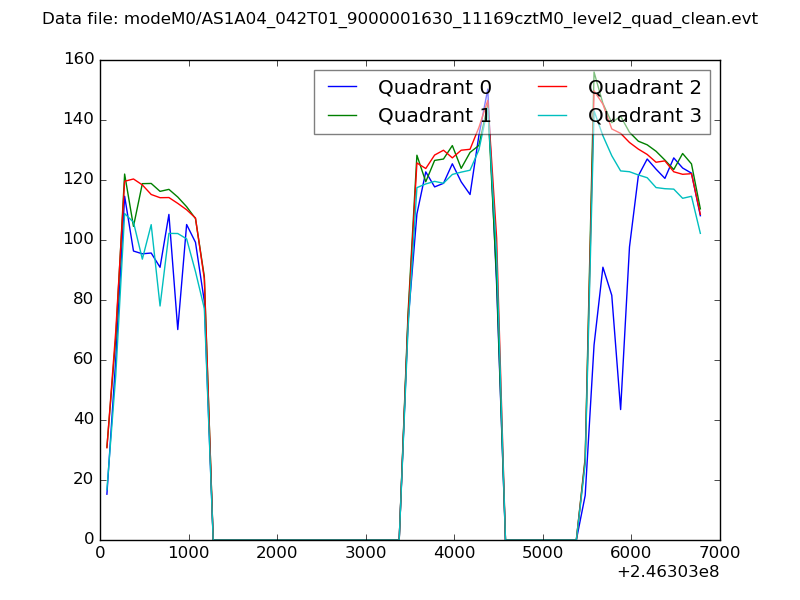 |
|
| Module-wise count rates for Quadrant A Data is divided into 100 sec bins |
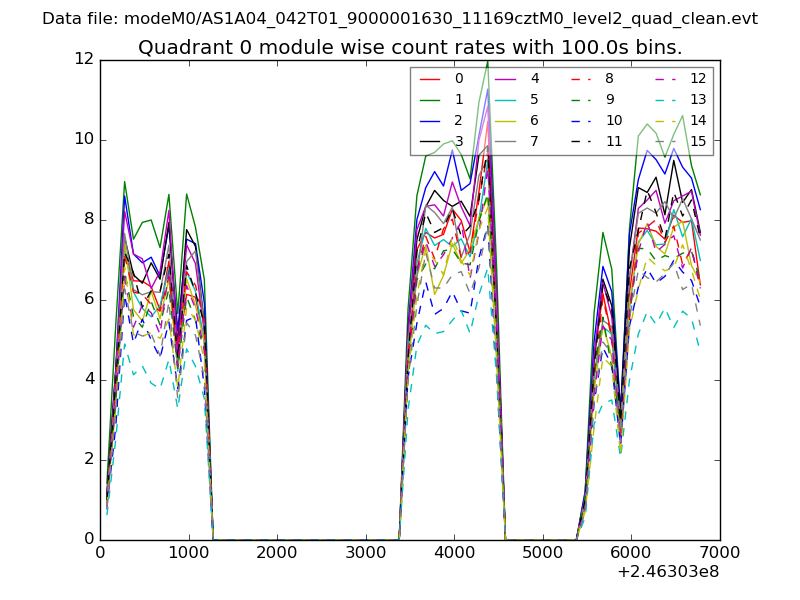 |
 |
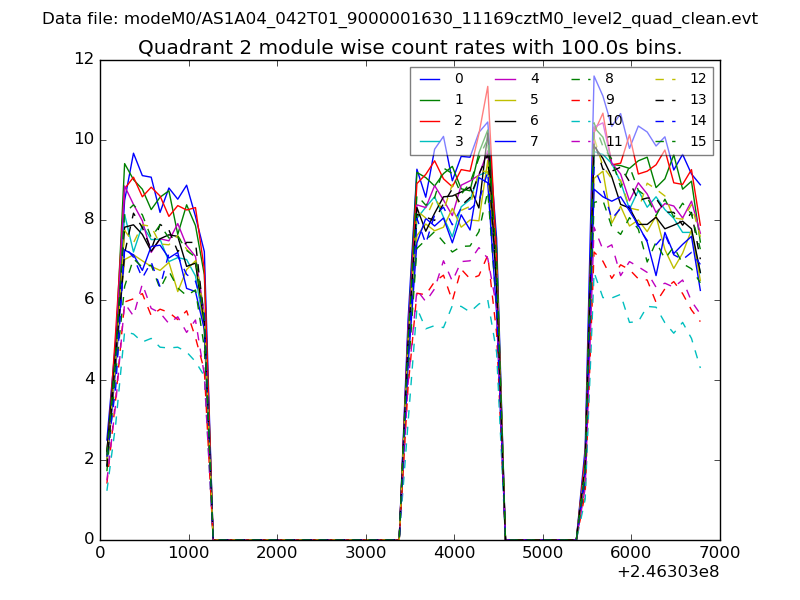
| Module-wise count rates for Quadrant B Data is divided into 100 sec bins |
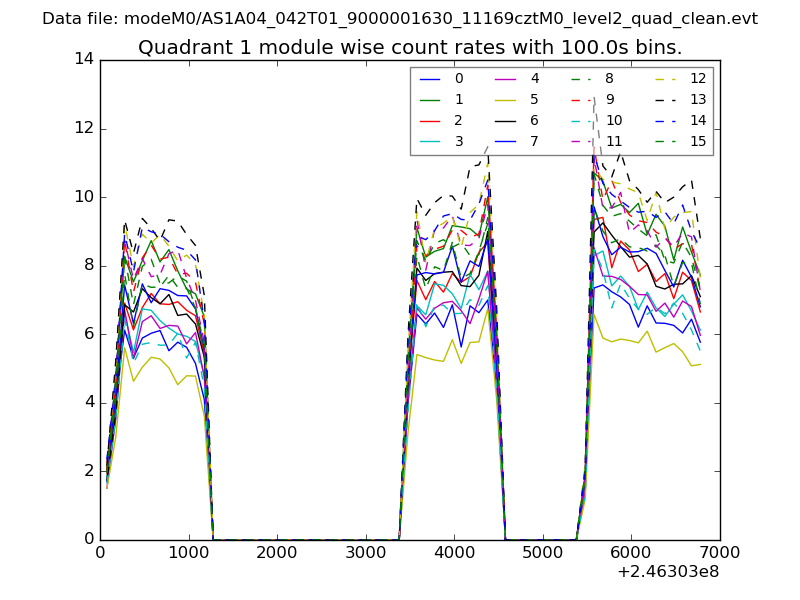 |
 |
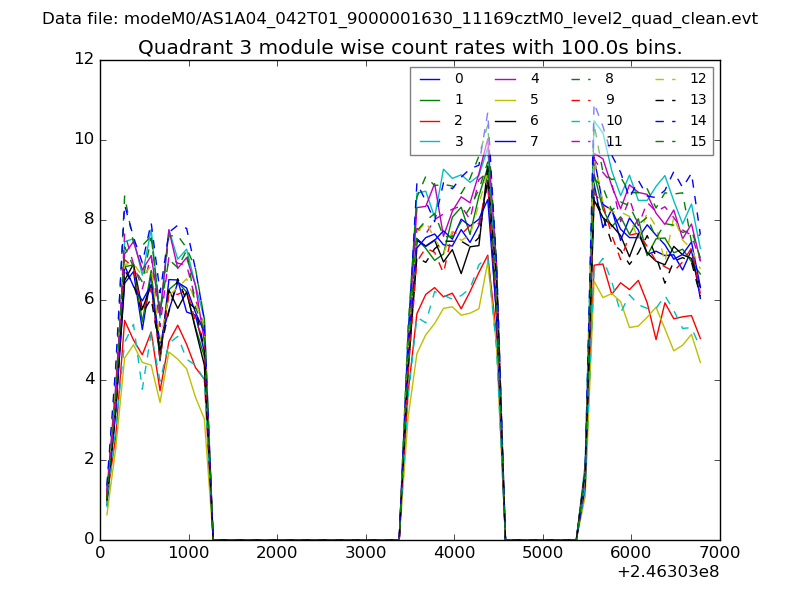
| Module-wise count rates for Quadrant C Data is divided into 100 sec bins |
 |
 |
| Module-wise count rates for Quadrant D Data is divided into 100 sec bins |
 |
 |
| Parameter | Plot |
|---|---|
| CZT HV Monitor | 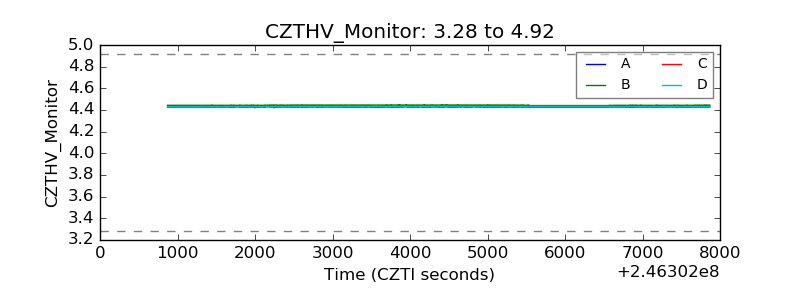 |
| D_VDD | 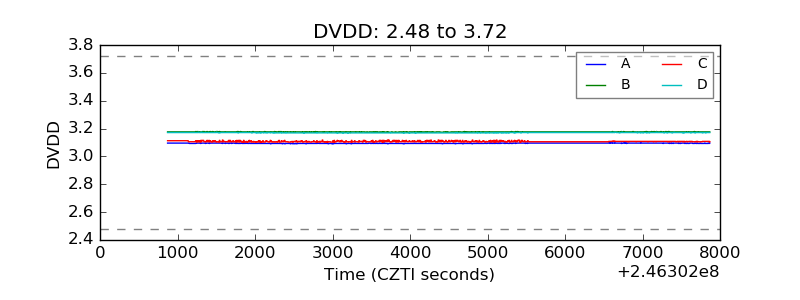 |
| Temperature 1 | 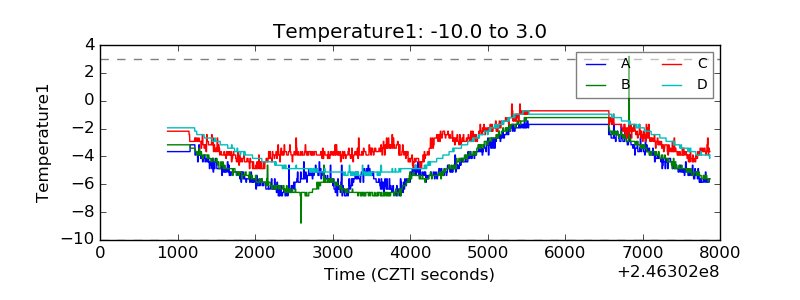 |
| Veto HV Monitor |  |
| Veto LLD | 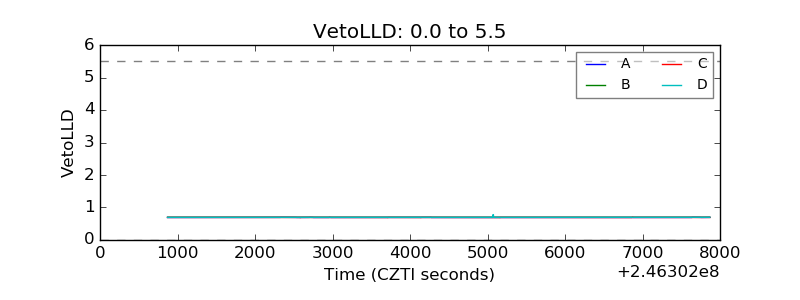 |
| Alpha Counter | 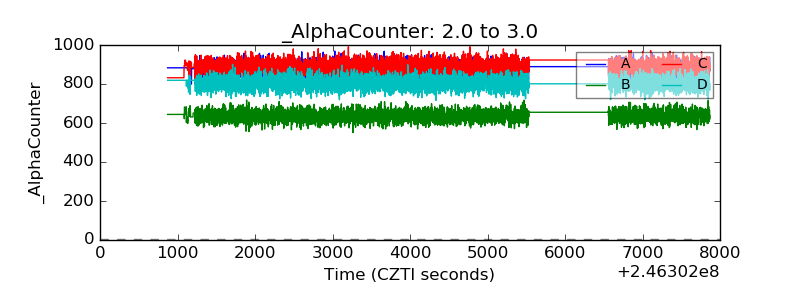 |
| _CPM_Rate | 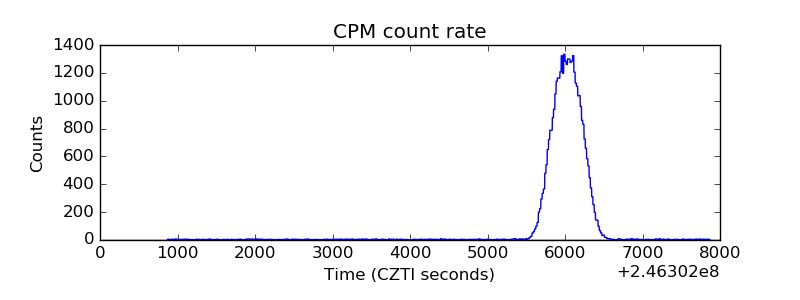 |
| CZT Counter | 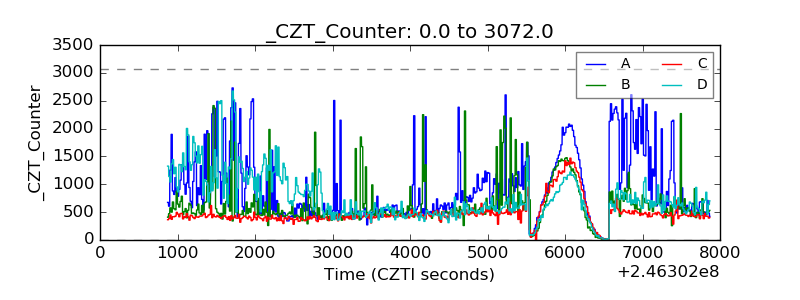 |
| +2.5 Volts monitor |  |
| +5 Volts monitor |  |
| _ROLL_ROT | 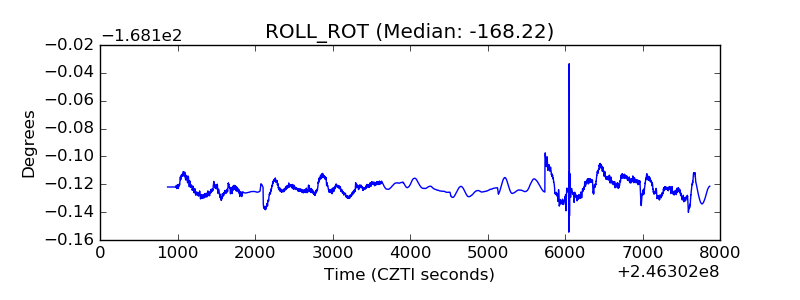 |
| _Roll_DEC | 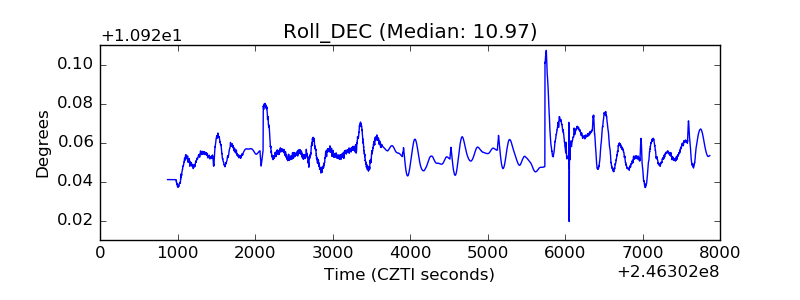 |
| _Roll_RA | 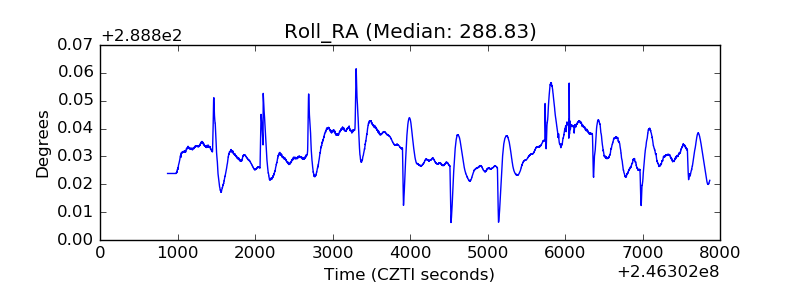 |
| Veto Counter | 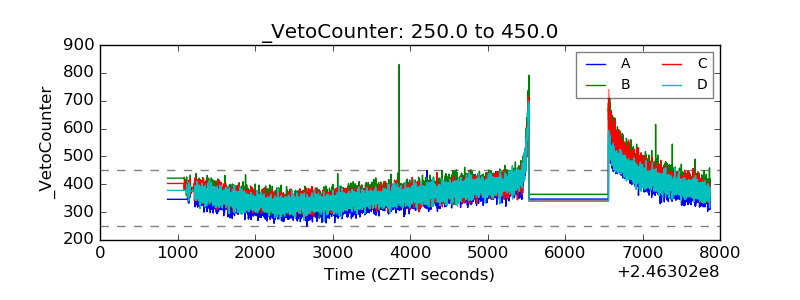 |