| Param | Original file | Final file |
|---|---|---|
| Filename | modeM0/AS1A04_042T01_9000001630_11171cztM0_level2.evt | modeM0/AS1A04_042T01_9000001630_11171cztM0_level2_quad_clean.evt |
| Size (bytes) | 2,576,488,320 | 306,984,960 |
| Size | 2.4 GB | 292.8 MB |
| Events in quadrant A | 23,733,106 | 1,789,354 |
| Events in quadrant B | 17,793,258 | 1,931,223 |
| Events in quadrant C | 12,106,104 | 1,934,708 |
| Events in quadrant D | 22,568,324 | 1,770,222 |
| Mode SS | |||
|---|---|---|---|
| Quadrant | BADHDUFLAG | Total packets | Discarded packets |
| A | 0 | 562 | 8 |
| B | 0 | 562 | 6 |
| C | 0 | 562 | 6 |
| D | 0 | 562 | 6 |
| Mode M9 | |||
|---|---|---|---|
| Quadrant | BADHDUFLAG | Total packets | Discarded packets |
| A | 0 | 41 | 0 |
| B | 0 | 41 | 0 |
| C | 0 | 41 | 0 |
| D | 0 | 41 | 0 |
| Mode M0 | |||
|---|---|---|---|
| Quadrant | BADHDUFLAG | Total packets | Discarded packets |
| A | 0 | 90542 | 1609 |
| B | 0 | 71572 | 863 |
| C | 0 | 55794 | 474 |
| D | 0 | 86878 | 844 |
| Quadrant | Total seconds | Saturated seconds | Saturation percentage |
|---|---|---|---|
| A | 27174 | 2963 | 10.903805% |
| B | 27195 | 1262 | 4.640559% |
| C | 27219 | 78 | 0.286565% |
| D | 27195 | 950 | 3.493289% |
Noise dominated data is calculated using 1-second bins in cleaned event files. If a bin has >2000 counts, and if more than 50% of those come from <1% of pixels, then it is considered to be noise-dominated and hence unusable.
| Quadrant | # 1 sec bins | Bins with >0 counts | Bins with >2000 counts | High rate bins dominated by noise | Noise dominated (total time) | Noise dominated (detector-on time) | Marked lightcurve |
|---|---|---|---|---|---|---|---|
| A | 31656 | 27206 | 1835 | 1835 | 5.80% | 6.74% | 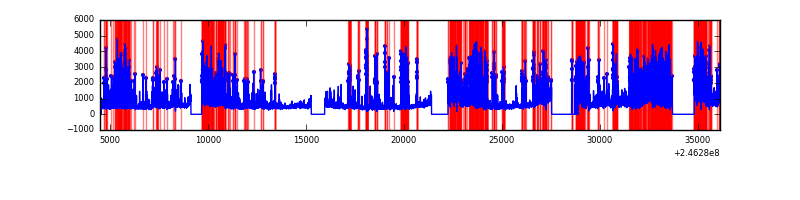 |
| B | 31631 | 27223 | 647 | 647 | 2.05% | 2.38% | 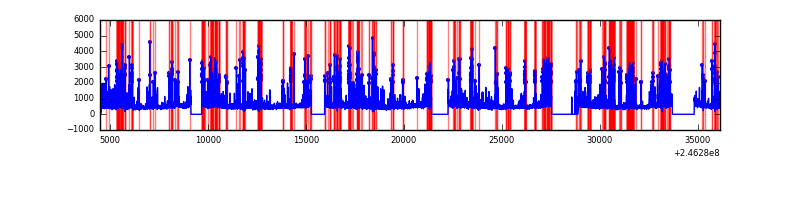 |
| C | 31649 | 27253 | 0 | 0 | 0.00% | 0.00% | 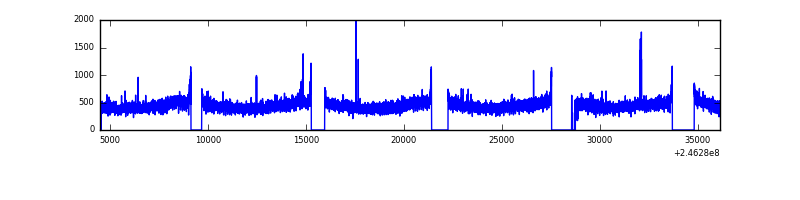 |
| D | 31630 | 27230 | 953 | 953 | 3.01% | 3.50% | 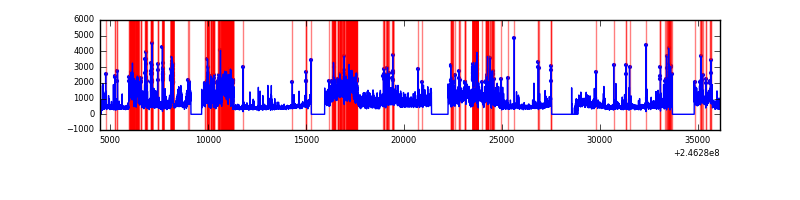 |
Top three noisy pixels from each quadrant. If the there are fewer than three noisy pixels in the level2.evt file, extra rows are filled as -1
| Pixel properties | Quadrant properties | ||||||
|---|---|---|---|---|---|---|---|
| Quadrant | DetID | PixID | Counts | Sigma | Mean | Median | Sigma |
| A | 14 | 238 | 4904417 | 8004.13 | 3034 | 2969 | 612.4 |
| A | 8 | 5 | 3678257 | 6001.8 | 3034 | 2969 | 612.4 |
| A | 8 | 15 | 3206809 | 5231.92 | 3034 | 2969 | 612.4 |
| B | 4 | 239 | 2853449 | 4773.62 | 3154 | 3074 | 597.1 |
| B | 10 | 16 | 929555 | 1551.61 | 3154 | 3074 | 597.1 |
| B | 11 | 51 | 389133 | 646.55 | 3154 | 3074 | 597.1 |
| C | 9 | 204 | 38051 | 48.71 | 3087 | 3103 | 717.5 |
| C | 13 | 61 | 23356 | 28.23 | 3087 | 3103 | 717.5 |
| C | 14 | 234 | 14231 | 15.51 | 3087 | 3103 | 717.5 |
| D | 10 | 157 | 8087606 | 11019.99 | 3032 | 2944 | 733.6 |
| D | 1 | 52 | 567820 | 769.97 | 3032 | 2944 | 733.6 |
| D | 2 | 14 | 520543 | 705.53 | 3032 | 2944 | 733.6 |
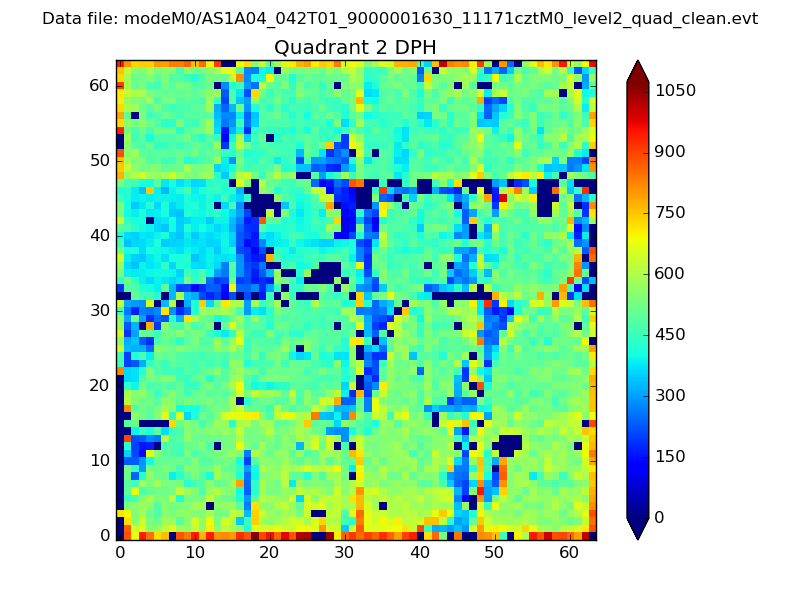
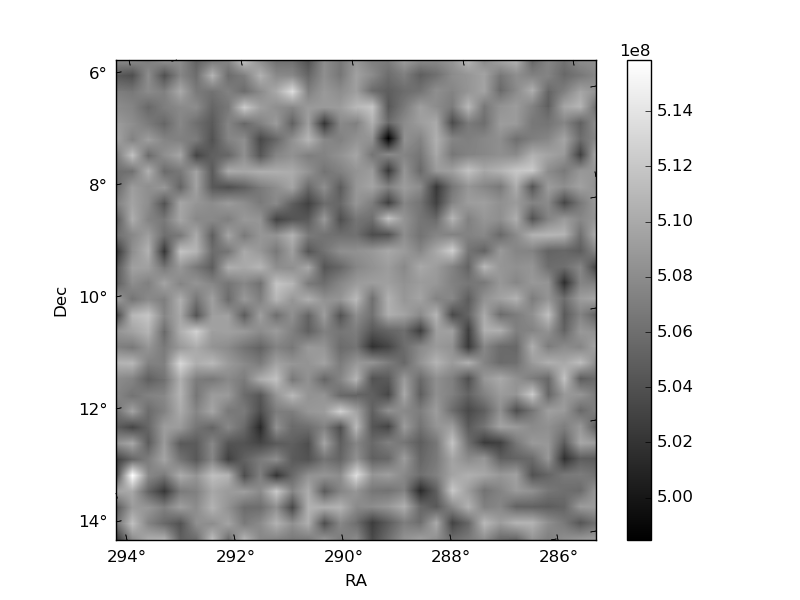
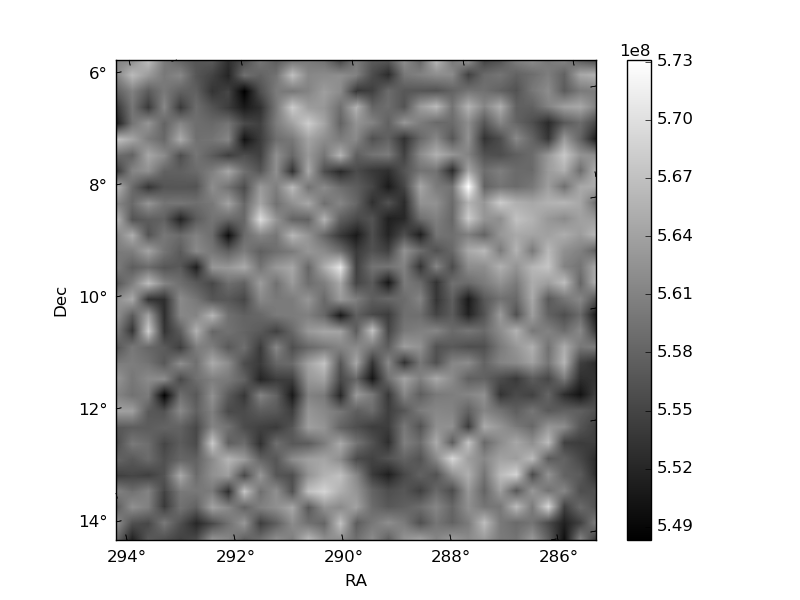
Histogram calculated using DETX and DETY for each event in the final _common_clean file
| Quadrant A | 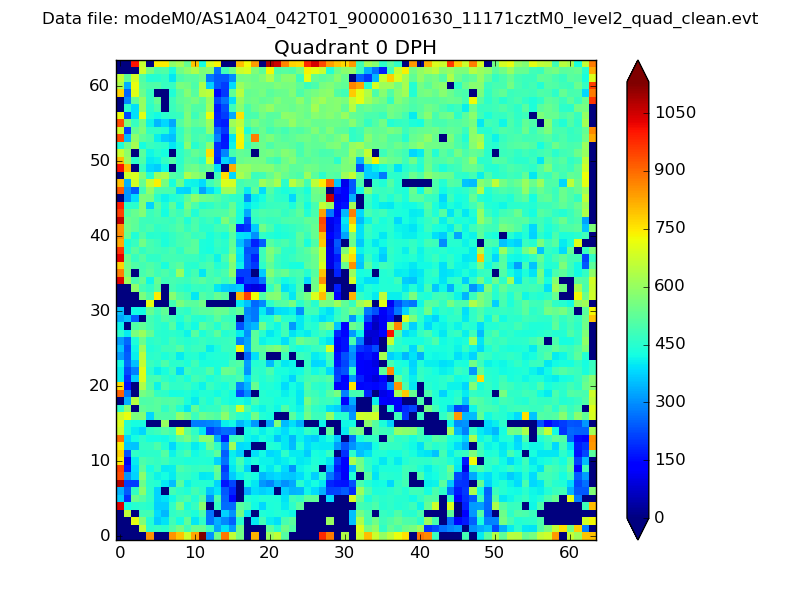 |
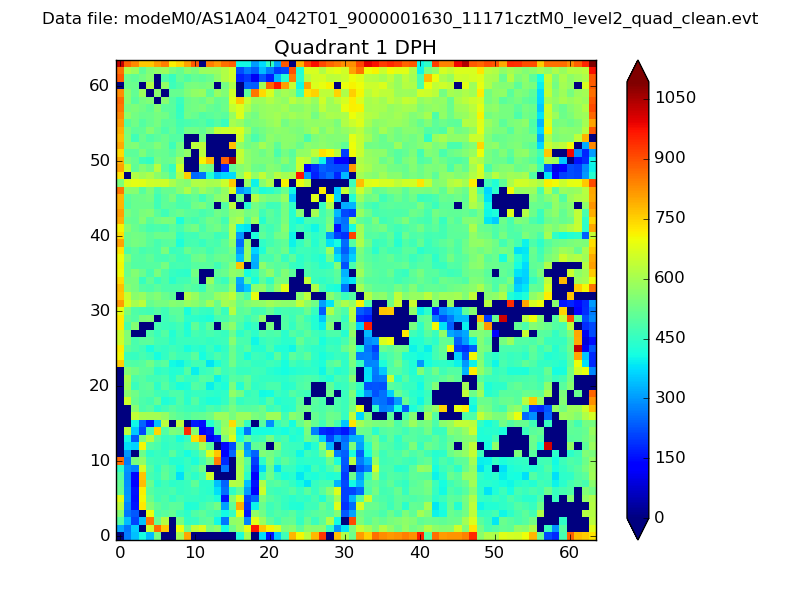 |
Quadrant B |
|---|---|---|---|
| Quadrant D | 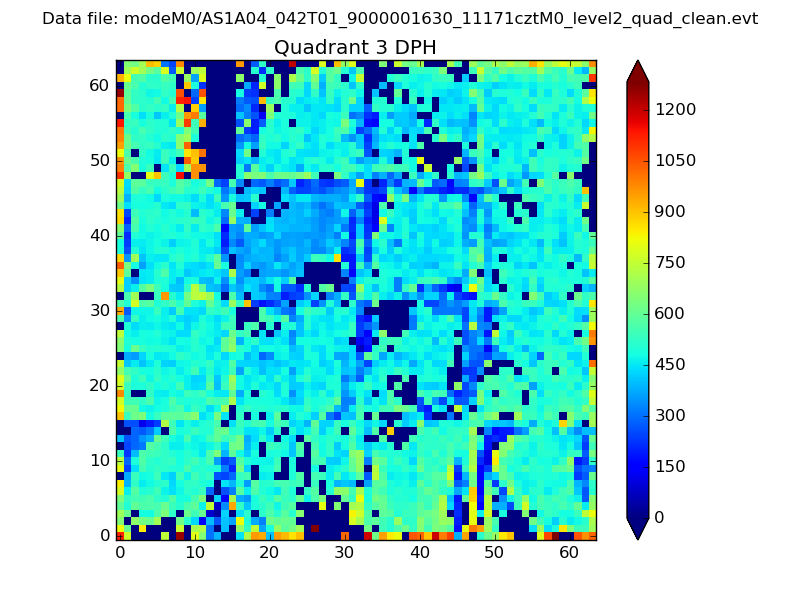 |
 |
Quadrant C |
| Plot type | Count rate plots | Images |
|---|---|---|
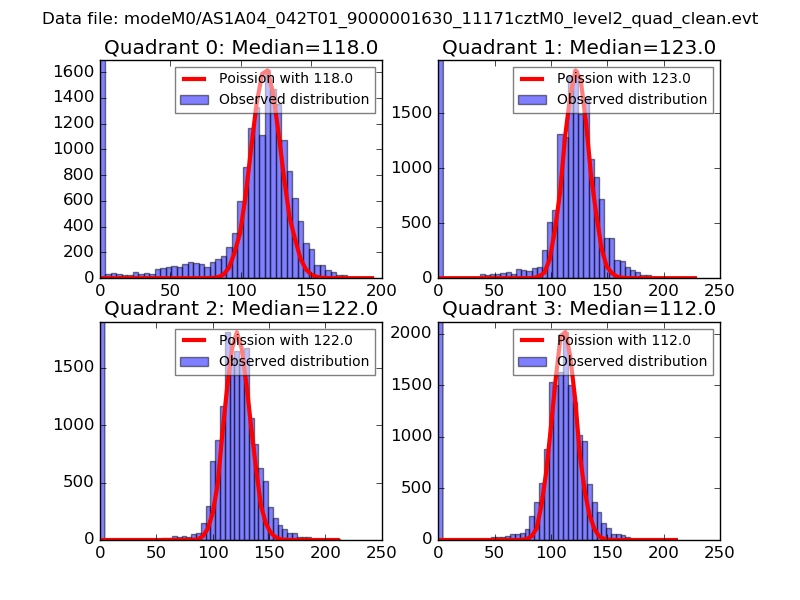
| Comparison with Poisson distribution Blue bars denote a histogram of data divided into 1 sec bins. Red curve is a Poisson curve with rate = median count rate of data. |
 |
 |
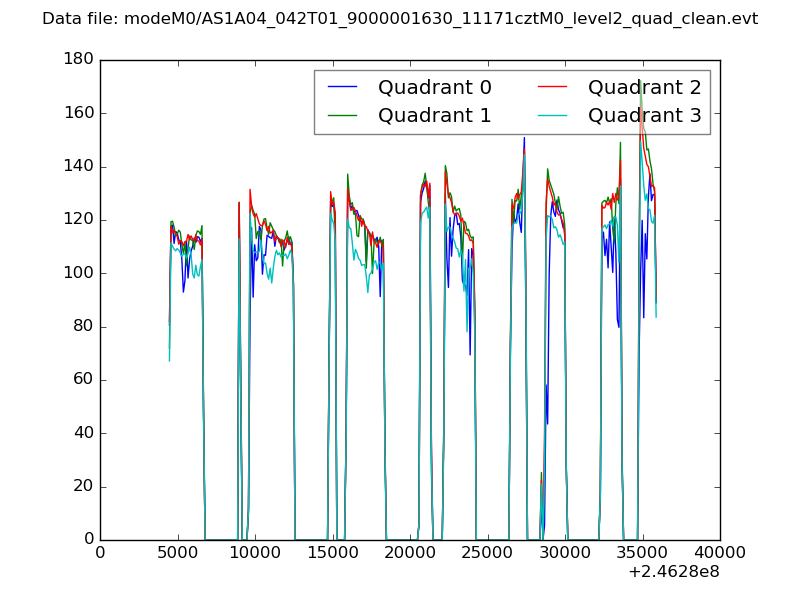
| Quadrant-wise count rates Data is divided into 100 sec bins |
 |
|
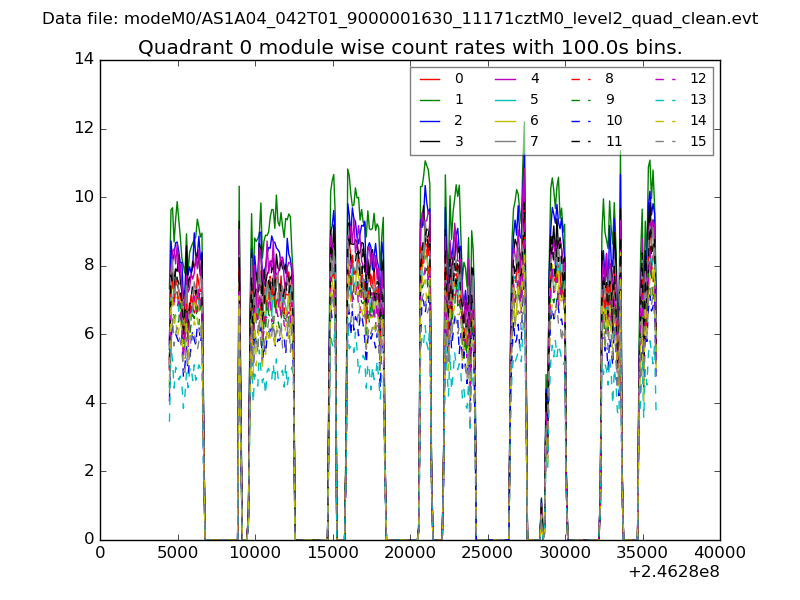
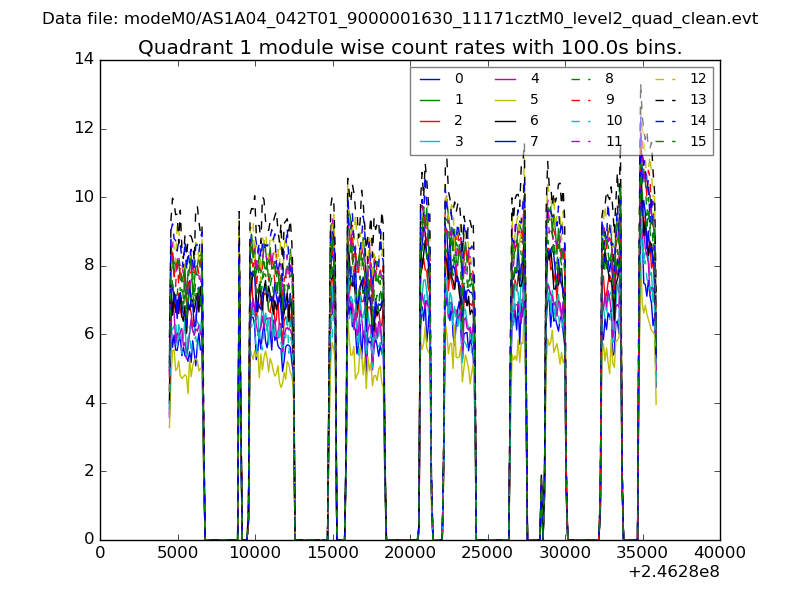
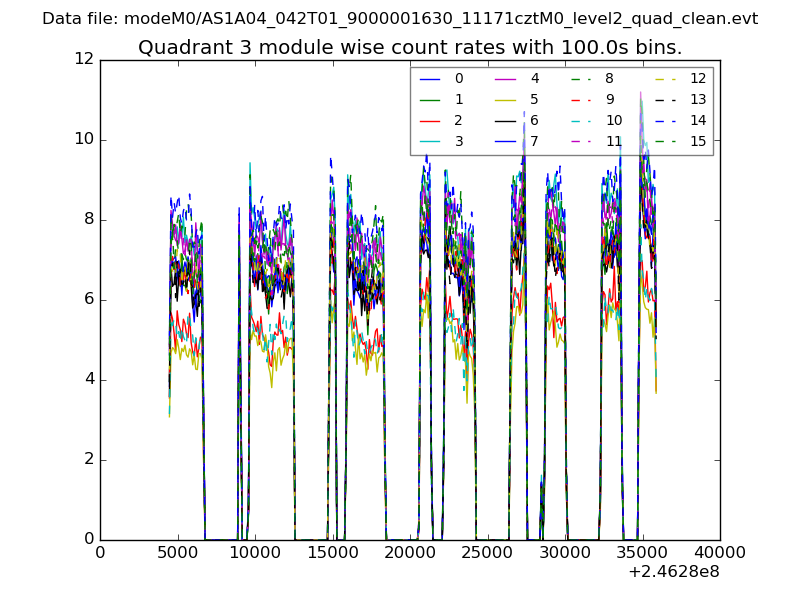
| Module-wise count rates for Quadrant A Data is divided into 100 sec bins |
 |
 |
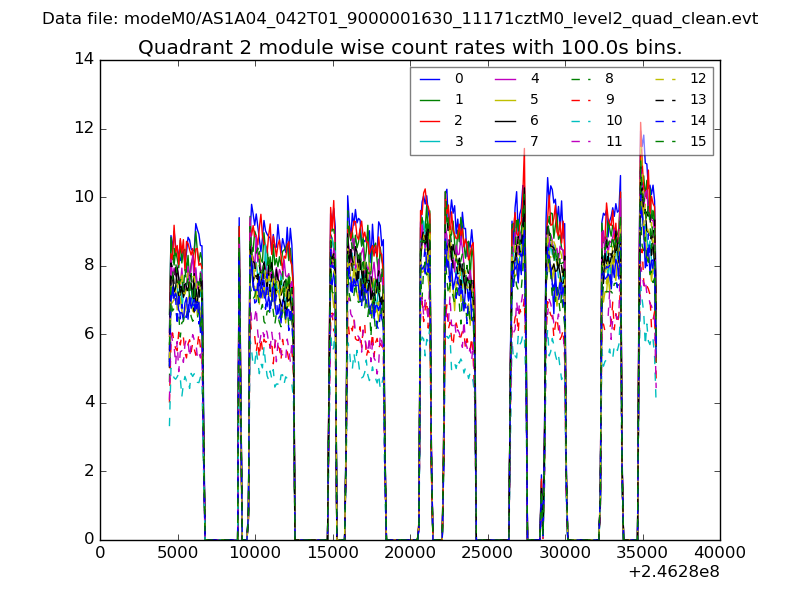
| Module-wise count rates for Quadrant B Data is divided into 100 sec bins |
 |
 |
| Module-wise count rates for Quadrant C Data is divided into 100 sec bins |
 |
 |
| Module-wise count rates for Quadrant D Data is divided into 100 sec bins |
 |
 |
| Parameter | Plot |
|---|---|
| CZT HV Monitor | 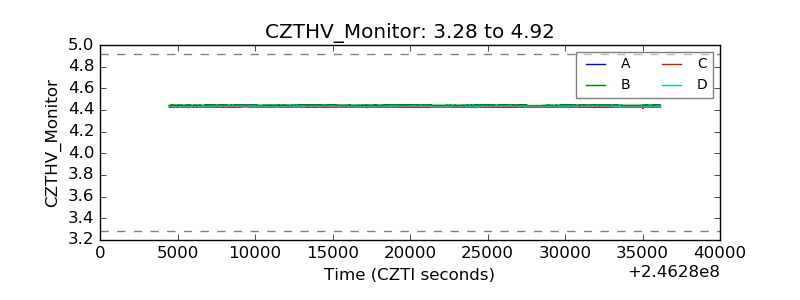 |
| D_VDD | 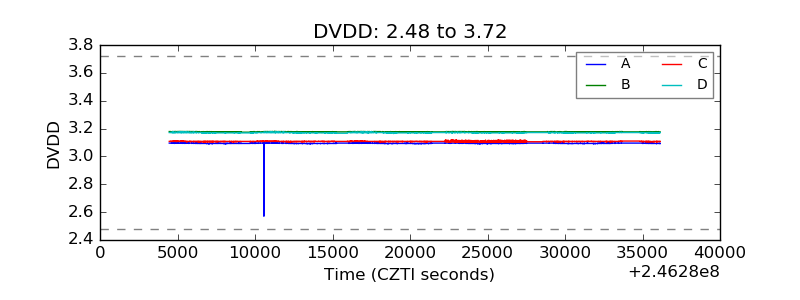 |
| Temperature 1 | 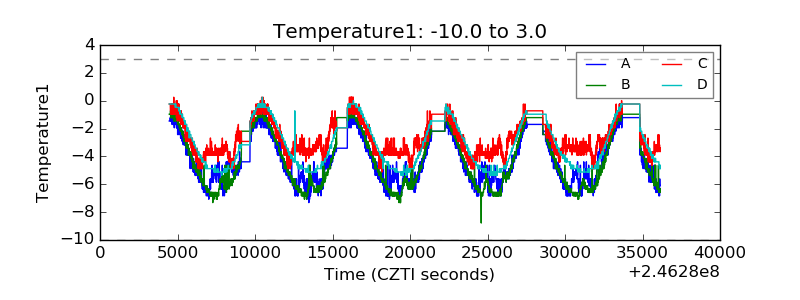 |
| Veto HV Monitor | 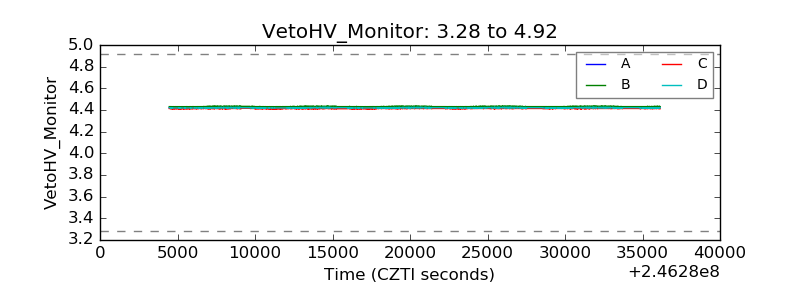 |
| Veto LLD | 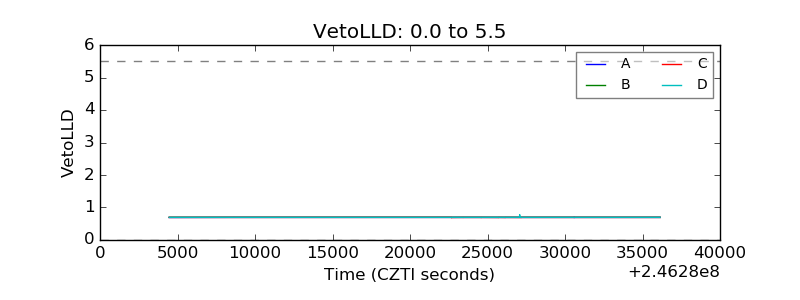 |
| Alpha Counter | 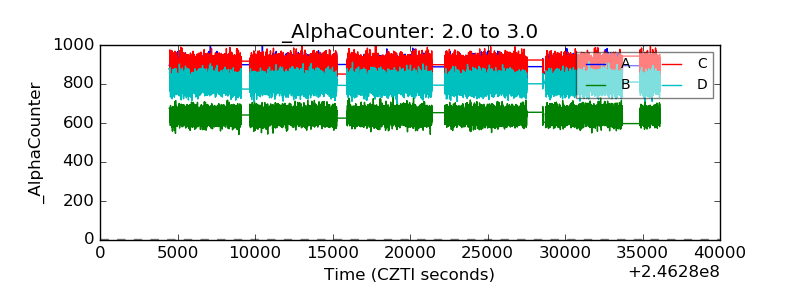 |
| _CPM_Rate | 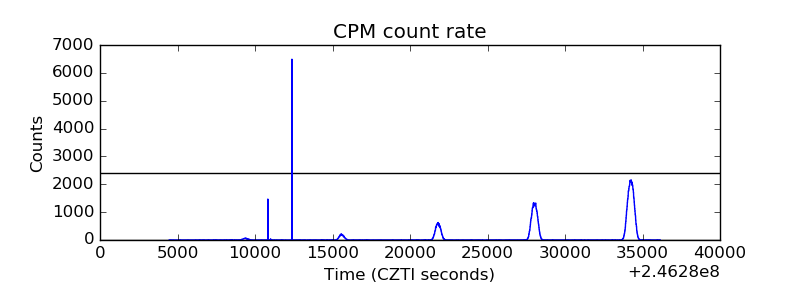 |
| CZT Counter |  |
| +2.5 Volts monitor |  |
| +5 Volts monitor | 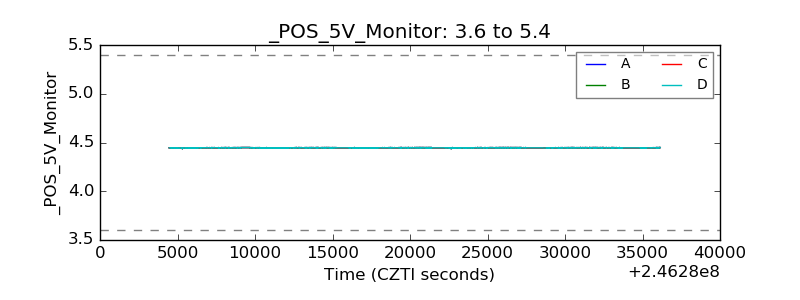 |
| _ROLL_ROT | 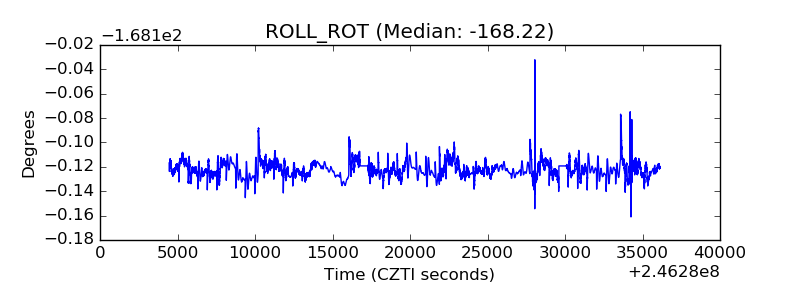 |
| _Roll_DEC | 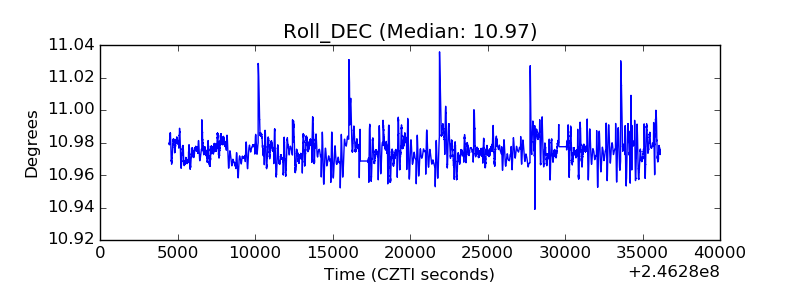 |
| _Roll_RA | 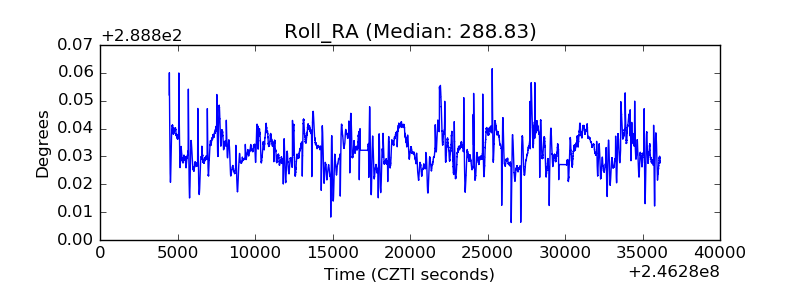 |
| Veto Counter | 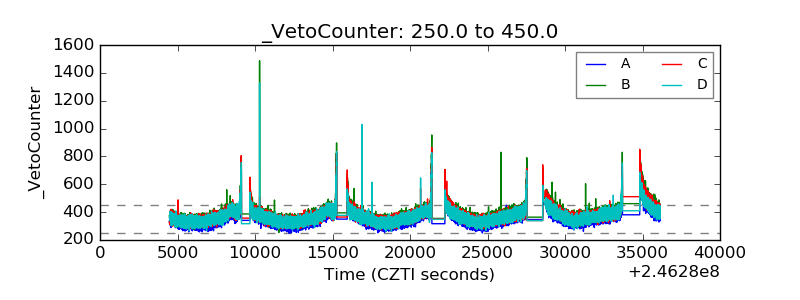 |