| Param | Original file | Final file |
|---|---|---|
| Filename | modeM0/AS1A04_042T01_9000001630_11172cztM0_level2.evt | modeM0/AS1A04_042T01_9000001630_11172cztM0_level2_quad_clean.evt |
| Size (bytes) | 20,701,440 | 4,567,680 |
| Size | 19.7 MB | 4.4 MB |
| Events in quadrant A | 239,641 | 24,782 |
| Events in quadrant B | 138,101 | 30,586 |
| Events in quadrant C | 110,238 | 30,071 |
| Events in quadrant D | 119,831 | 28,184 |
| Mode SS | |||
|---|---|---|---|
| Quadrant | BADHDUFLAG | Total packets | Discarded packets |
| A | 0 | 16 | 14 |
| B | 0 | 15 | 13 |
| C | 0 | 16 | 14 |
| D | 0 | 15 | 13 |
| Mode M0 | |||
|---|---|---|---|
| Quadrant | BADHDUFLAG | Total packets | Discarded packets |
| A | 0 | 2682 | 1791 |
| B | 0 | 1532 | 987 |
| C | 0 | 1472 | 994 |
| D | 0 | 1479 | 986 |
| Quadrant | Total seconds | Saturated seconds | Saturation percentage |
|---|---|---|---|
| A | 226 | 45 | 19.911504% |
| B | 238 | 4 | 1.680672% |
| C | 239 | 0 | 0.000000% |
| D | 236 | 0 | 0.000000% |
Noise dominated data is calculated using 1-second bins in cleaned event files. If a bin has >2000 counts, and if more than 50% of those come from <1% of pixels, then it is considered to be noise-dominated and hence unusable.
| Quadrant | # 1 sec bins | Bins with >0 counts | Bins with >2000 counts | High rate bins dominated by noise | Noise dominated (total time) | Noise dominated (detector-on time) | Marked lightcurve |
|---|---|---|---|---|---|---|---|
| A | 325 | 245 | 33 | 33 | 10.15% | 13.47% | 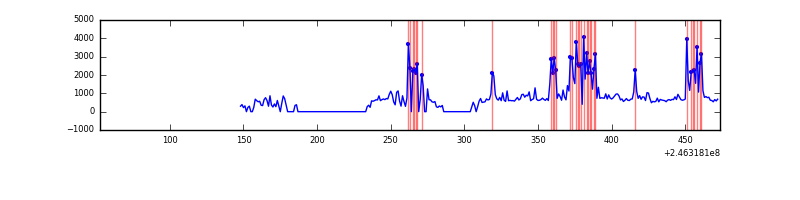 |
| B | 329 | 262 | 3 | 3 | 0.91% | 1.15% | 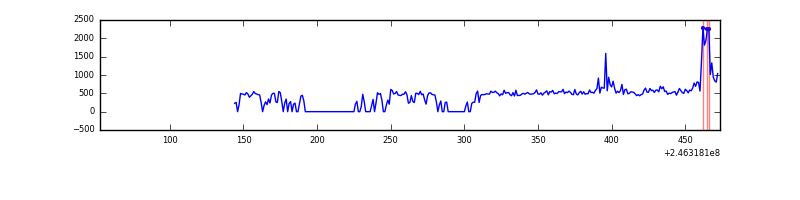 |
| C | 421 | 264 | 0 | 0 | 0.00% | 0.00% | 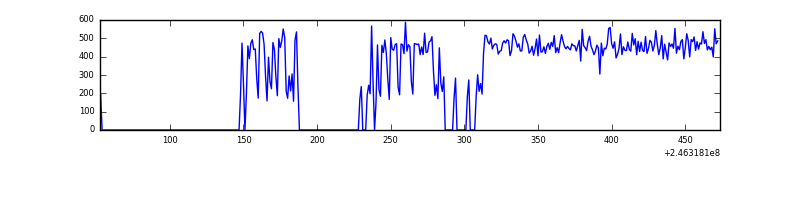 |
| D | 331 | 256 | 0 | 0 | 0.00% | 0.00% | 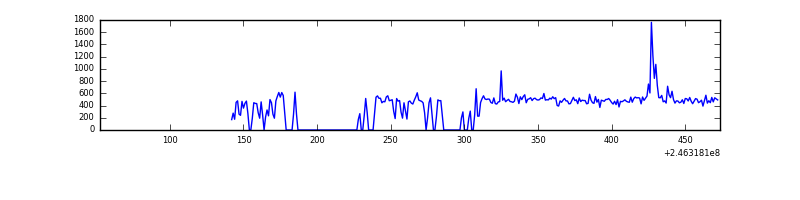 |
Top three noisy pixels from each quadrant. If the there are fewer than three noisy pixels in the level2.evt file, extra rows are filled as -1
| Pixel properties | Quadrant properties | ||||||
|---|---|---|---|---|---|---|---|
| Quadrant | DetID | PixID | Counts | Sigma | Mean | Median | Sigma |
| A | 8 | 5 | 106968 | 15200.6 | 25 | 24 | 7.0 |
| A | 8 | 15 | 35665 | 5065.87 | 25 | 24 | 7.0 |
| A | 14 | 63 | 467 | 62.97 | 25 | 24 | 7.0 |
| B | 4 | 239 | 18397 | 2373.39 | 29 | 28 | 7.7 |
| B | 0 | 187 | 4954 | 636.47 | 29 | 28 | 7.7 |
| B | 15 | 204 | 1089 | 137.09 | 29 | 28 | 7.7 |
| C | 13 | 61 | 217 | 22.26 | 28 | 27 | 8.5 |
| C | 14 | 234 | 93 | 7.73 | 28 | 27 | 8.5 |
| C | 7 | 247 | 89 | 7.26 | 28 | 27 | 8.5 |
| D | 1 | 52 | 4715 | 541.24 | 27 | 26 | 8.7 |
| D | 10 | 253 | 3197 | 366.02 | 27 | 26 | 8.7 |
| D | 12 | 157 | 2960 | 338.67 | 27 | 26 | 8.7 |
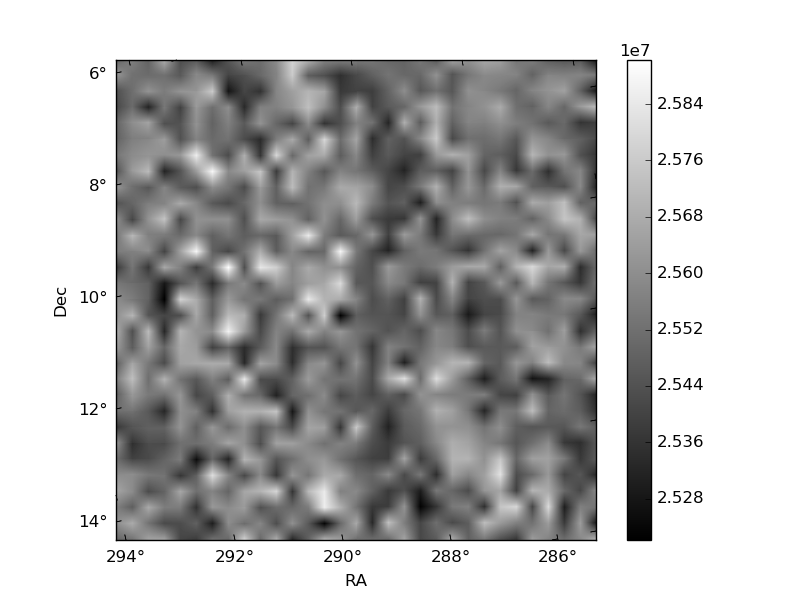
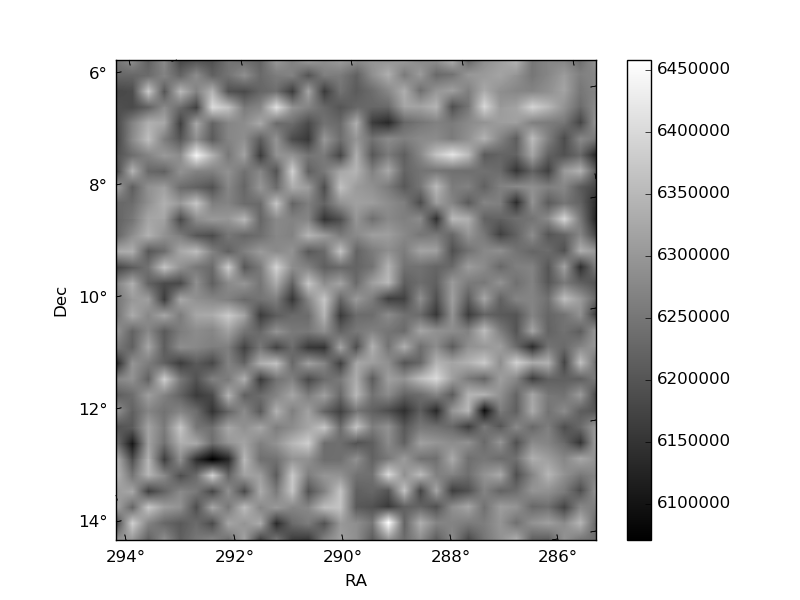
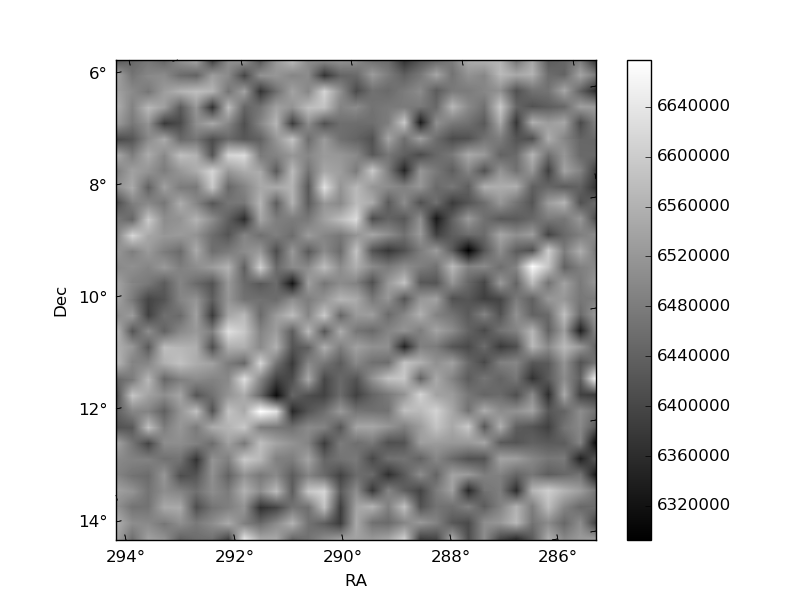
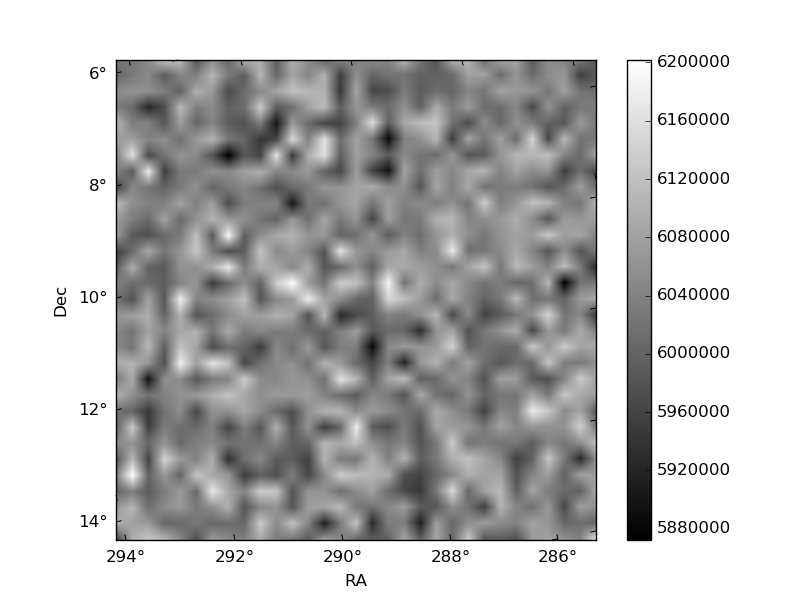
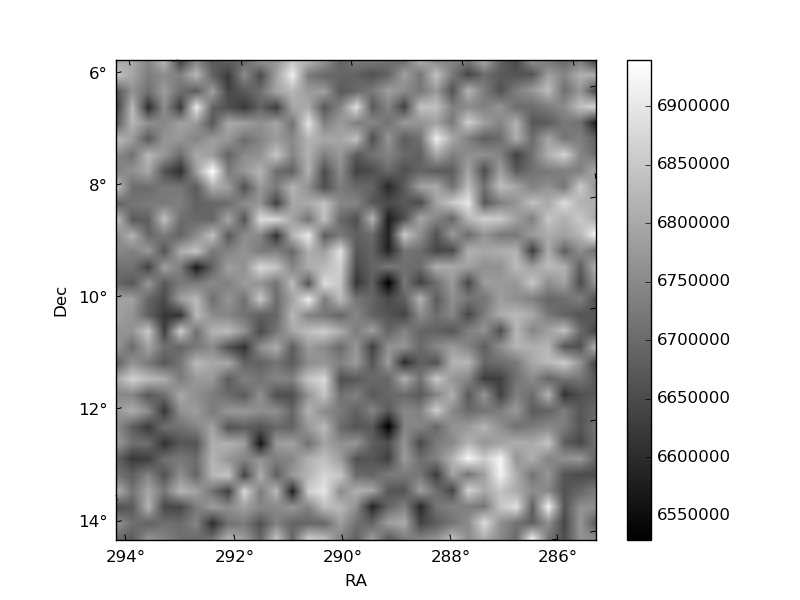
Histogram calculated using DETX and DETY for each event in the final _common_clean file
| Quadrant A | 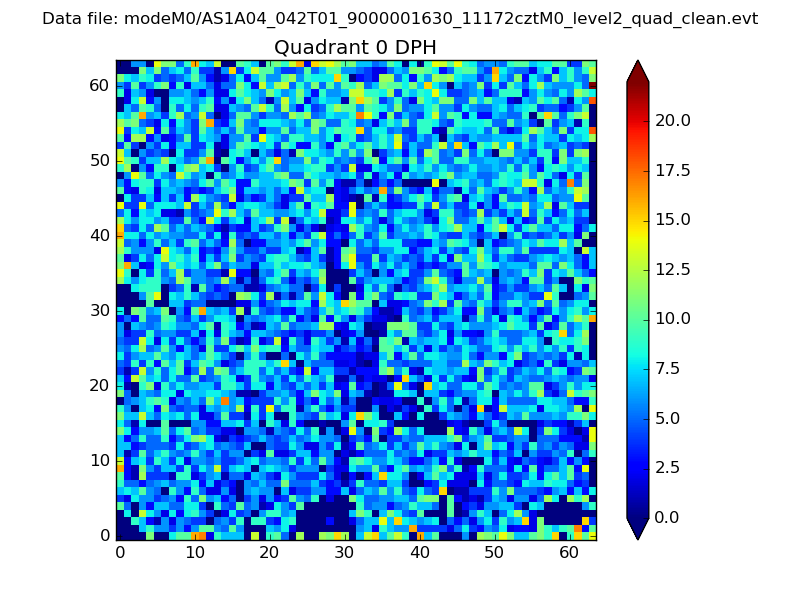 |
 |
Quadrant B |
|---|---|---|---|
| Quadrant D | 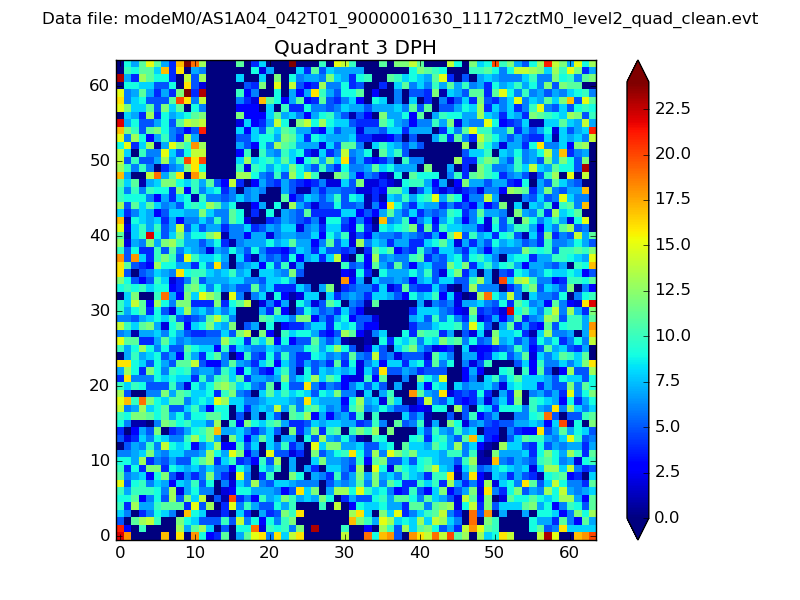 |
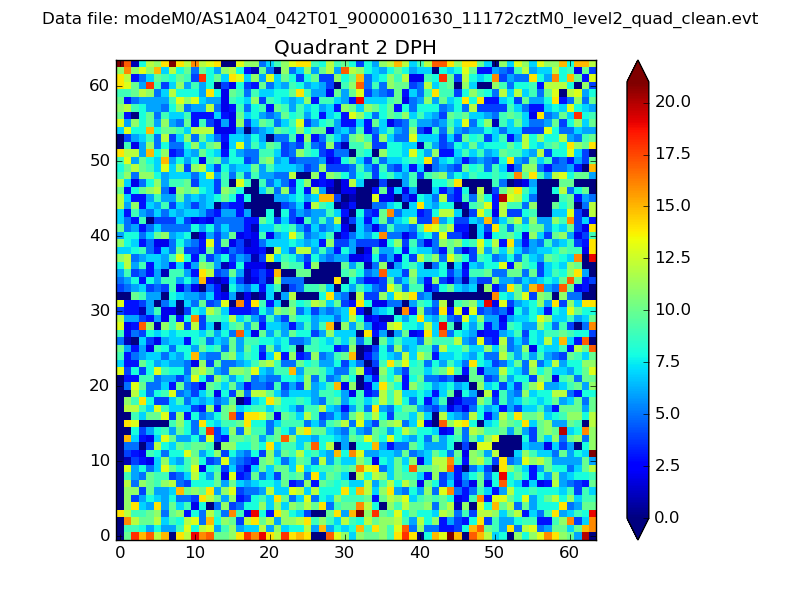 |
Quadrant C |
| Plot type | Count rate plots | Images |
|---|---|---|
| Comparison with Poisson distribution Blue bars denote a histogram of data divided into 1 sec bins. Red curve is a Poisson curve with rate = median count rate of data. |
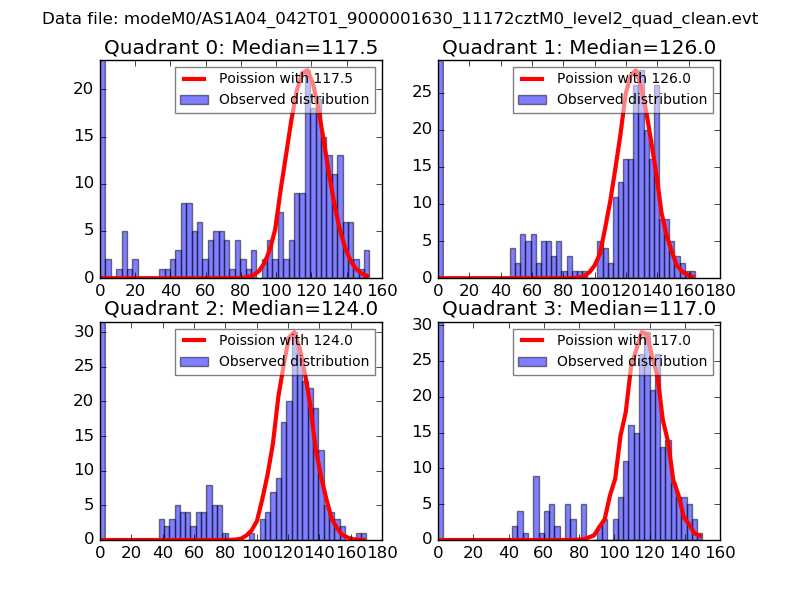 |
 |
| Quadrant-wise count rates Data is divided into 100 sec bins |
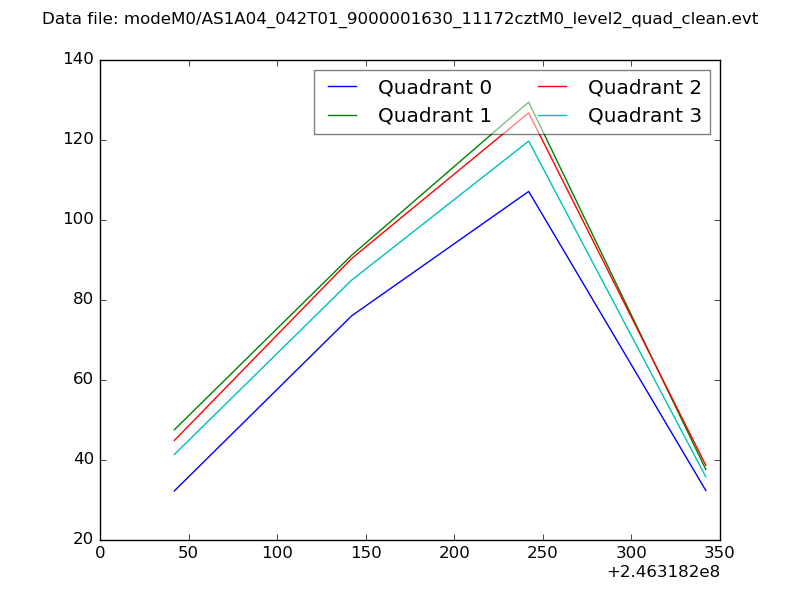 |
|
| Module-wise count rates for Quadrant A Data is divided into 100 sec bins |
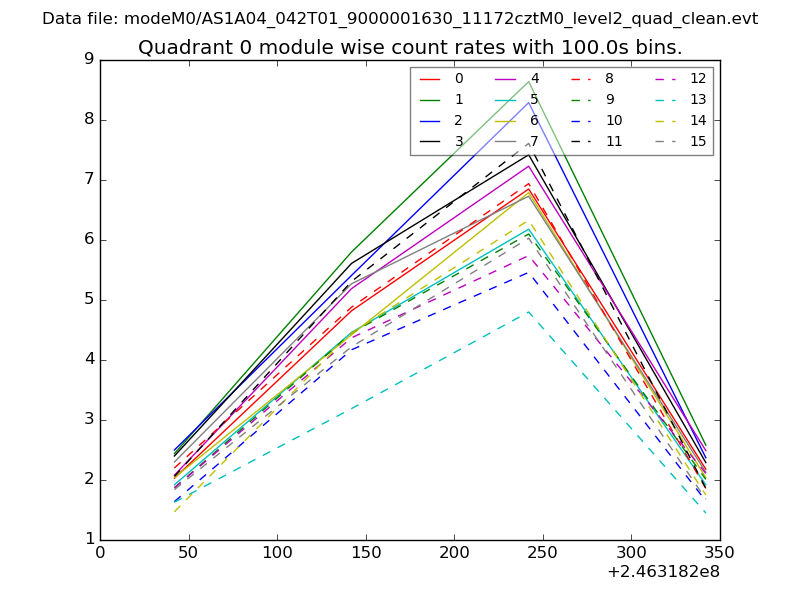 |
 |
| Module-wise count rates for Quadrant B Data is divided into 100 sec bins |
 |
 |
| Module-wise count rates for Quadrant C Data is divided into 100 sec bins |
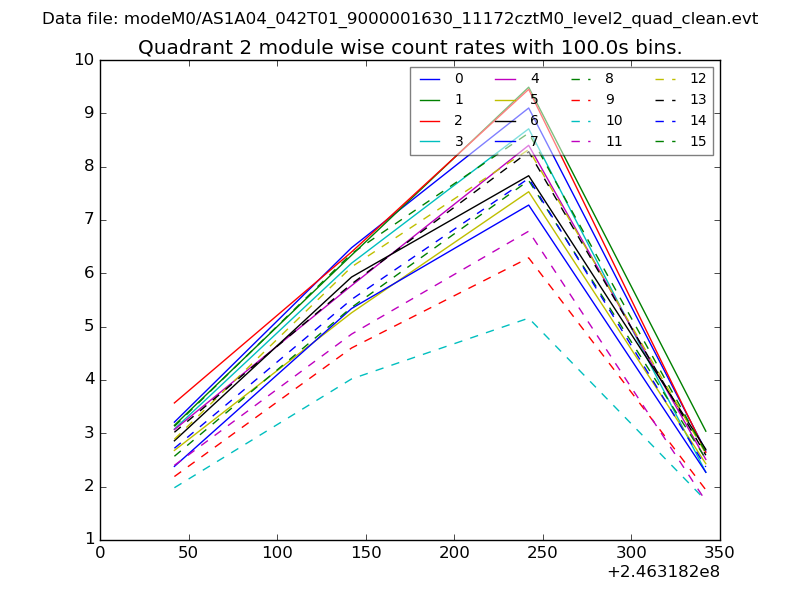 |
 |
| Module-wise count rates for Quadrant D Data is divided into 100 sec bins |
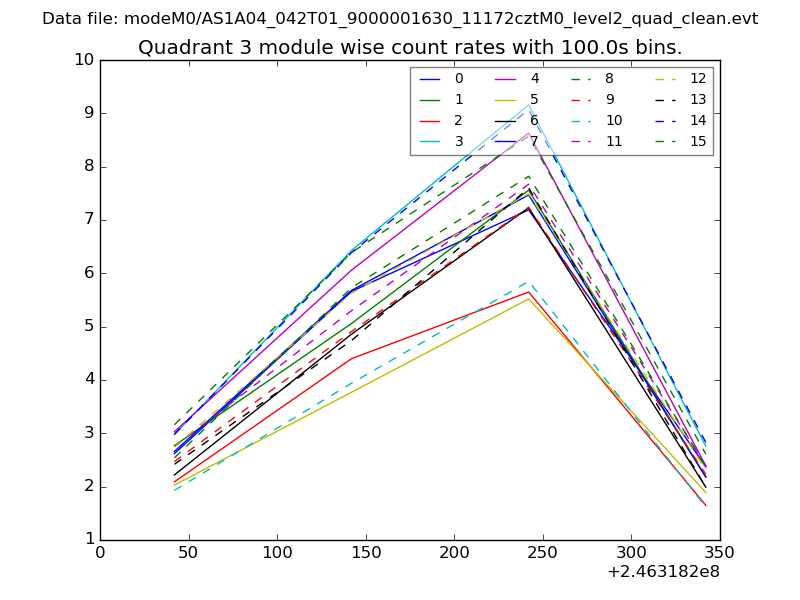 |
 |
| Parameter | Plot |
|---|---|
| CZT HV Monitor |  |
| D_VDD | 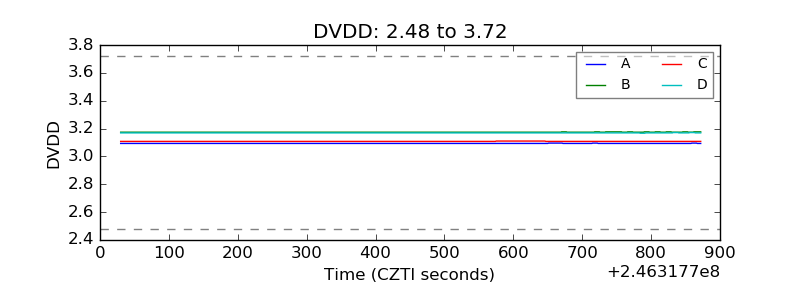 |
| Temperature 1 | 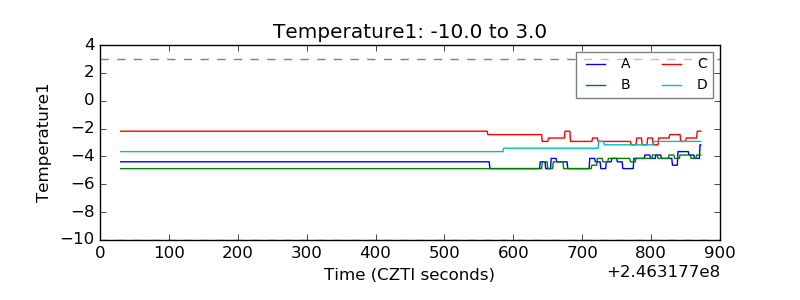 |
| Veto HV Monitor | 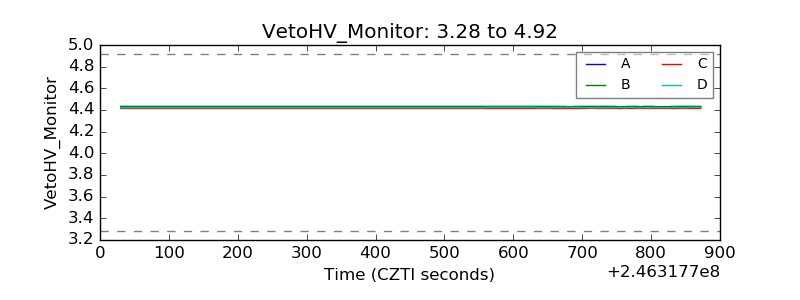 |
| Veto LLD | 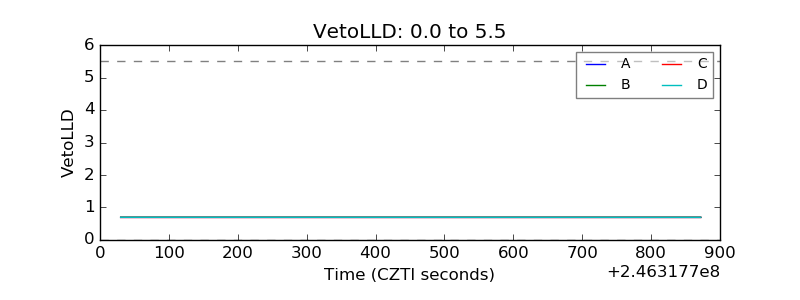 |
| Alpha Counter | 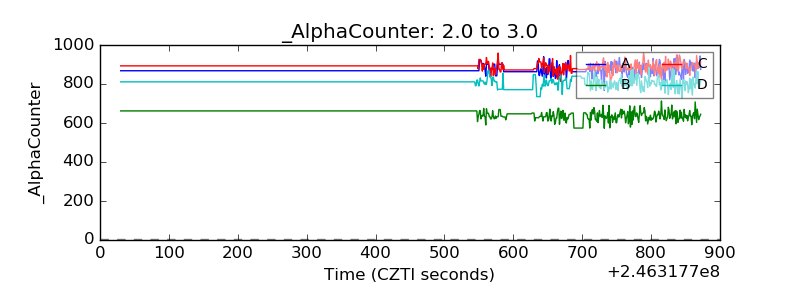 |
| _CPM_Rate | 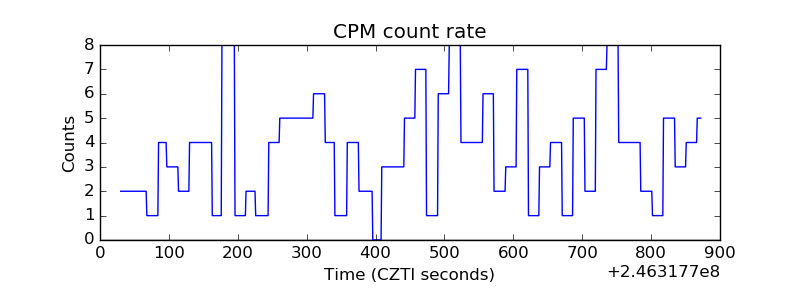 |
| CZT Counter | 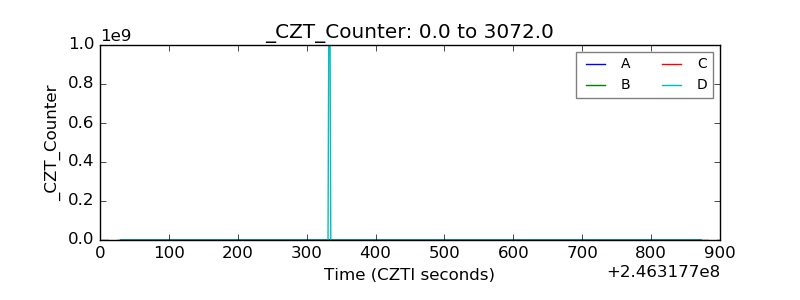 |
| +2.5 Volts monitor |  |
| +5 Volts monitor | 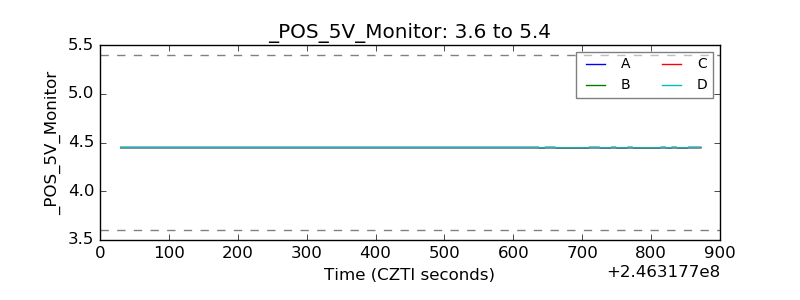 |
| _ROLL_ROT | 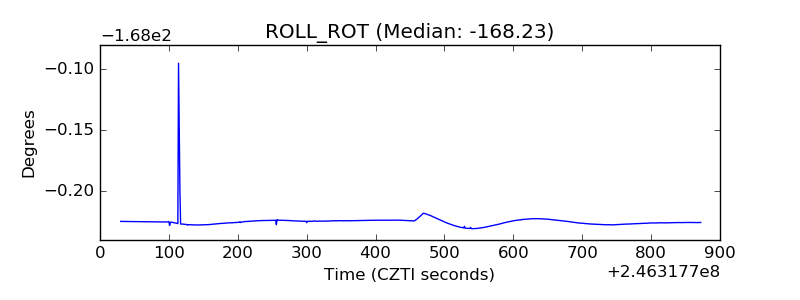 |
| _Roll_DEC | 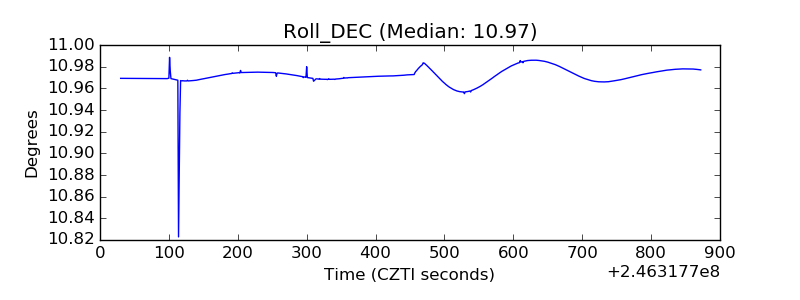 |
| _Roll_RA | 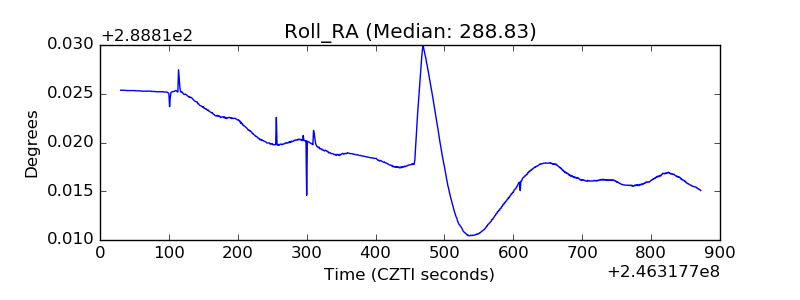 |
| Veto Counter | 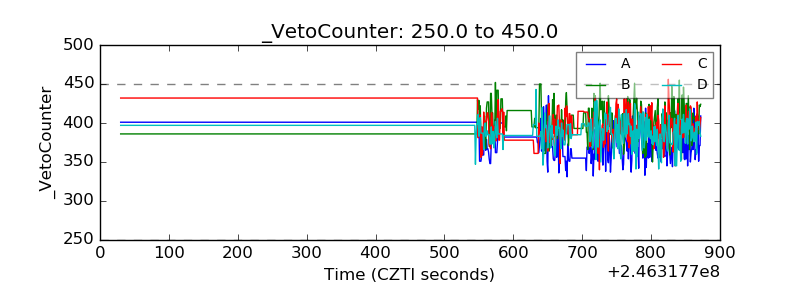 |