| Param | Original file | Final file |
|---|---|---|
| Filename | modeM0/AS1A04_042T01_9000001630_11176cztM0_level2.evt | modeM0/AS1A04_042T01_9000001630_11176cztM0_level2_quad_clean.evt |
| Size (bytes) | 779,336,640 | 72,927,360 |
| Size | 743.2 MB | 69.5 MB |
| Events in quadrant A | 9,168,841 | 376,089 |
| Events in quadrant B | 5,433,979 | 436,879 |
| Events in quadrant C | 3,658,376 | 431,513 |
| Events in quadrant D | 4,790,561 | 396,693 |
| Mode SS | |||
|---|---|---|---|
| Quadrant | BADHDUFLAG | Total packets | Discarded packets |
| A | 0 | 164 | 0 |
| B | 0 | 164 | 0 |
| C | 0 | 164 | 0 |
| D | 0 | 164 | 0 |
| Mode M9 | |||
|---|---|---|---|
| Quadrant | BADHDUFLAG | Total packets | Discarded packets |
| A | 0 | 11 | 0 |
| B | 0 | 11 | 0 |
| C | 0 | 11 | 0 |
| D | 0 | 11 | 0 |
| Mode M0 | |||
|---|---|---|---|
| Quadrant | BADHDUFLAG | Total packets | Discarded packets |
| A | 0 | 32970 | 1 |
| B | 0 | 21456 | 1 |
| C | 0 | 16574 | 1 |
| D | 0 | 19772 | 5 |
| Quadrant | Total seconds | Saturated seconds | Saturation percentage |
|---|---|---|---|
| A | 8153 | 1382 | 16.950816% |
| B | 8153 | 388 | 4.758984% |
| C | 8153 | 16 | 0.196247% |
| D | 8152 | 97 | 1.189892% |
Noise dominated data is calculated using 1-second bins in cleaned event files. If a bin has >2000 counts, and if more than 50% of those come from <1% of pixels, then it is considered to be noise-dominated and hence unusable.
| Quadrant | # 1 sec bins | Bins with >0 counts | Bins with >2000 counts | High rate bins dominated by noise | Noise dominated (total time) | Noise dominated (detector-on time) | Marked lightcurve |
|---|---|---|---|---|---|---|---|
| A | 9273 | 8154 | 921 | 921 | 9.93% | 11.30% | 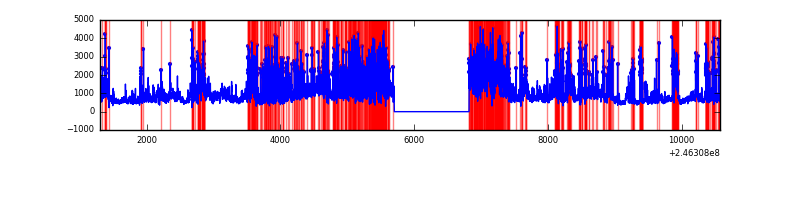 |
| B | 9273 | 8154 | 245 | 245 | 2.64% | 3.00% | 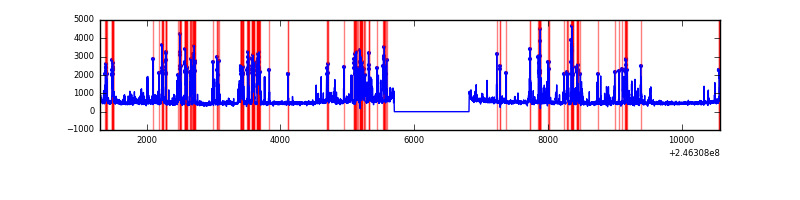 |
| C | 9273 | 8154 | 0 | 0 | 0.00% | 0.00% |  |
| D | 9272 | 8153 | 52 | 52 | 0.56% | 0.64% | 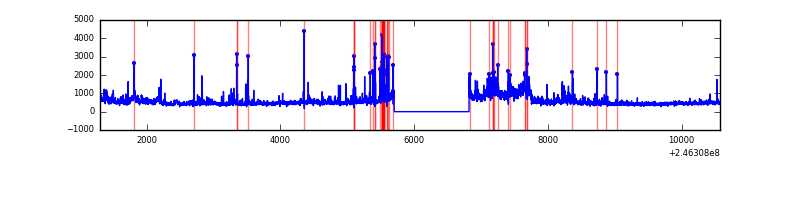 |
Top three noisy pixels from each quadrant. If the there are fewer than three noisy pixels in the level2.evt file, extra rows are filled as -1
| Pixel properties | Quadrant properties | ||||||
|---|---|---|---|---|---|---|---|
| Quadrant | DetID | PixID | Counts | Sigma | Mean | Median | Sigma |
| A | 8 | 5 | 2328040 | 13045.95 | 882 | 863 | 178.4 |
| A | 8 | 15 | 2010224 | 11264.3 | 882 | 863 | 178.4 |
| A | 14 | 238 | 1227132 | 6874.35 | 882 | 863 | 178.4 |
| B | 4 | 239 | 1098275 | 6091.66 | 951 | 928 | 180.1 |
| B | 10 | 16 | 255641 | 1413.98 | 951 | 928 | 180.1 |
| B | 4 | 80 | 111885 | 615.95 | 951 | 928 | 180.1 |
| C | 9 | 204 | 34626 | 155.93 | 929 | 937 | 216.1 |
| C | 13 | 61 | 7026 | 28.18 | 929 | 937 | 216.1 |
| C | 14 | 234 | 2881 | 9.0 | 929 | 937 | 216.1 |
| D | 10 | 157 | 290565 | 1319.39 | 911 | 887 | 219.6 |
| D | 5 | 222 | 248215 | 1126.5 | 911 | 887 | 219.6 |
| D | 1 | 52 | 242423 | 1100.12 | 911 | 887 | 219.6 |
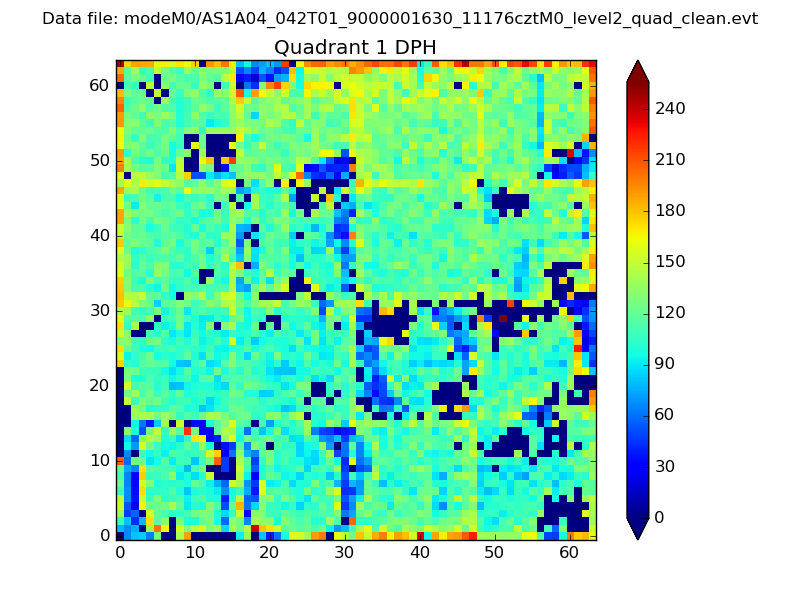
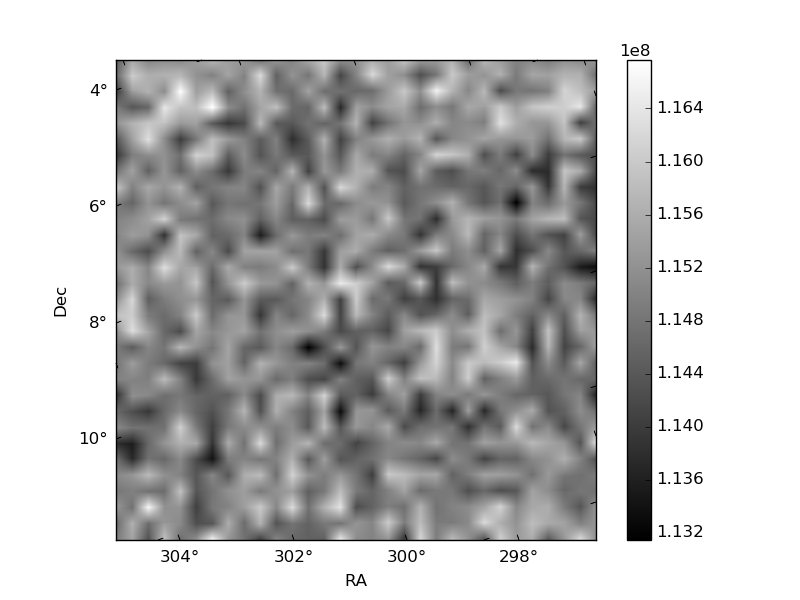
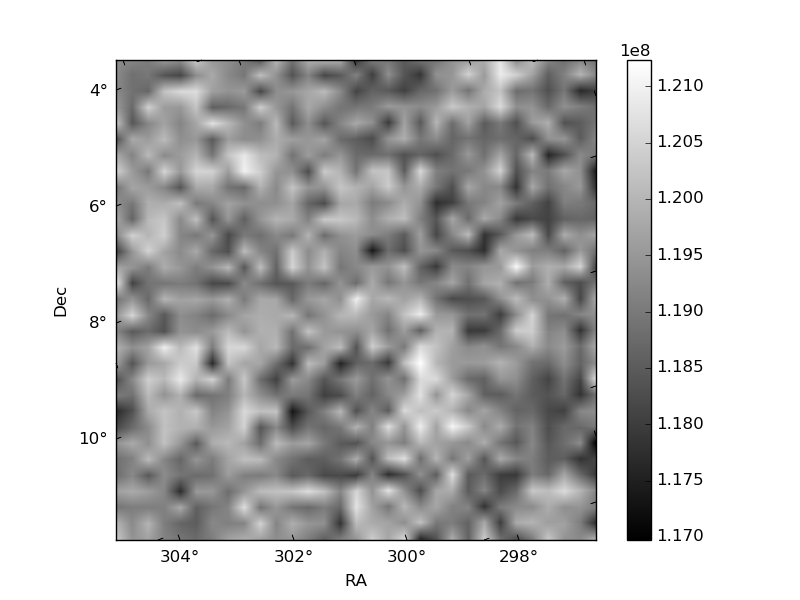
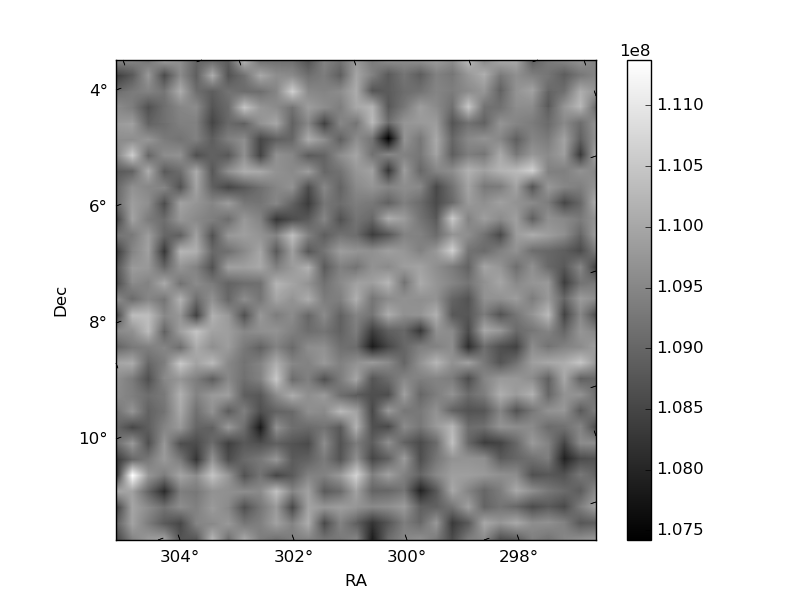
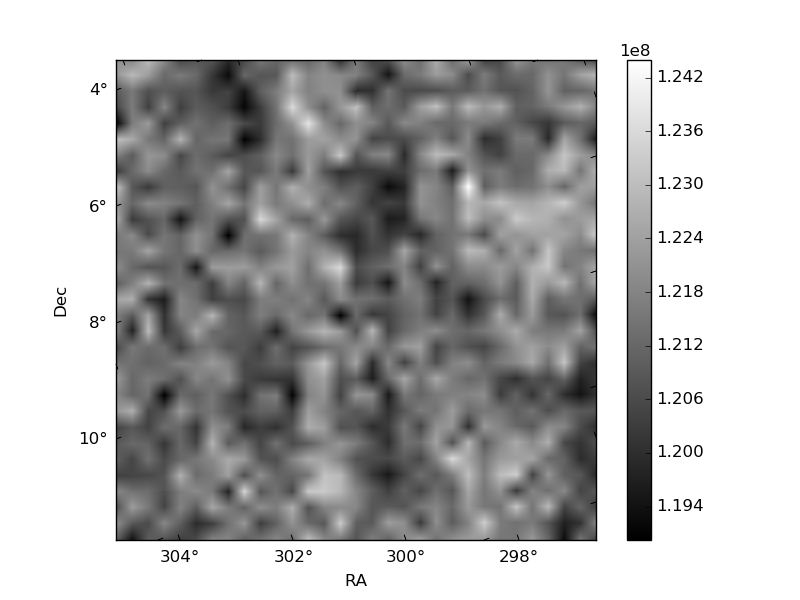
Histogram calculated using DETX and DETY for each event in the final _common_clean file
| Quadrant A | 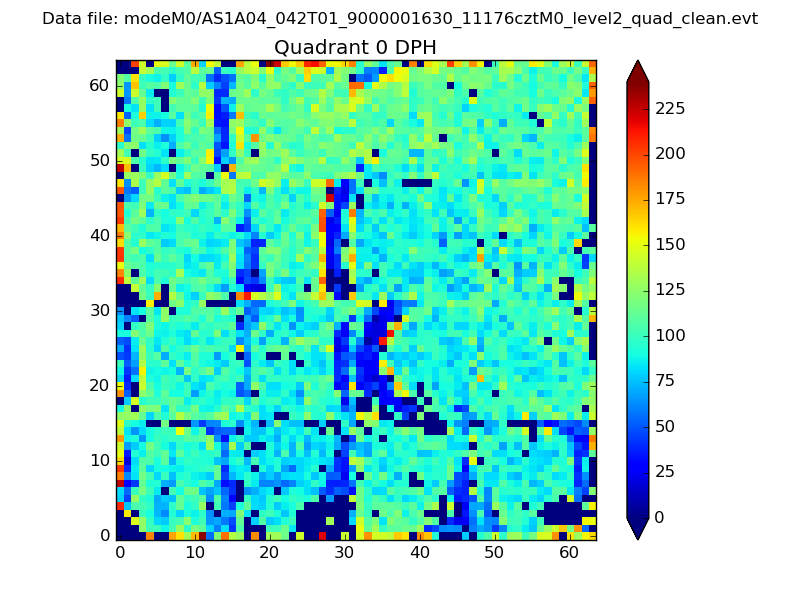 |
 |
Quadrant B |
|---|---|---|---|
| Quadrant D | 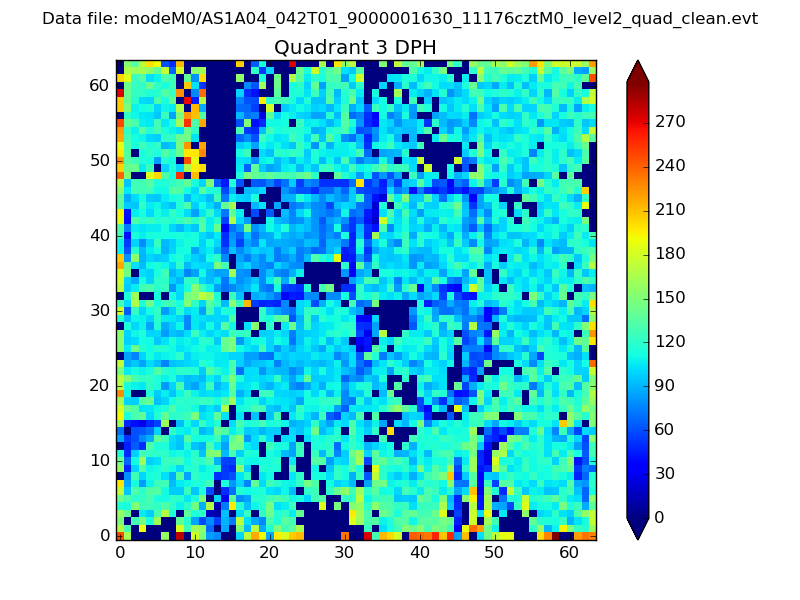 |
 |
Quadrant C |
| Plot type | Count rate plots | Images |
|---|---|---|
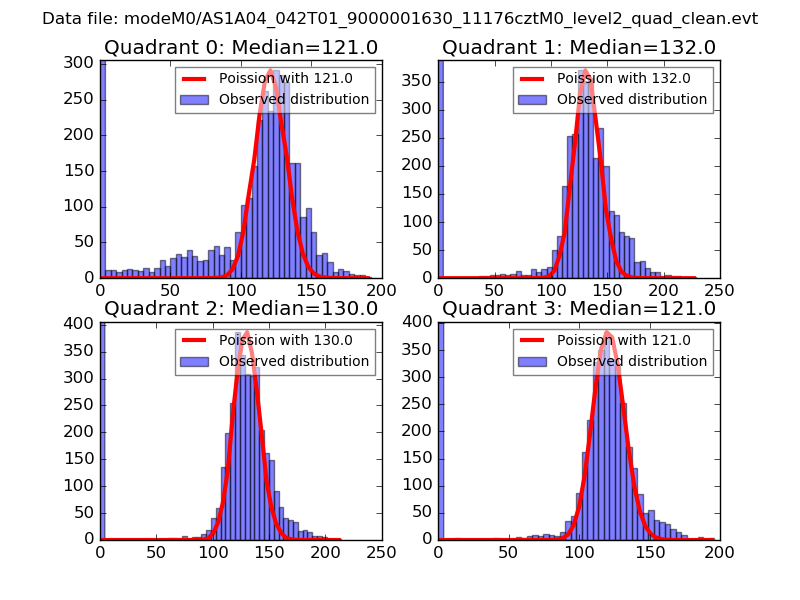
| Comparison with Poisson distribution Blue bars denote a histogram of data divided into 1 sec bins. Red curve is a Poisson curve with rate = median count rate of data. |
 |
 |
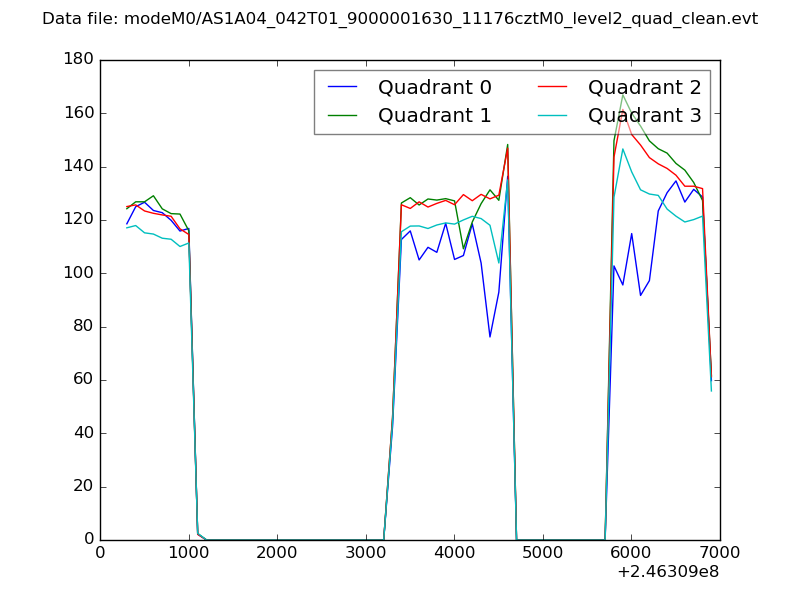
| Quadrant-wise count rates Data is divided into 100 sec bins |
 |
|
| Module-wise count rates for Quadrant A Data is divided into 100 sec bins |
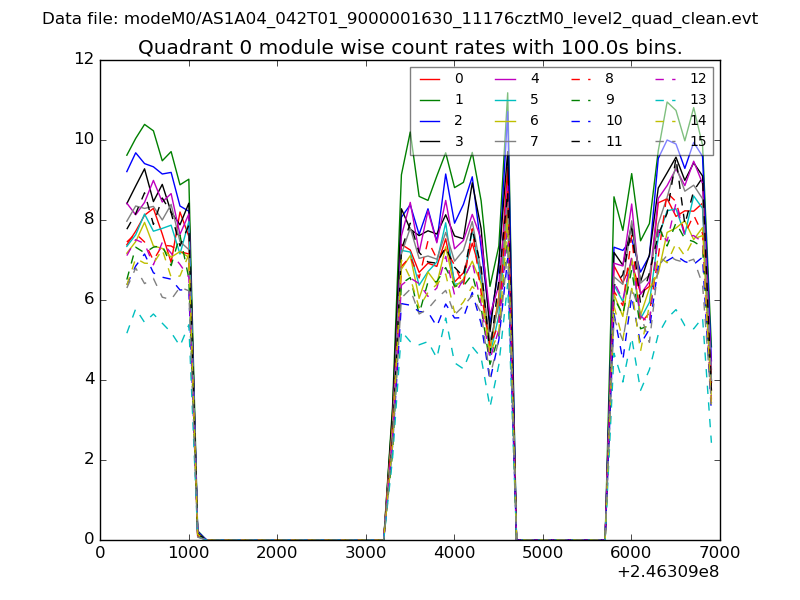 |
 |
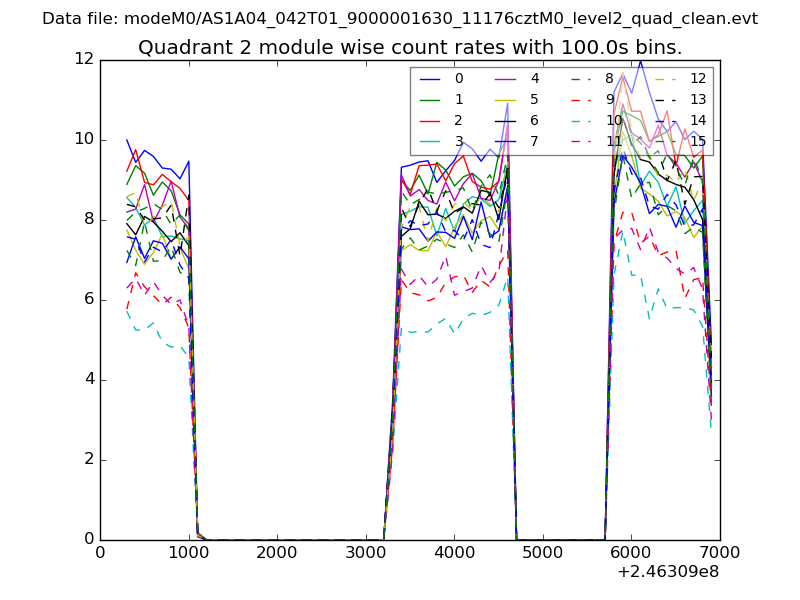
| Module-wise count rates for Quadrant B Data is divided into 100 sec bins |
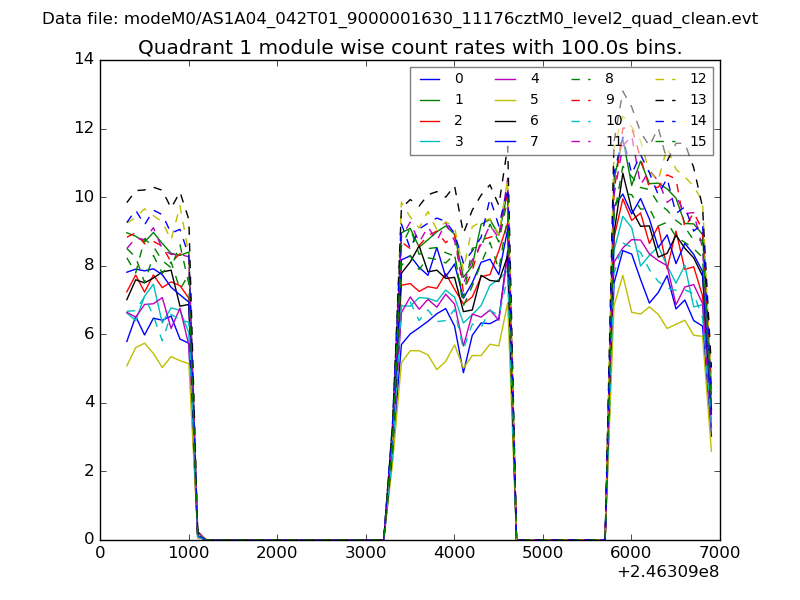 |
 |
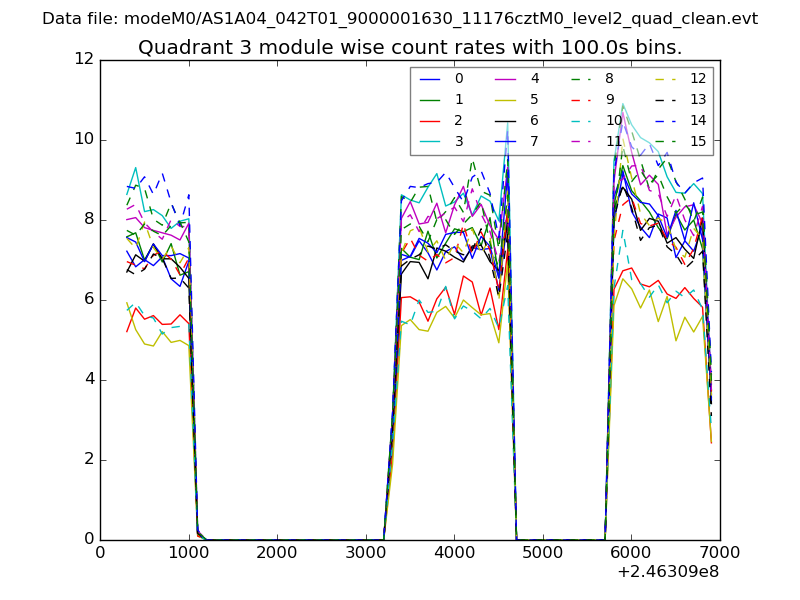
| Module-wise count rates for Quadrant C Data is divided into 100 sec bins |
 |
 |
| Module-wise count rates for Quadrant D Data is divided into 100 sec bins |
 |
 |
| Parameter | Plot |
|---|---|
| CZT HV Monitor | 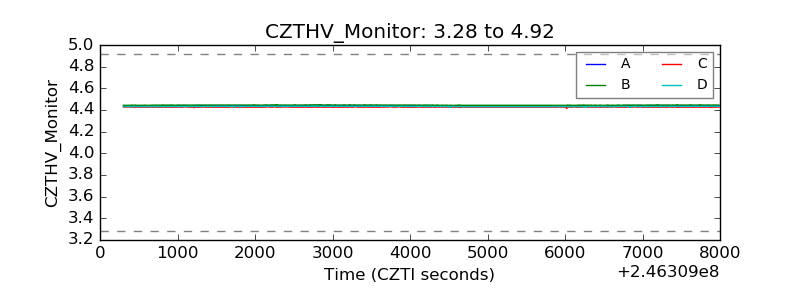 |
| D_VDD | 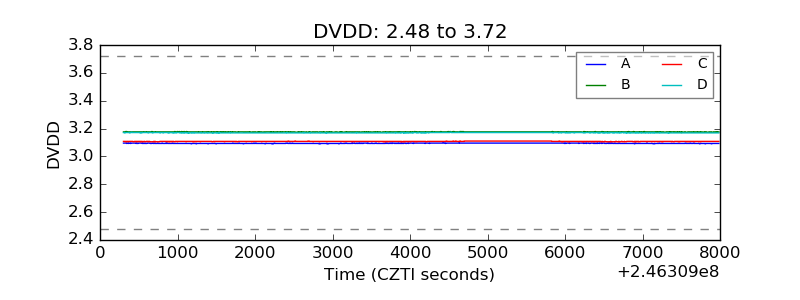 |
| Temperature 1 | 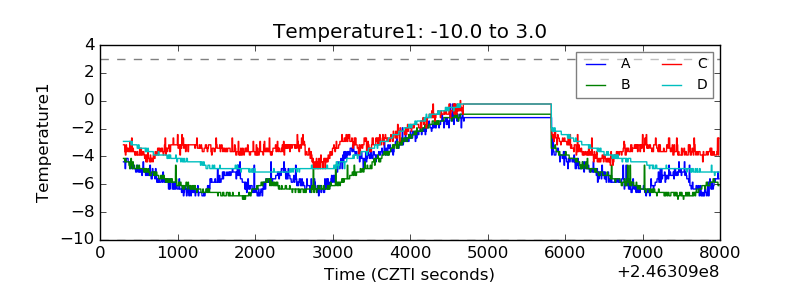 |
| Veto HV Monitor | 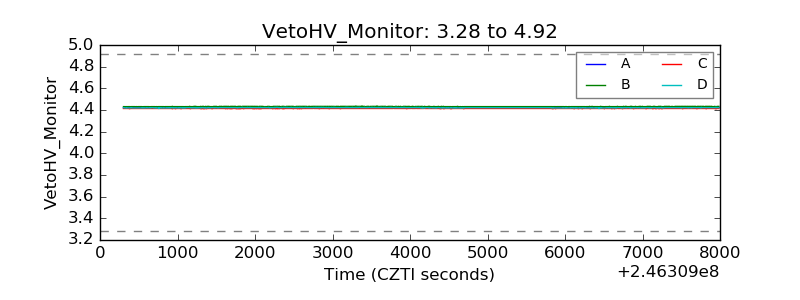 |
| Veto LLD | 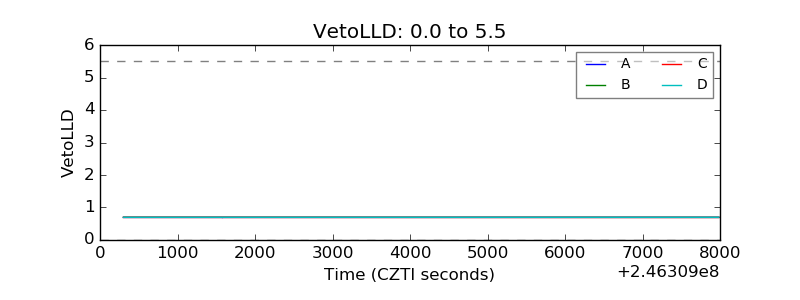 |
| Alpha Counter | 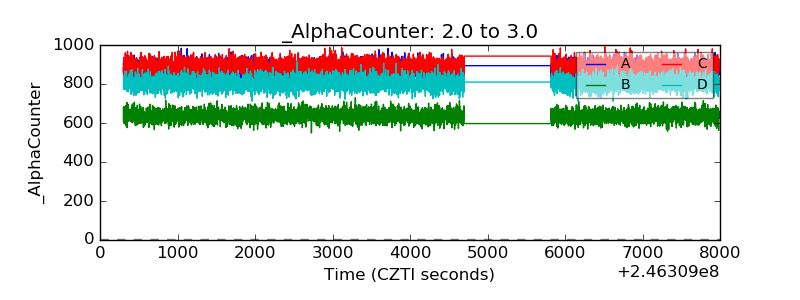 |
| _CPM_Rate | 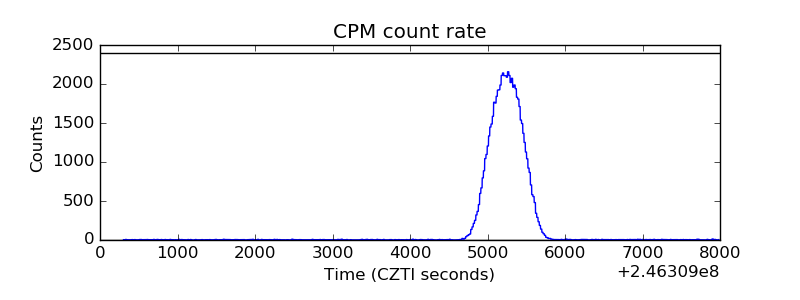 |
| CZT Counter | 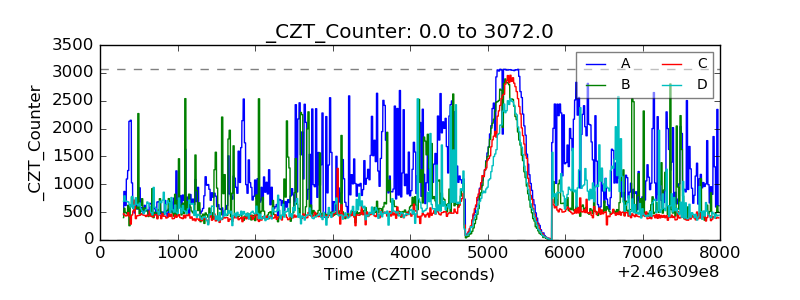 |
| +2.5 Volts monitor |  |
| +5 Volts monitor |  |
| _ROLL_ROT | 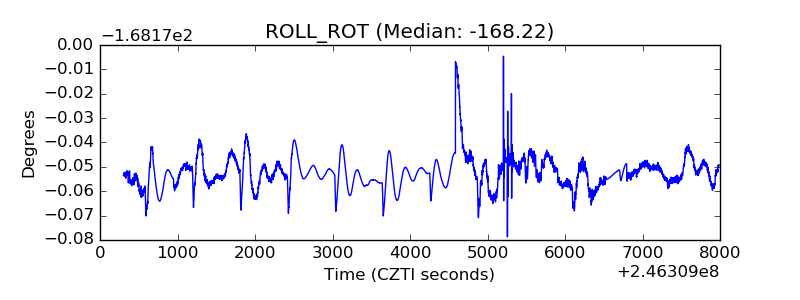 |
| _Roll_DEC | 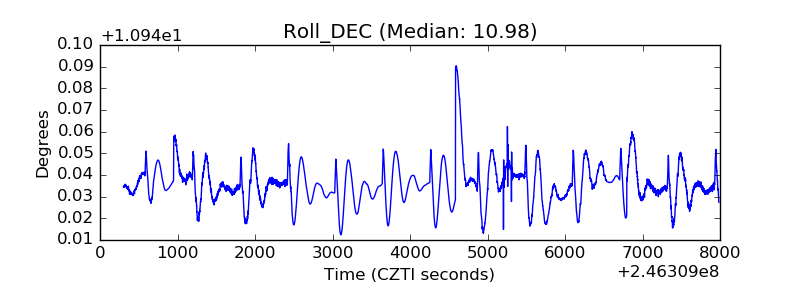 |
| _Roll_RA |  |
| Veto Counter | 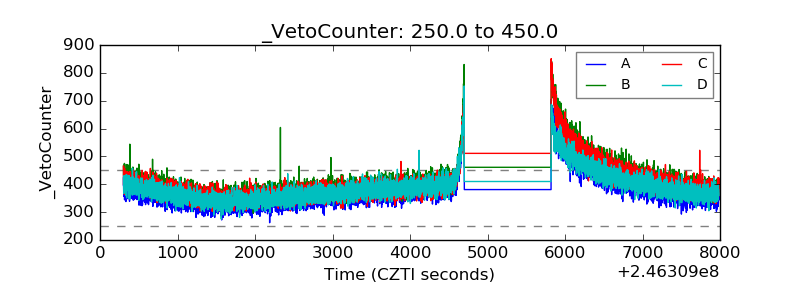 |