| Param | Original file | Final file |
|---|---|---|
| Filename | modeM0/AS1A04_049T01_9000001632cztM0_level2.fits | modeM0/AS1A04_049T01_9000001632cztM0_level2_quad_clean.evt |
| Size (bytes) | 259,467,840 | 220,795,200 |
| Size | 247.4 MB | 210.6 MB |
| Events in quadrant A | 1,537,488 | 1,198,042 |
| Events in quadrant B | 1,490,608 | 1,195,008 |
| Events in quadrant C | 1,587,078 | 1,262,307 |
| Events in quadrant D | 1,312,688 | 1,102,317 |
| Mode M9 | |||
|---|---|---|---|
| Quadrant | BADHDUFLAG | Total packets | Discarded packets |
| A | 0 | 60 | 0 |
| B | 0 | 60 | 0 |
| C | 0 | 61 | 0 |
| D | 0 | 60 | 0 |
| Mode SS | |||
|---|---|---|---|
| Quadrant | BADHDUFLAG | Total packets | Discarded packets |
| A | 0 | 572 | 0 |
| B | 0 | 576 | 0 |
| C | 0 | 572 | 0 |
| D | 0 | 570 | 0 |
| Mode M0 | |||
|---|---|---|---|
| Quadrant | BADHDUFLAG | Total packets | Discarded packets |
| A | 0 | 80802 | 0 |
| B | 0 | 84131 | 0 |
| C | 0 | 57417 | 0 |
| D | 0 | 78641 | 0 |
| Quadrant | Total seconds | Saturated seconds | Saturation percentage |
|---|---|---|---|
| A | 27999 | 1821 | 6.503804% |
| B | 27997 | 2531 | 9.040254% |
| C | 28088 | 136 | 0.484193% |
| D | 28041 | 1303 | 4.646767% |
Noise dominated data is calculated using 1-second bins in cleaned event files. If a bin has >2000 counts, and if more than 50% of those come from <1% of pixels, then it is considered to be noise-dominated and hence unusable.
| Quadrant | # 1 sec bins | Bins with >0 counts | Bins with >2000 counts | High rate bins dominated by noise | Noise dominated (total time) | Noise dominated (detector-on time) | Marked lightcurve |
|---|---|---|---|---|---|---|---|
| A | 35359 | 28086 | 0 | 0 | 0.00% | 0.00% |  |
| B | 35359 | 28124 | 0 | 0 | 0.00% | 0.00% |  |
| C | 35359 | 28221 | 0 | 0 | 0.00% | 0.00% |  |
| D | 35359 | 28121 | 0 | 0 | 0.00% | 0.00% |  |
Top three noisy pixels from each quadrant. If the there are fewer than three noisy pixels in the level2.evt file, extra rows are filled as -1
| Pixel properties | Quadrant properties | ||||||
|---|---|---|---|---|---|---|---|
| Quadrant | DetID | PixID | Counts | Sigma | Mean | Median | Sigma |
| A | 0 | 29 | 1506 | 11.04 | 400 | 377 | 102.3 |
| A | 7 | 110 | 1245 | 8.49 | 400 | 377 | 102.3 |
| A | 0 | 30 | 1160 | 7.66 | 400 | 377 | 102.3 |
| B | 2 | 9 | 1291 | 11.62 | 394 | 376 | 78.8 |
| B | 5 | 128 | 1006 | 8.0 | 394 | 376 | 78.8 |
| B | 2 | 8 | 1004 | 7.97 | 394 | 376 | 78.8 |
| C | 1 | 80 | 1208 | 7.44 | 418 | 390 | 109.8 |
| C | 1 | 81 | 1139 | 6.82 | 418 | 390 | 109.8 |
| C | 2 | 191 | 1070 | 6.19 | 418 | 390 | 109.8 |
| D | 6 | 231 | 991 | 6.37 | 375 | 341 | 102.0 |
| D | 3 | 14 | 988 | 6.34 | 375 | 341 | 102.0 |
| D | 3 | 31 | 949 | 5.96 | 375 | 341 | 102.0 |
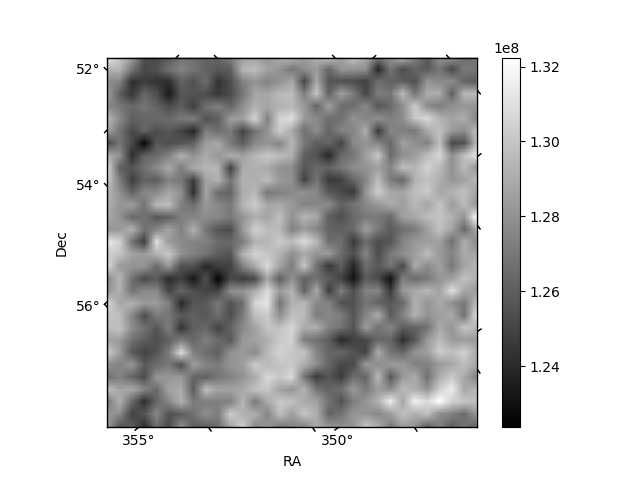
Histogram calculated using DETX and DETY for each event in the final _common_clean file
| Quadrant A |  |
 |
Quadrant B |
|---|---|---|---|
| Quadrant D |  |
 |
Quadrant C |
| Plot type | Count rate plots | Images |
|---|---|---|
| Comparison with Poisson distribution Blue bars denote a histogram of data divided into 1 sec bins. Red curve is a Poisson curve with rate = median count rate of data. |
 |
 |
| Quadrant-wise count rates Data is divided into 100 sec bins |
 |
|
| Module-wise count rates for Quadrant A Data is divided into 100 sec bins |
 |
 |
| Module-wise count rates for Quadrant B Data is divided into 100 sec bins |
 |
 |
| Module-wise count rates for Quadrant C Data is divided into 100 sec bins |
 |
 |
| Module-wise count rates for Quadrant D Data is divided into 100 sec bins |
 |
 |
| Parameter | Plot |
|---|---|
| CZT HV Monitor |  |
| D_VDD |  |
| Temperature 1 |  |
| Veto HV Monitor |  |
| Veto LLD | 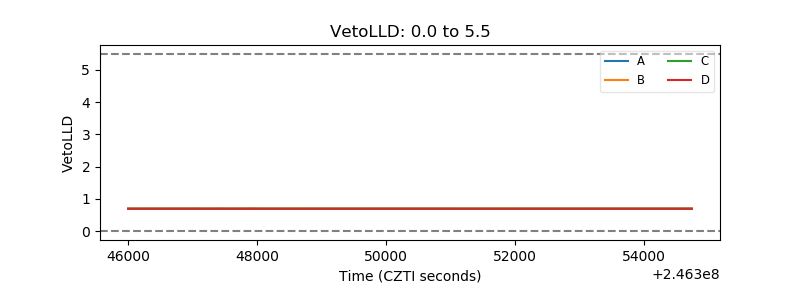 |
| Alpha Counter |  |
| _CPM_Rate |  |
| CZT Counter |  |
| +2.5 Volts monitor |  |
| +5 Volts monitor |  |
| _ROLL_ROT |  |
| _Roll_DEC |  |
| _Roll_RA | 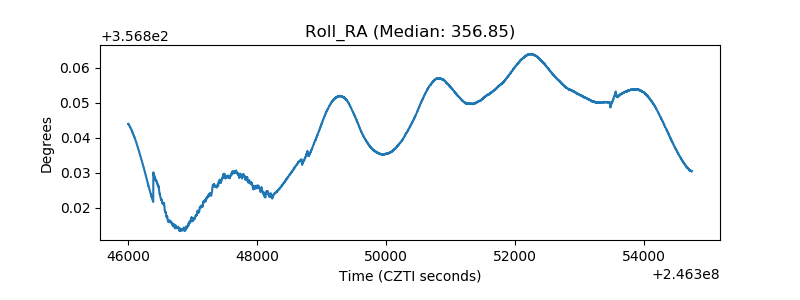 |
| Veto Counter |  |