| Param | Original file | Final file |
|---|---|---|
| Filename | modeM0/AS1A04_049T01_9000001632_11172cztM0_level2.evt | modeM0/AS1A04_049T01_9000001632_11172cztM0_level2_quad_clean.evt |
| Size (bytes) | 168,433,920 | 33,183,360 |
| Size | 160.6 MB | 31.6 MB |
| Events in quadrant A | 1,856,494 | 208,539 |
| Events in quadrant B | 1,319,780 | 225,431 |
| Events in quadrant C | 826,013 | 235,690 |
| Events in quadrant D | 987,772 | 216,637 |
| Mode M9 | |||
|---|---|---|---|
| Quadrant | BADHDUFLAG | Total packets | Discarded packets |
| A | 0 | 12 | 0 |
| B | 0 | 12 | 0 |
| C | 0 | 12 | 0 |
| D | 0 | 12 | 0 |
| Mode SS | |||
|---|---|---|---|
| Quadrant | BADHDUFLAG | Total packets | Discarded packets |
| A | 0 | 36 | 0 |
| B | 0 | 36 | 0 |
| C | 0 | 36 | 0 |
| D | 0 | 36 | 0 |
| Mode M0 | |||
|---|---|---|---|
| Quadrant | BADHDUFLAG | Total packets | Discarded packets |
| A | 0 | 6592 | 2 |
| B | 0 | 5042 | 10 |
| C | 0 | 3421 | 1 |
| D | 0 | 3988 | 1 |
| Quadrant | Total seconds | Saturated seconds | Saturation percentage |
|---|---|---|---|
| A | 1595 | 315 | 19.749216% |
| B | 1593 | 145 | 9.102323% |
| C | 1595 | 6 | 0.376176% |
| D | 1595 | 12 | 0.752351% |
Noise dominated data is calculated using 1-second bins in cleaned event files. If a bin has >2000 counts, and if more than 50% of those come from <1% of pixels, then it is considered to be noise-dominated and hence unusable.
| Quadrant | # 1 sec bins | Bins with >0 counts | Bins with >2000 counts | High rate bins dominated by noise | Noise dominated (total time) | Noise dominated (detector-on time) | Marked lightcurve |
|---|---|---|---|---|---|---|---|
| A | 2850 | 1596 | 152 | 152 | 5.33% | 9.52% | 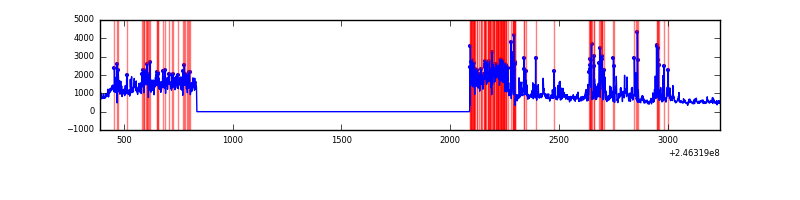 |
| B | 2850 | 1596 | 76 | 76 | 2.67% | 4.76% | 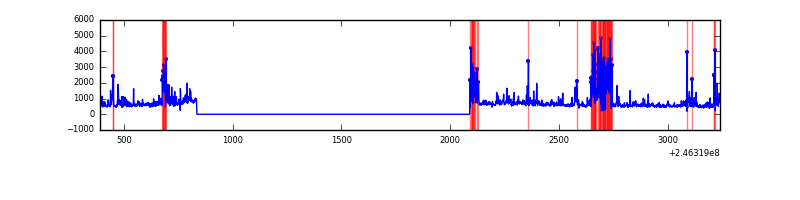 |
| C | 2850 | 1596 | 2 | 2 | 0.07% | 0.13% | 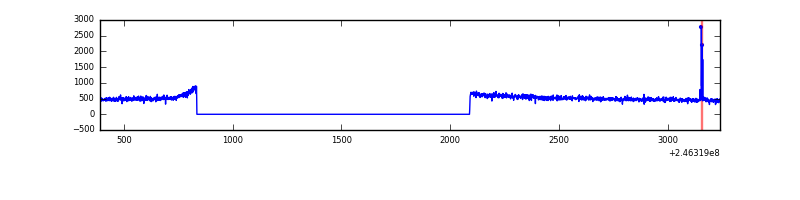 |
| D | 2850 | 1596 | 4 | 4 | 0.14% | 0.25% | 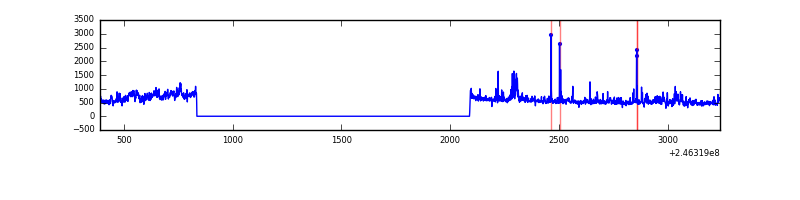 |
Top three noisy pixels from each quadrant. If the there are fewer than three noisy pixels in the level2.evt file, extra rows are filled as -1
| Pixel properties | Quadrant properties | ||||||
|---|---|---|---|---|---|---|---|
| Quadrant | DetID | PixID | Counts | Sigma | Mean | Median | Sigma |
| A | 8 | 5 | 505580 | 12428.5 | 195 | 190 | 40.7 |
| A | 8 | 15 | 475108 | 11679.13 | 195 | 190 | 40.7 |
| A | 14 | 238 | 116228 | 2853.59 | 195 | 190 | 40.7 |
| B | 10 | 16 | 221171 | 5510.93 | 205 | 200 | 40.1 |
| B | 4 | 239 | 135993 | 3386.62 | 205 | 200 | 40.1 |
| B | 15 | 204 | 46038 | 1143.18 | 205 | 200 | 40.1 |
| C | 14 | 234 | 8414 | 164.32 | 209 | 209 | 49.9 |
| C | 13 | 61 | 1594 | 27.74 | 209 | 209 | 49.9 |
| C | 14 | 67 | 1186 | 19.57 | 209 | 209 | 49.9 |
| D | 10 | 157 | 91470 | 1757.74 | 205 | 198 | 51.9 |
| D | 1 | 52 | 53098 | 1018.76 | 205 | 198 | 51.9 |
| D | 8 | 195 | 11061 | 209.2 | 205 | 198 | 51.9 |
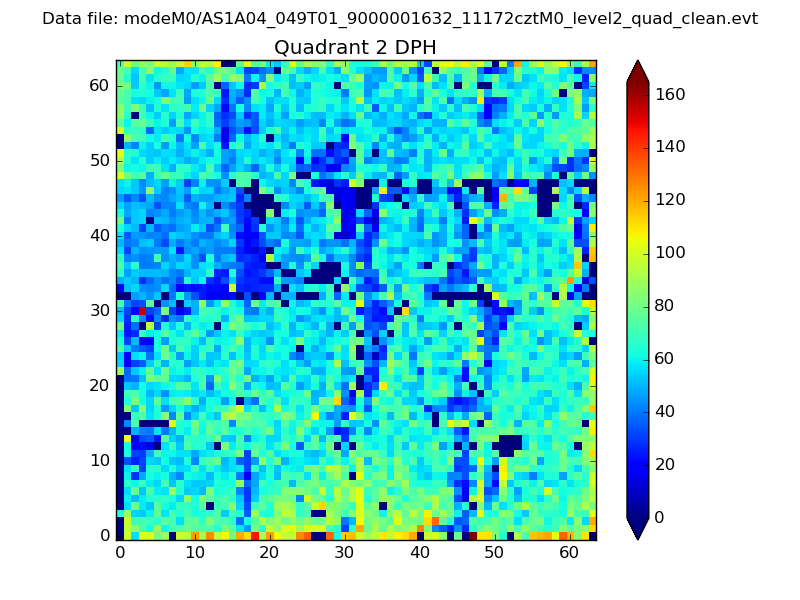
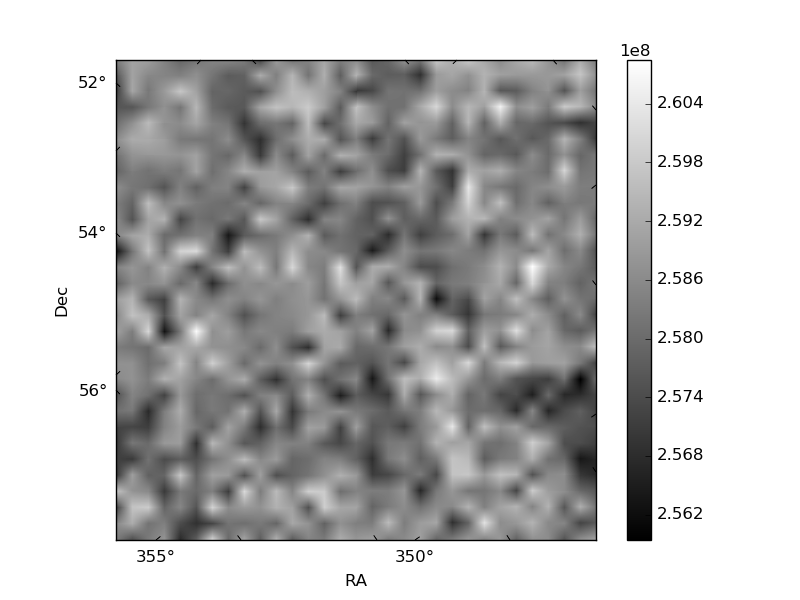
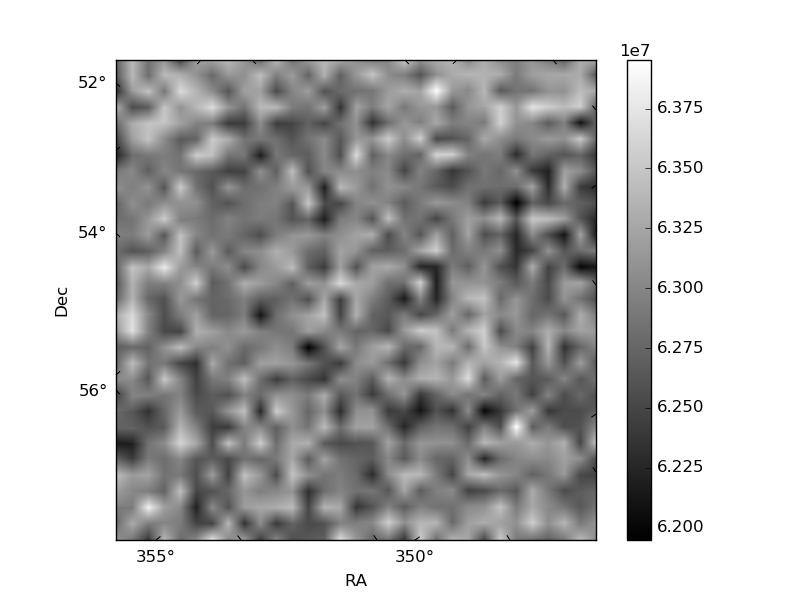
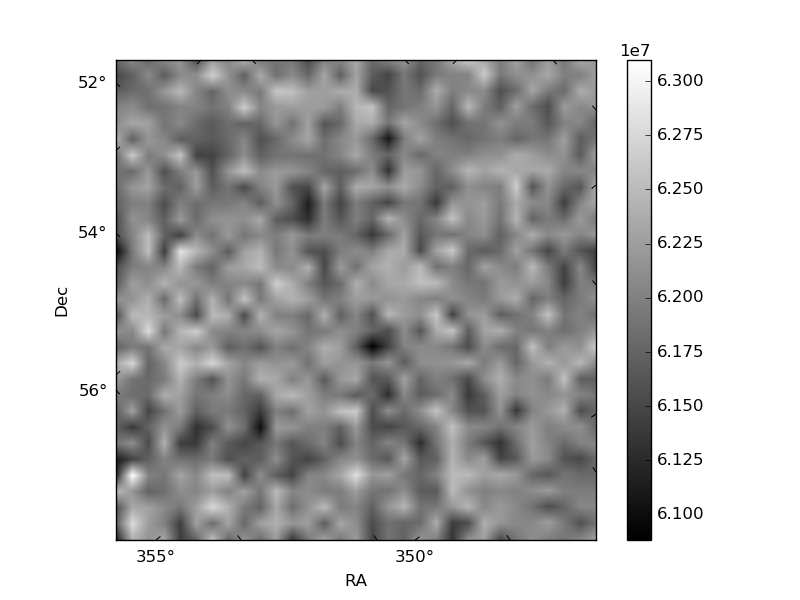
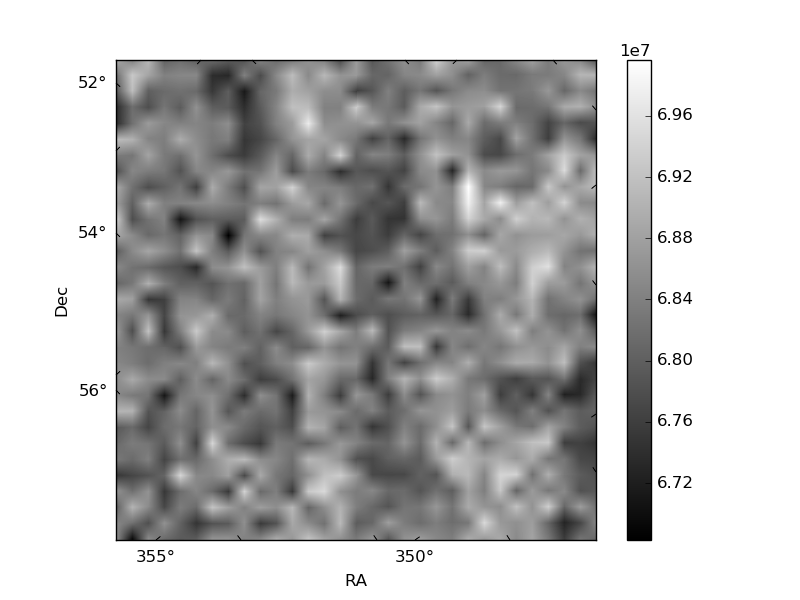
Histogram calculated using DETX and DETY for each event in the final _common_clean file
| Quadrant A | 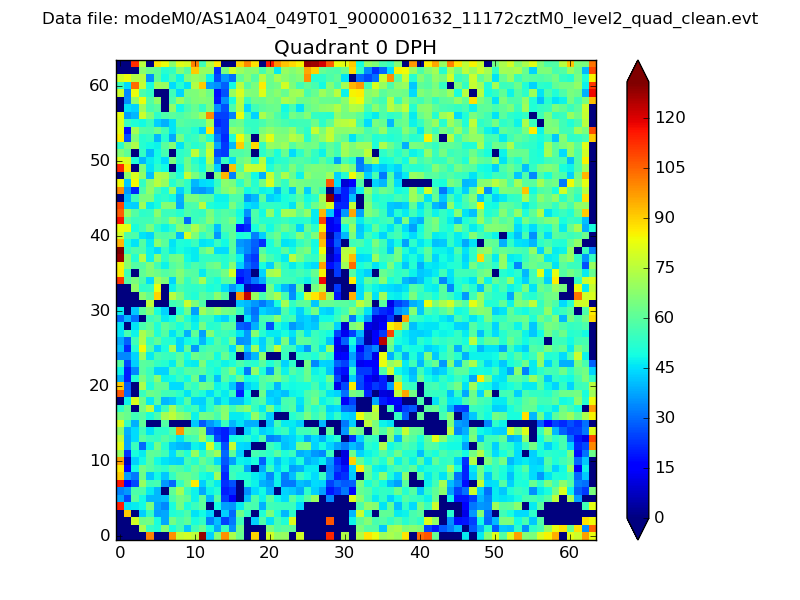 |
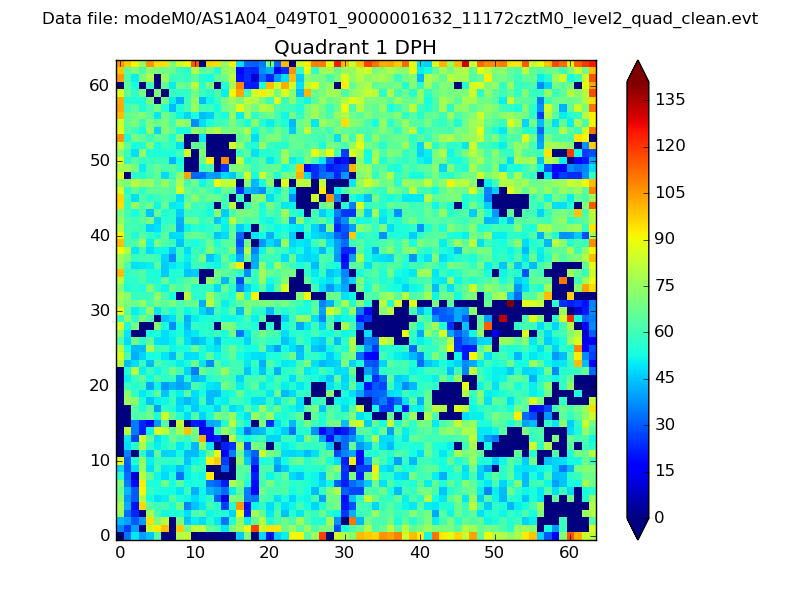 |
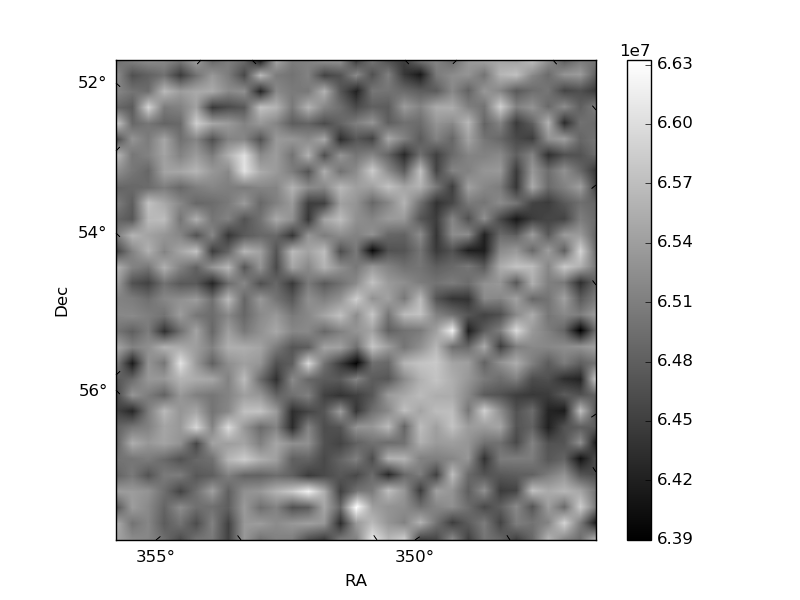
Quadrant B |
|---|---|---|---|
| Quadrant D | 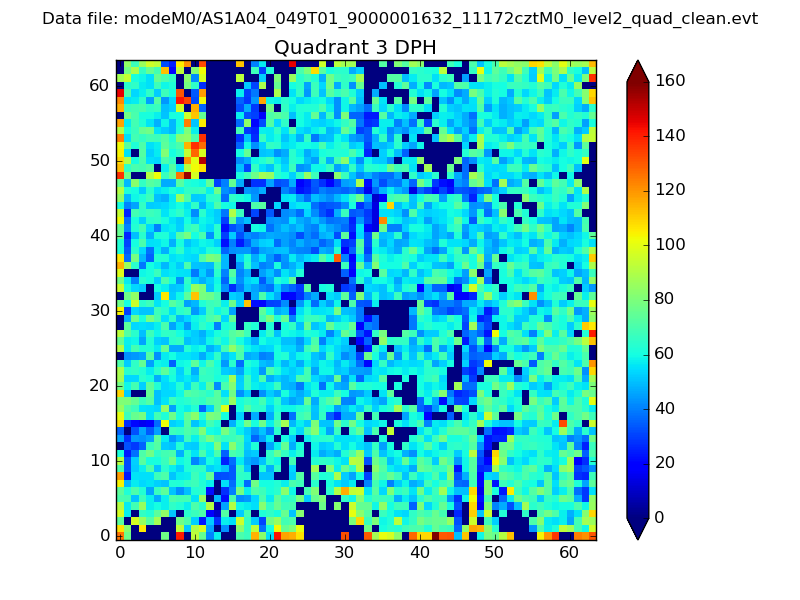 |
 |
Quadrant C |
| Plot type | Count rate plots | Images |
|---|---|---|
| Comparison with Poisson distribution Blue bars denote a histogram of data divided into 1 sec bins. Red curve is a Poisson curve with rate = median count rate of data. |
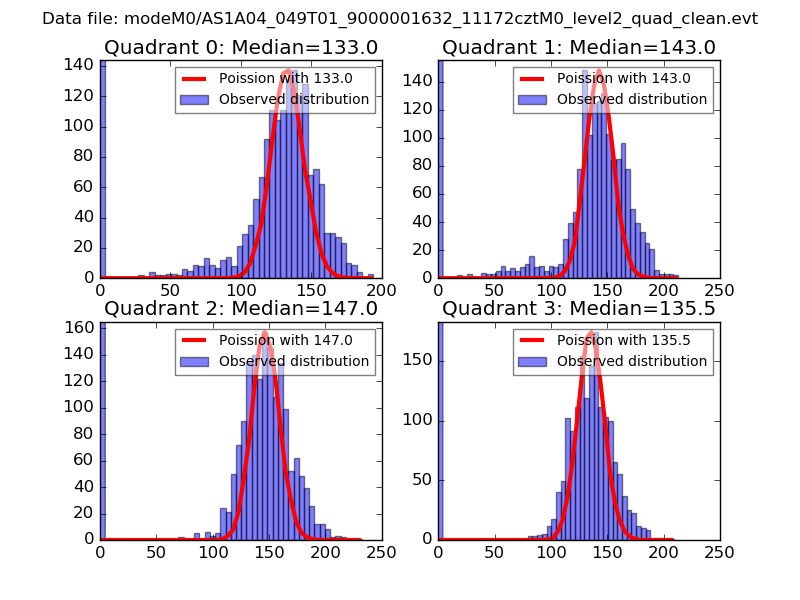 |
 |
| Quadrant-wise count rates Data is divided into 100 sec bins |
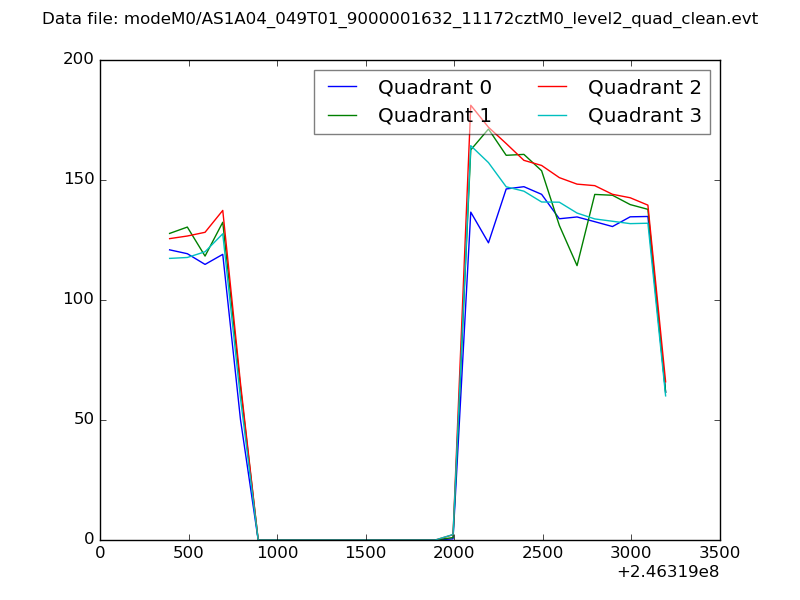 |
|
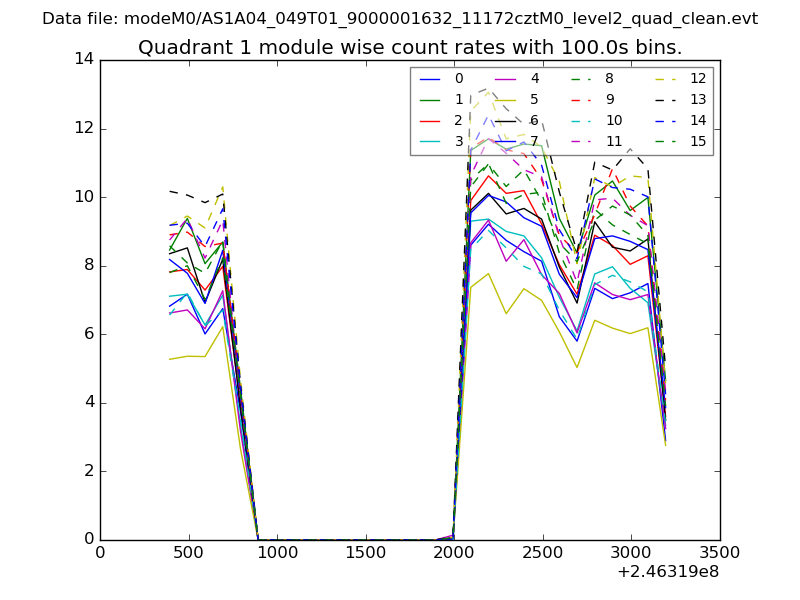
| Module-wise count rates for Quadrant A Data is divided into 100 sec bins |
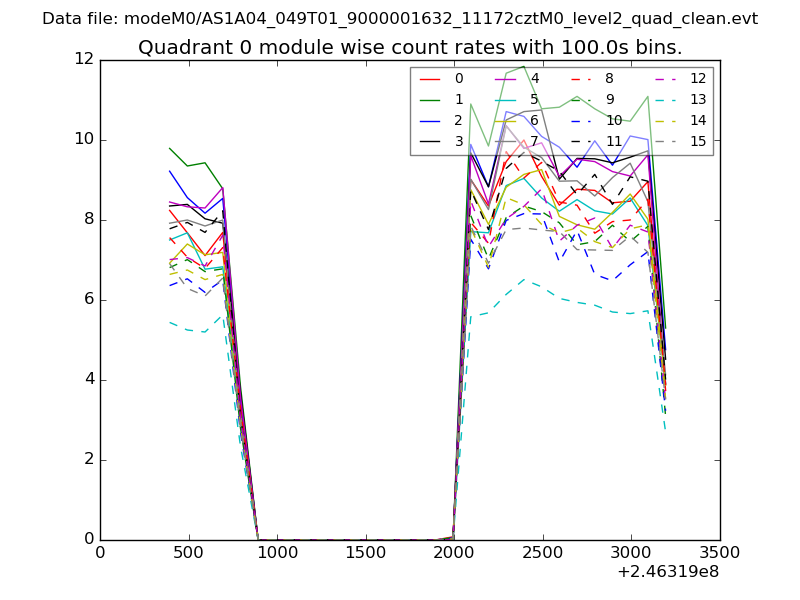 |
 |
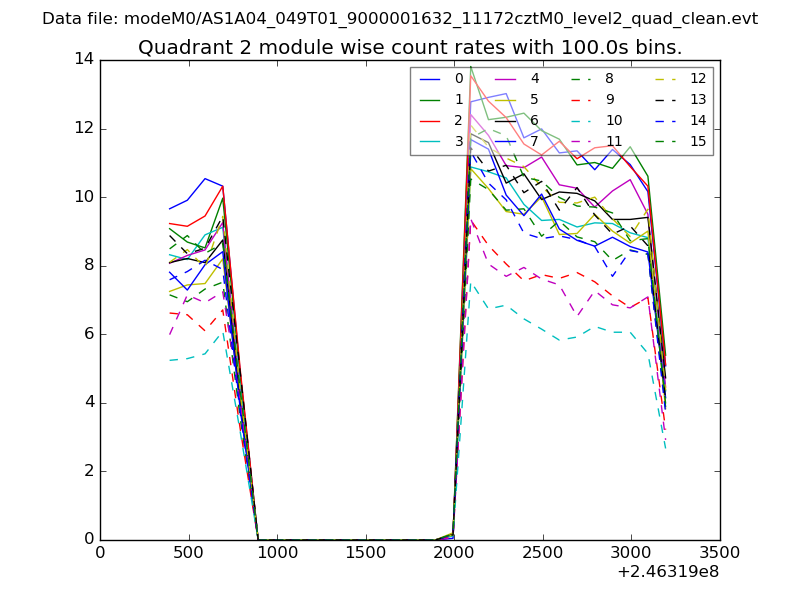
| Module-wise count rates for Quadrant B Data is divided into 100 sec bins |
 |
 |
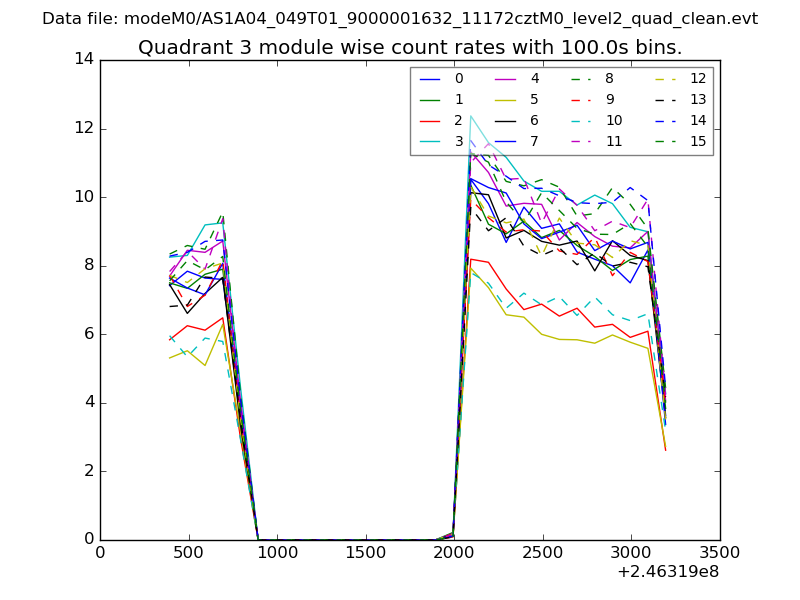
| Module-wise count rates for Quadrant C Data is divided into 100 sec bins |
 |
 |
| Module-wise count rates for Quadrant D Data is divided into 100 sec bins |
 |
 |
| Parameter | Plot |
|---|---|
| CZT HV Monitor | 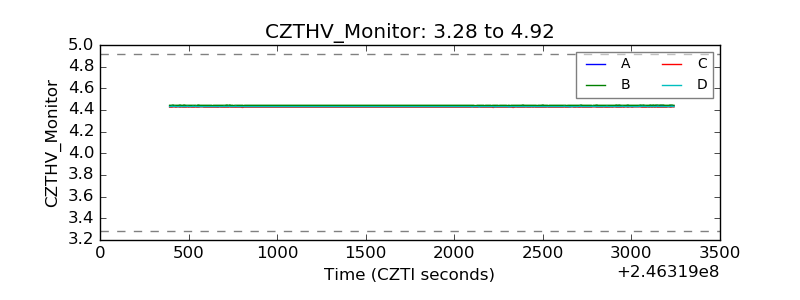 |
| D_VDD | 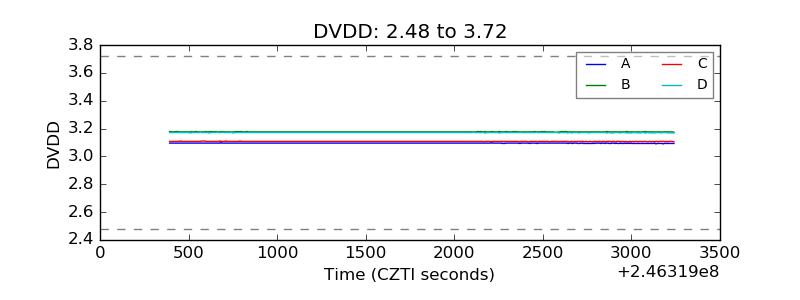 |
| Temperature 1 |  |
| Veto HV Monitor | 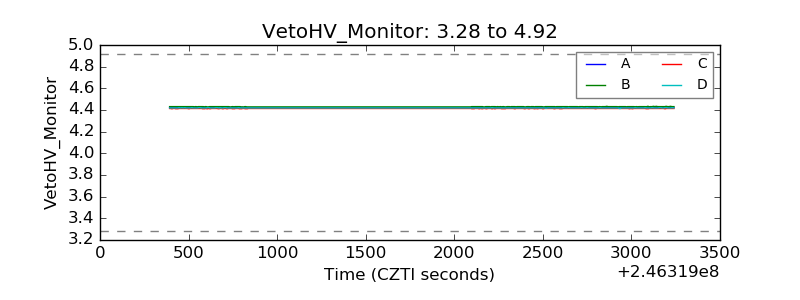 |
| Veto LLD | 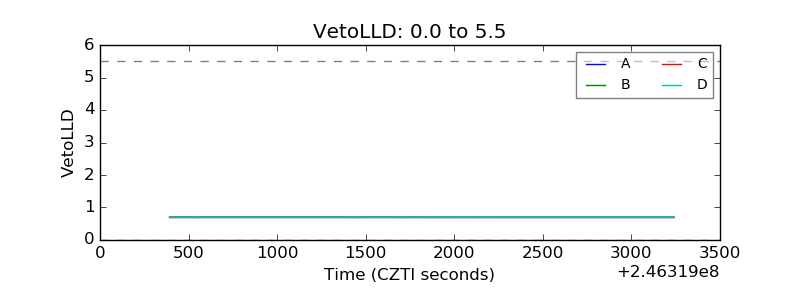 |
| Alpha Counter | 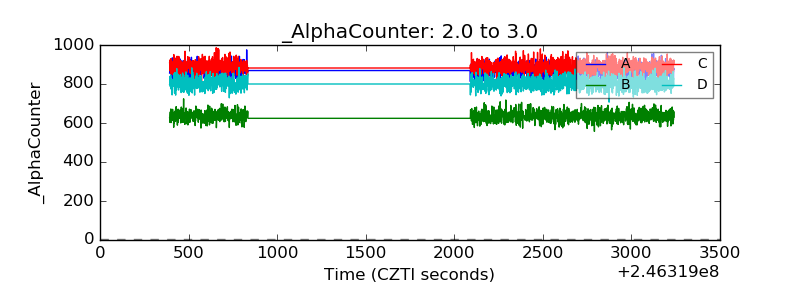 |
| _CPM_Rate | 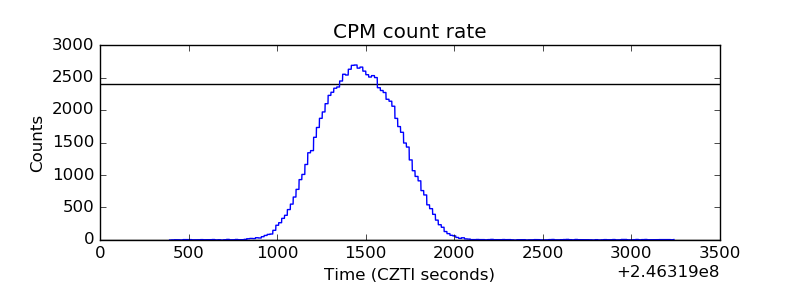 |
| CZT Counter | 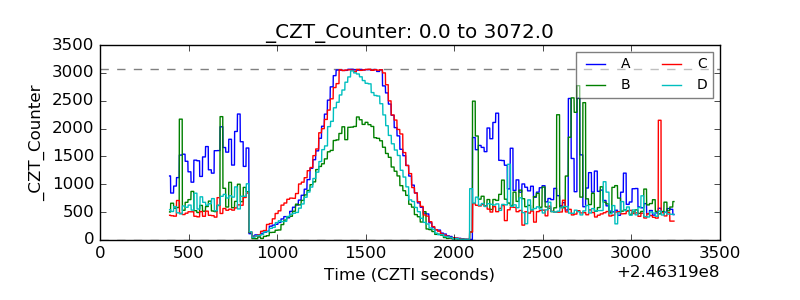 |
| +2.5 Volts monitor |  |
| +5 Volts monitor |  |
| _ROLL_ROT | 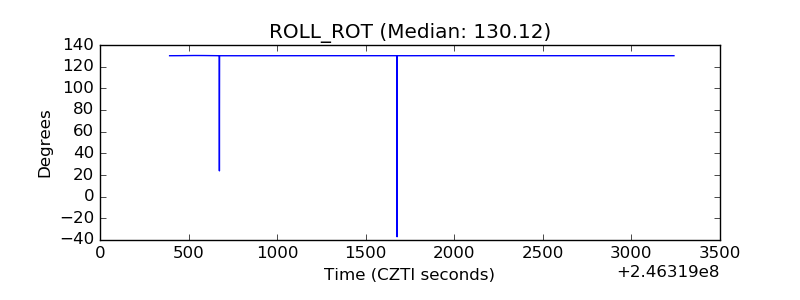 |
| _Roll_DEC | 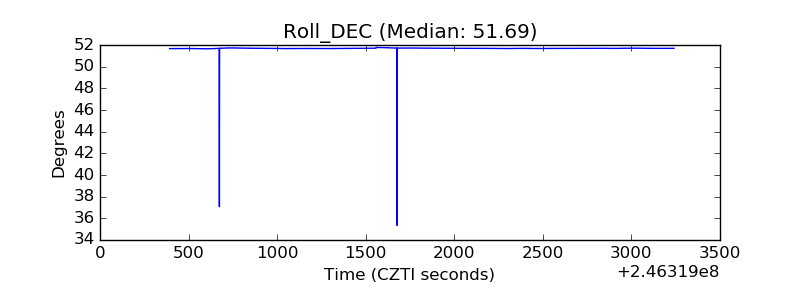 |
| _Roll_RA | 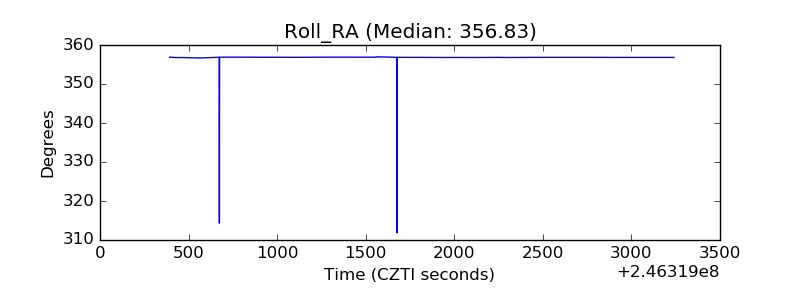 |
| Veto Counter | 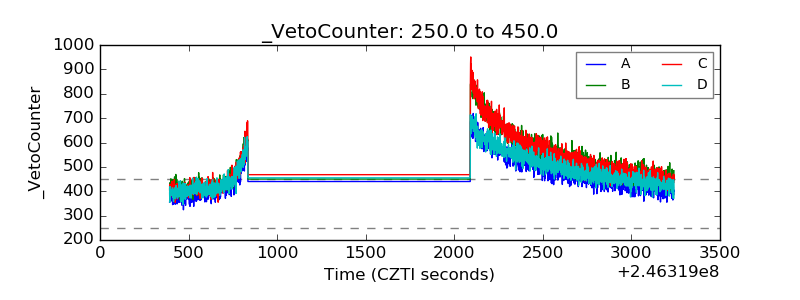 |