| Param | Original file | Final file |
|---|---|---|
| Filename | modeM0/AS1A04_049T01_9000001632_11173cztM0_level2.evt | modeM0/AS1A04_049T01_9000001632_11173cztM0_level2_quad_clean.evt |
| Size (bytes) | 291,288,960 | 45,872,640 |
| Size | 277.8 MB | 43.7 MB |
| Events in quadrant A | 2,390,463 | 291,395 |
| Events in quadrant B | 2,851,689 | 283,898 |
| Events in quadrant C | 1,514,018 | 307,746 |
| Events in quadrant D | 1,851,126 | 282,395 |
| Mode M9 | |||
|---|---|---|---|
| Quadrant | BADHDUFLAG | Total packets | Discarded packets |
| A | 0 | 13 | 0 |
| B | 0 | 13 | 0 |
| C | 0 | 13 | 0 |
| D | 0 | 13 | 0 |
| Mode SS | |||
|---|---|---|---|
| Quadrant | BADHDUFLAG | Total packets | Discarded packets |
| A | 0 | 81 | 19 |
| B | 0 | 82 | 18 |
| C | 0 | 82 | 18 |
| D | 0 | 83 | 19 |
| Mode M0 | |||
|---|---|---|---|
| Quadrant | BADHDUFLAG | Total packets | Discarded packets |
| A | 0 | 11912 | 2658 |
| B | 0 | 13099 | 2492 |
| C | 0 | 8243 | 1695 |
| D | 0 | 9443 | 1886 |
| Quadrant | Total seconds | Saturated seconds | Saturation percentage |
|---|---|---|---|
| A | 3123 | 146 | 4.674992% |
| B | 3151 | 441 | 13.995557% |
| C | 3153 | 21 | 0.666032% |
| D | 3144 | 53 | 1.685751% |
Noise dominated data is calculated using 1-second bins in cleaned event files. If a bin has >2000 counts, and if more than 50% of those come from <1% of pixels, then it is considered to be noise-dominated and hence unusable.
| Quadrant | # 1 sec bins | Bins with >0 counts | Bins with >2000 counts | High rate bins dominated by noise | Noise dominated (total time) | Noise dominated (detector-on time) | Marked lightcurve |
|---|---|---|---|---|---|---|---|
| A | 4788 | 3184 | 47 | 47 | 0.98% | 1.48% | 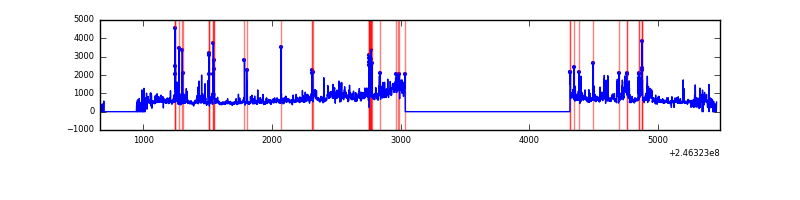 |
| B | 4790 | 3213 | 238 | 238 | 4.97% | 7.41% | 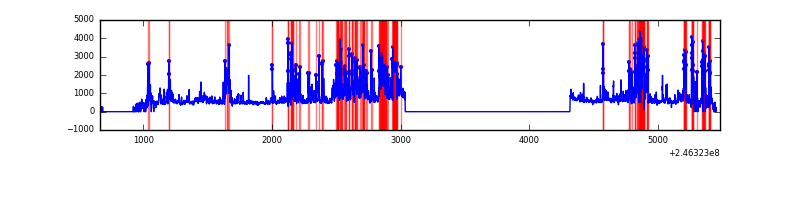 |
| C | 4530 | 3208 | 0 | 0 | 0.00% | 0.00% | 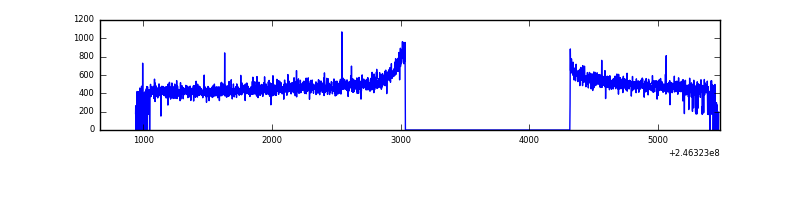 |
| D | 4807 | 3207 | 9 | 9 | 0.19% | 0.28% | 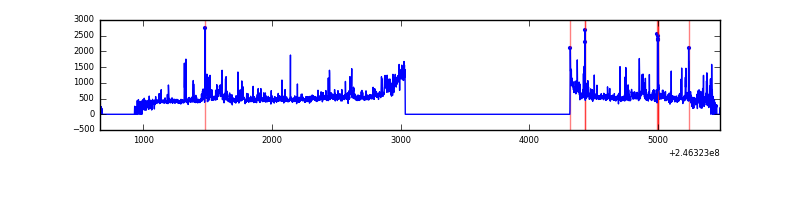 |
Top three noisy pixels from each quadrant. If the there are fewer than three noisy pixels in the level2.evt file, extra rows are filled as -1
| Pixel properties | Quadrant properties | ||||||
|---|---|---|---|---|---|---|---|
| Quadrant | DetID | PixID | Counts | Sigma | Mean | Median | Sigma |
| A | 8 | 5 | 405312 | 5139.01 | 385 | 377 | 78.8 |
| A | 8 | 15 | 394952 | 5007.53 | 385 | 377 | 78.8 |
| A | 14 | 238 | 100009 | 1264.43 | 385 | 377 | 78.8 |
| B | 4 | 239 | 653494 | 9104.86 | 377 | 368 | 71.7 |
| B | 10 | 245 | 414068 | 5767.16 | 377 | 368 | 71.7 |
| B | 10 | 16 | 187735 | 2611.98 | 377 | 368 | 71.7 |
| C | 13 | 61 | 2937 | 28.24 | 387 | 389 | 90.2 |
| C | 14 | 234 | 1735 | 14.92 | 387 | 389 | 90.2 |
| C | 1 | 3 | 1492 | 12.23 | 387 | 389 | 90.2 |
| D | 10 | 157 | 96310 | 1059.57 | 377 | 366 | 90.6 |
| D | 13 | 152 | 71582 | 786.48 | 377 | 366 | 90.6 |
| D | 2 | 14 | 70582 | 775.44 | 377 | 366 | 90.6 |
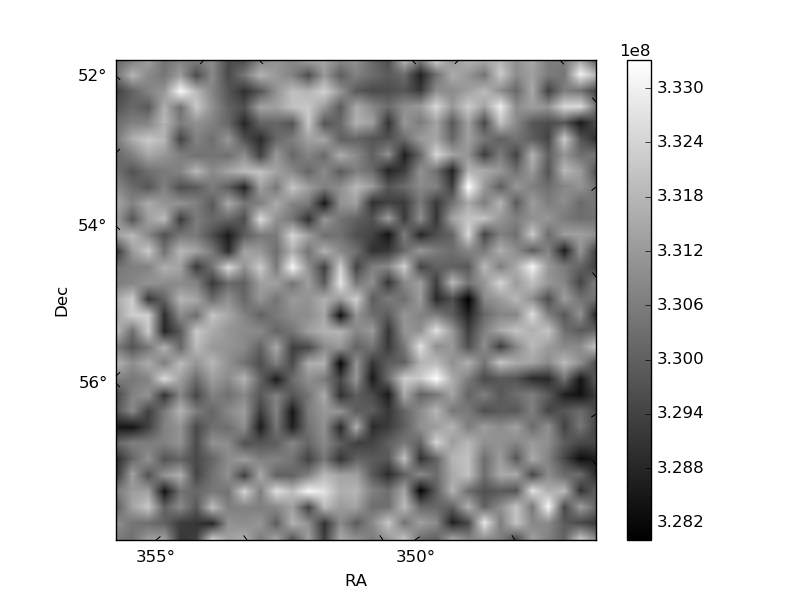
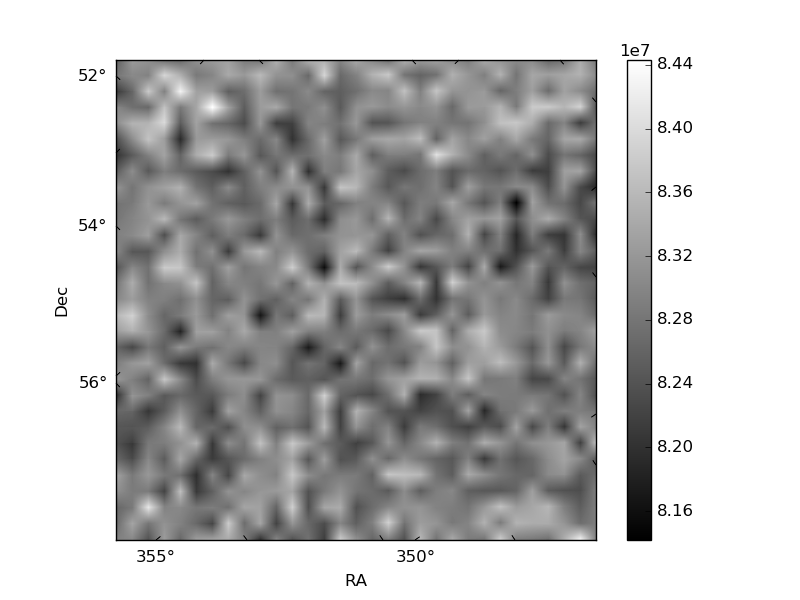
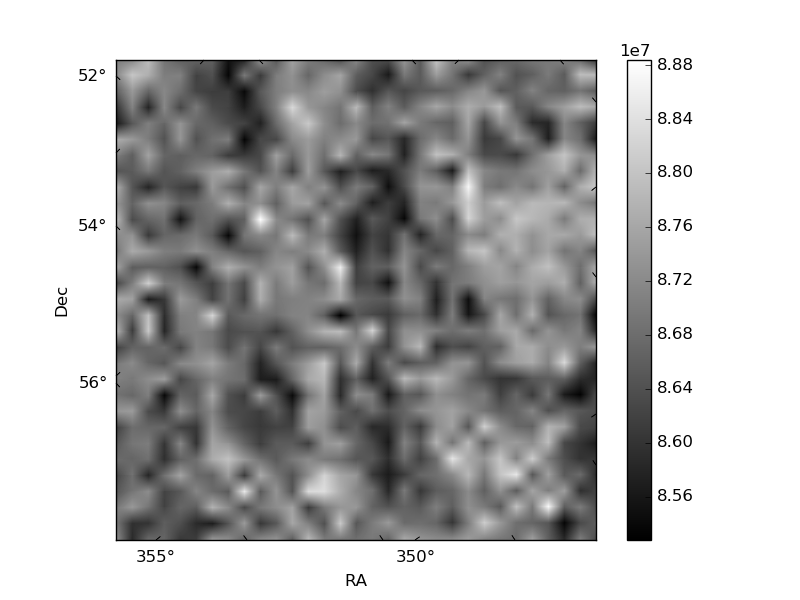
Histogram calculated using DETX and DETY for each event in the final _common_clean file
| Quadrant A | 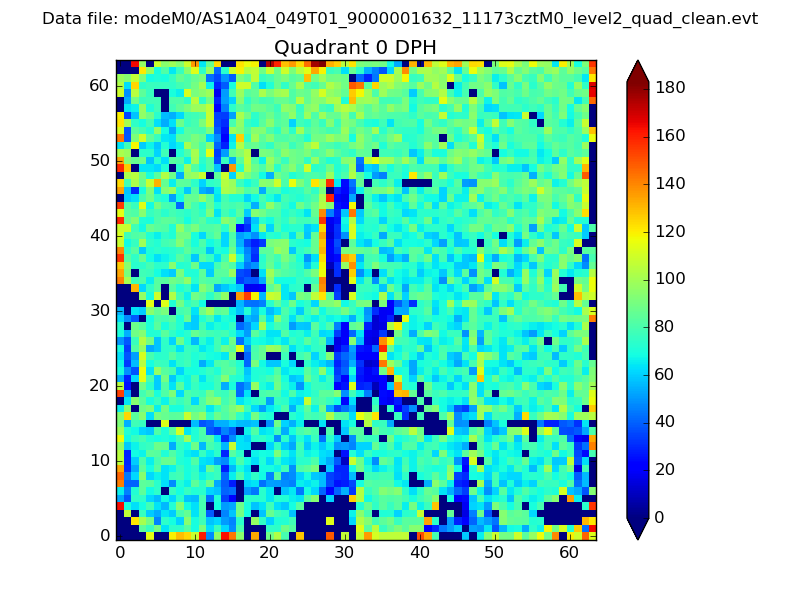 |
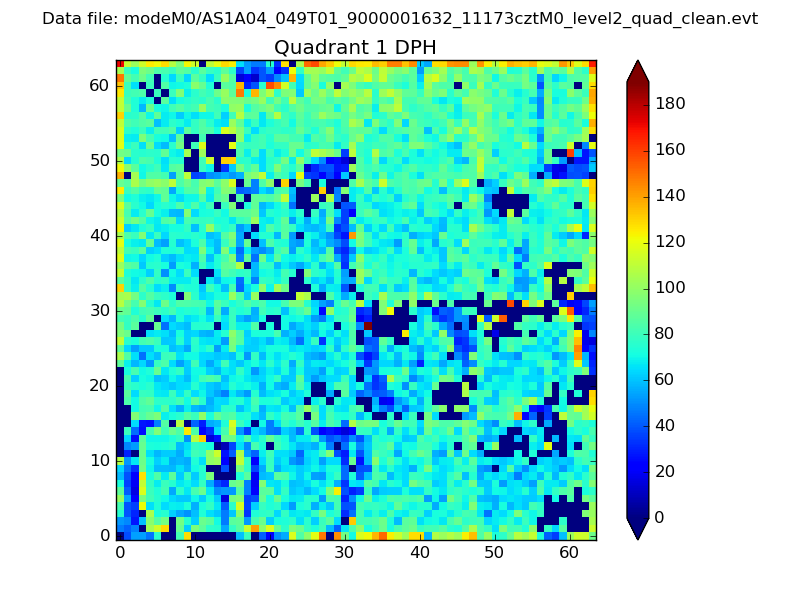 |
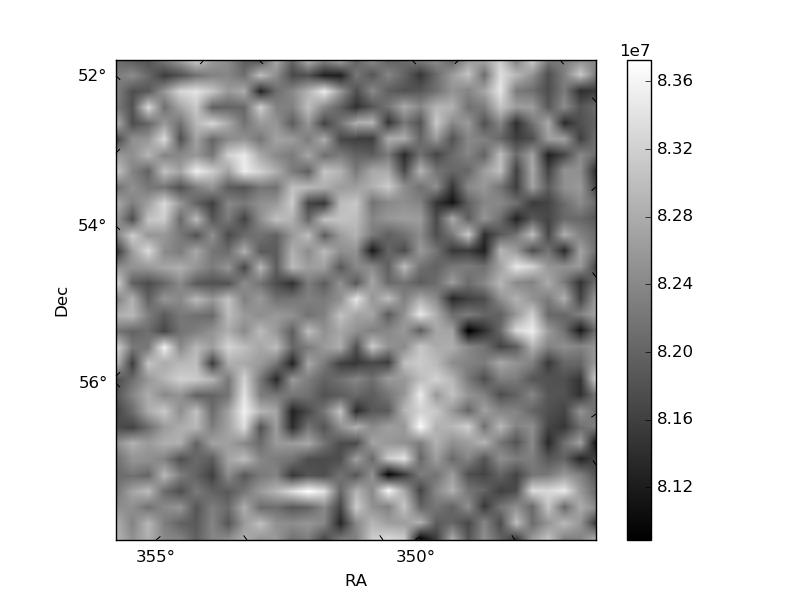
Quadrant B |
|---|---|---|---|
| Quadrant D | 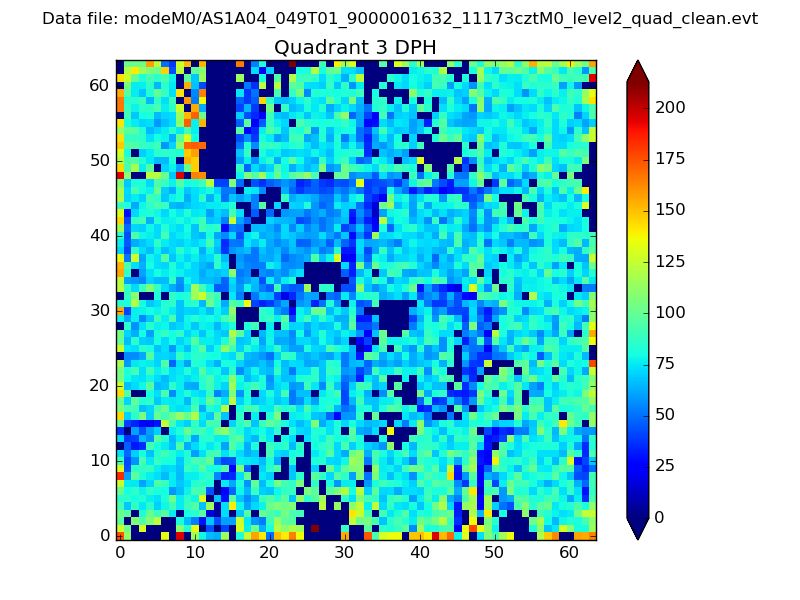 |
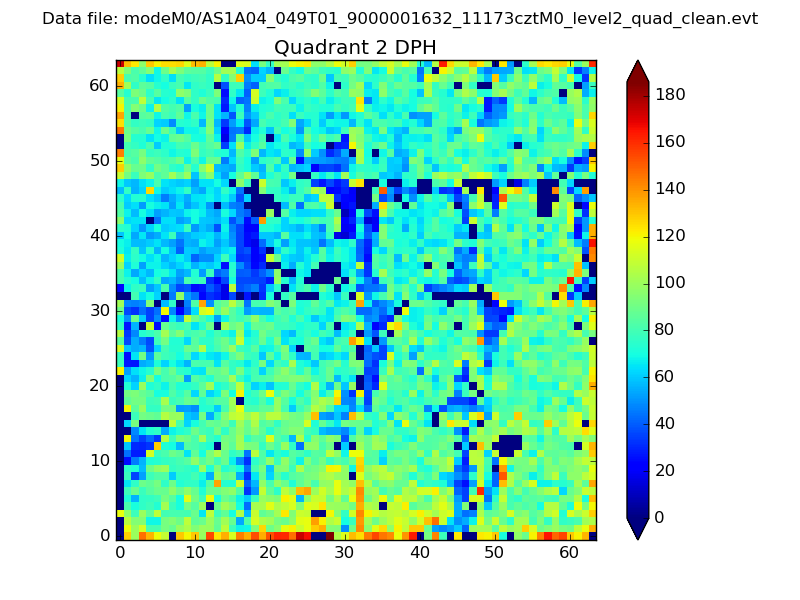 |
Quadrant C |
| Plot type | Count rate plots | Images |
|---|---|---|
| Comparison with Poisson distribution Blue bars denote a histogram of data divided into 1 sec bins. Red curve is a Poisson curve with rate = median count rate of data. |
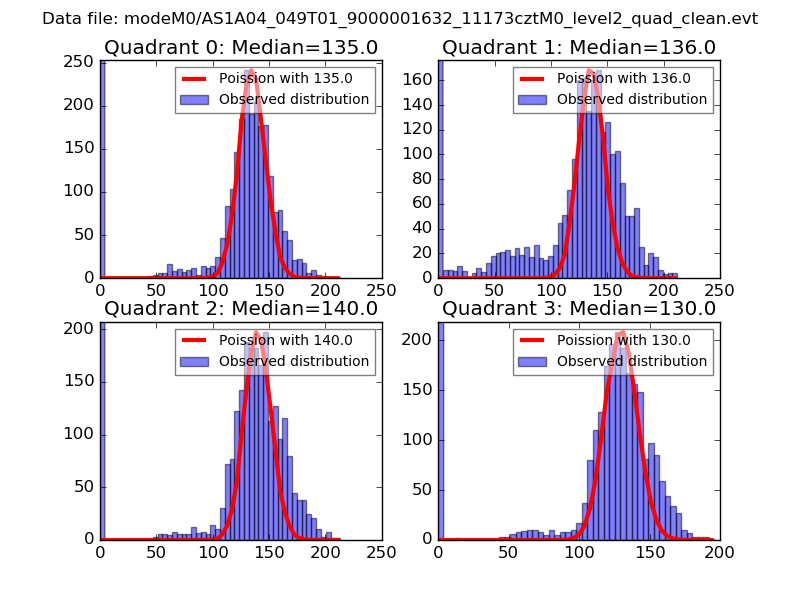 |
 |
| Quadrant-wise count rates Data is divided into 100 sec bins |
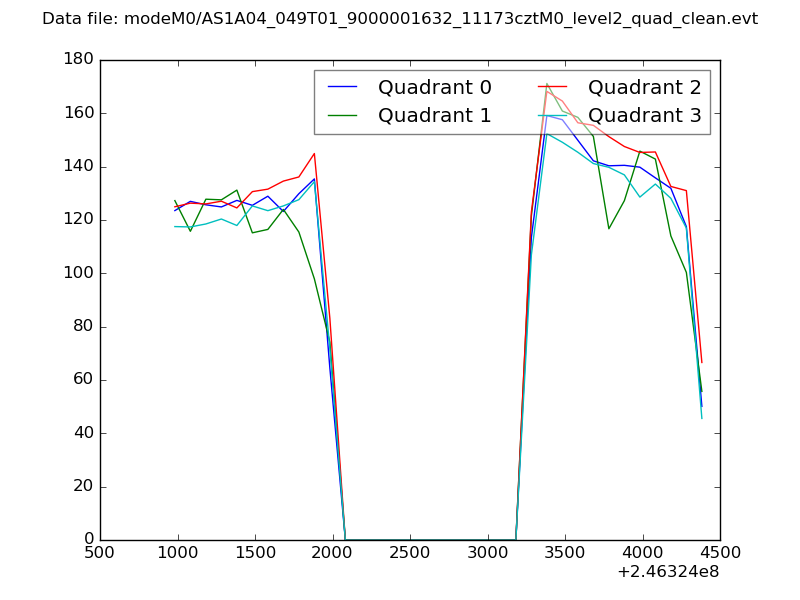 |
|
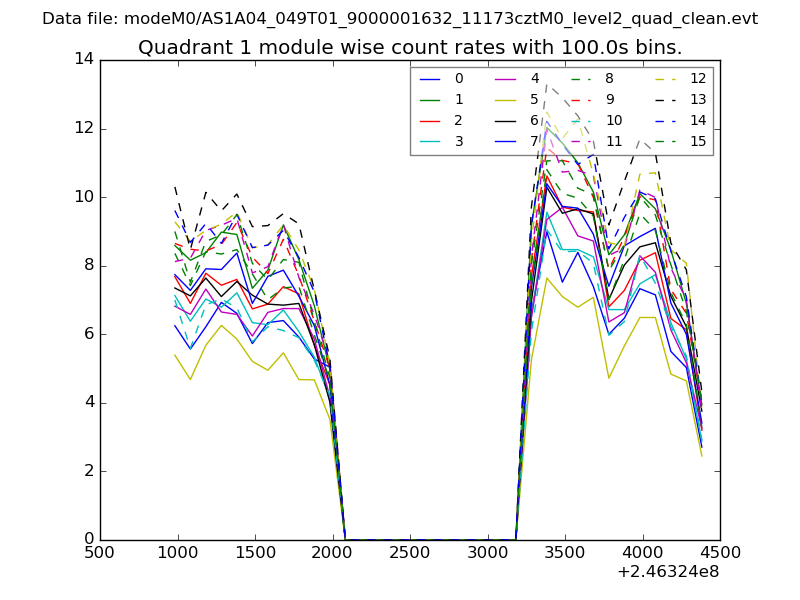
| Module-wise count rates for Quadrant A Data is divided into 100 sec bins |
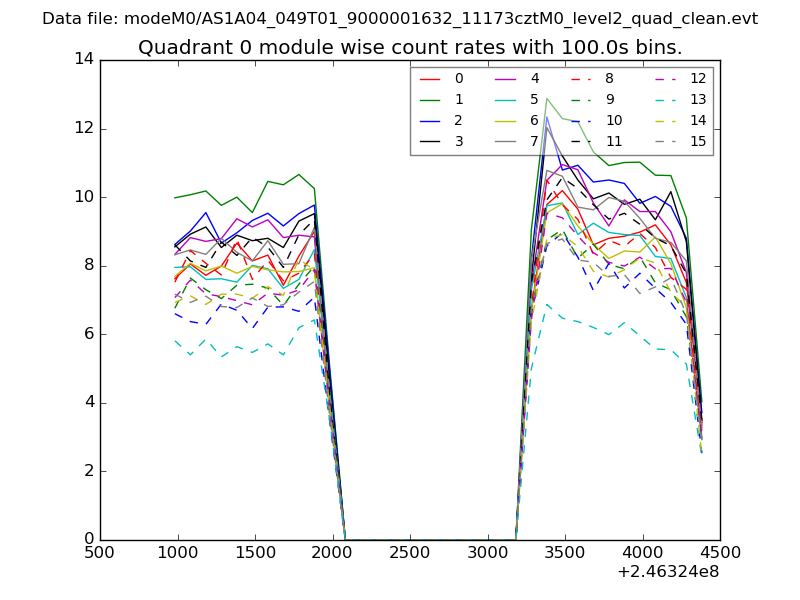 |
 |
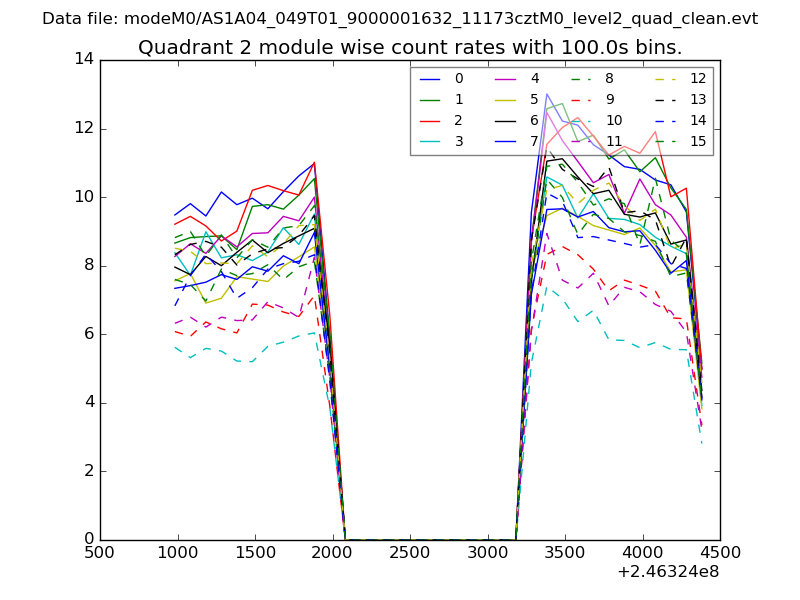
| Module-wise count rates for Quadrant B Data is divided into 100 sec bins |
 |
 |
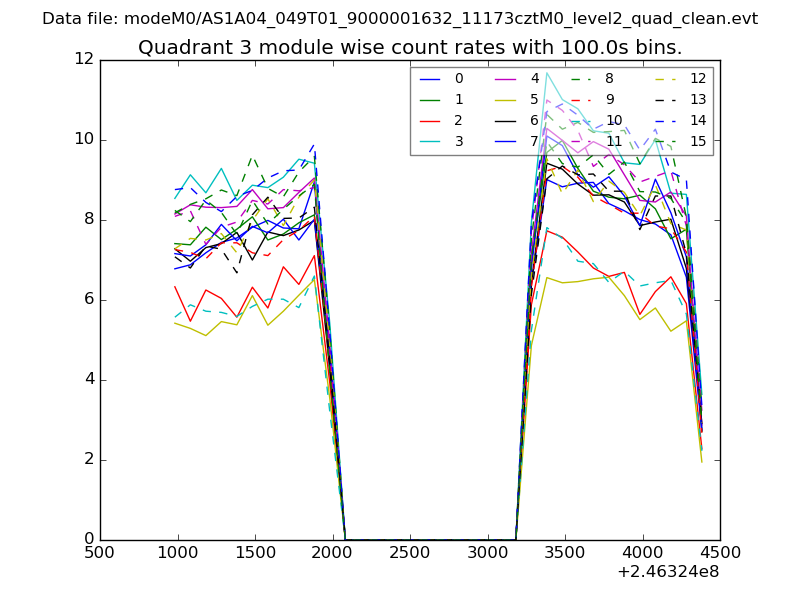
| Module-wise count rates for Quadrant C Data is divided into 100 sec bins |
 |
 |
| Module-wise count rates for Quadrant D Data is divided into 100 sec bins |
 |
 |
| Parameter | Plot |
|---|---|
| CZT HV Monitor | 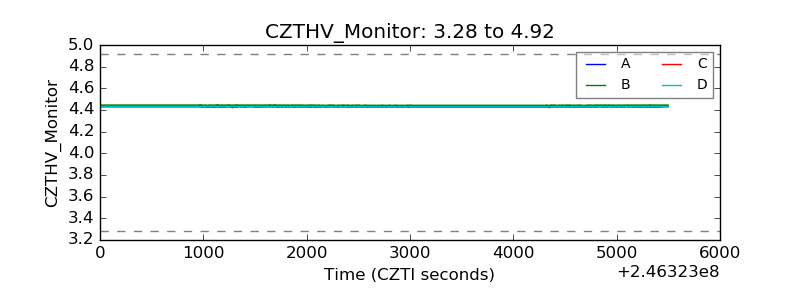 |
| D_VDD | 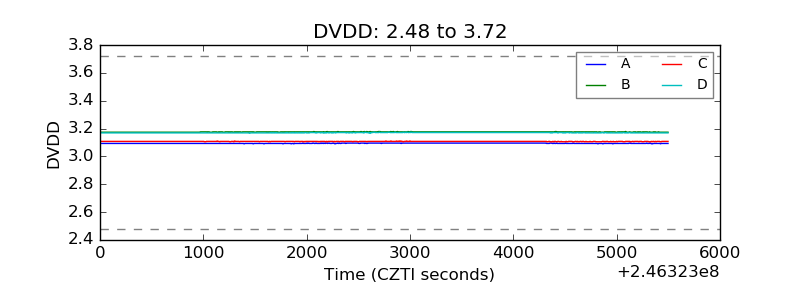 |
| Temperature 1 | 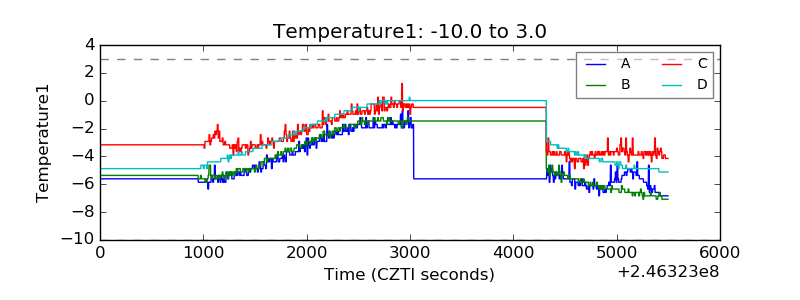 |
| Veto HV Monitor | 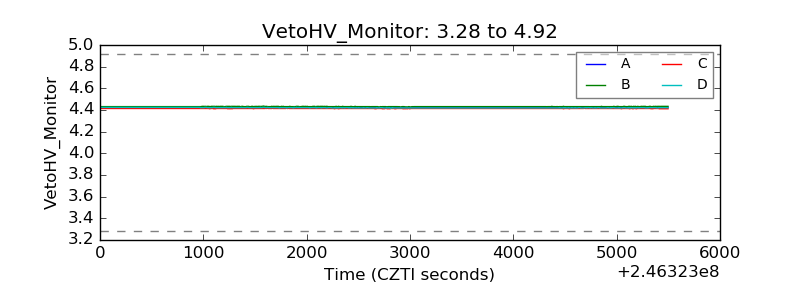 |
| Veto LLD |  |
| Alpha Counter | 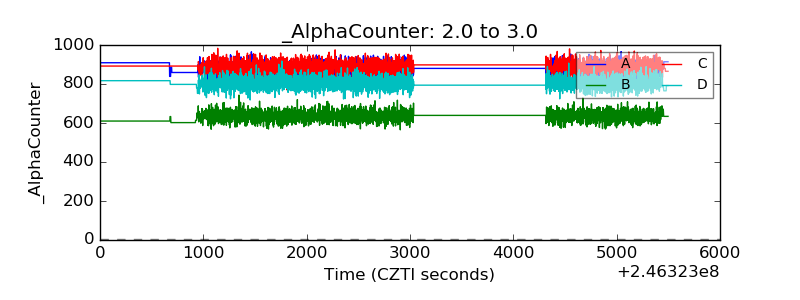 |
| _CPM_Rate | 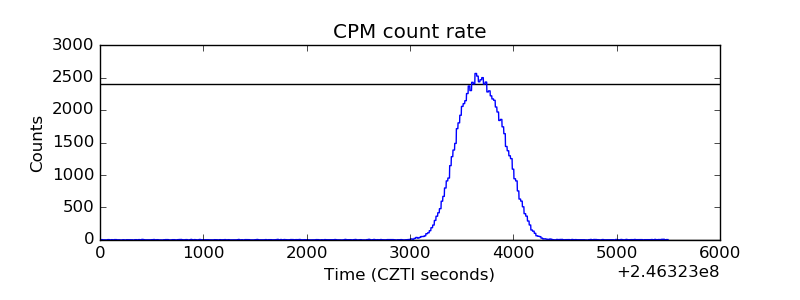 |
| CZT Counter | 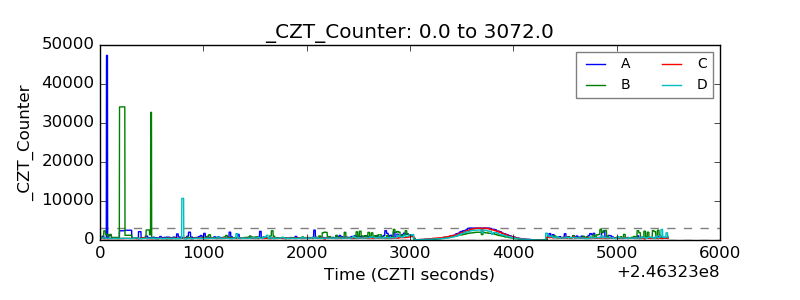 |
| +2.5 Volts monitor |  |
| +5 Volts monitor |  |
| _ROLL_ROT | 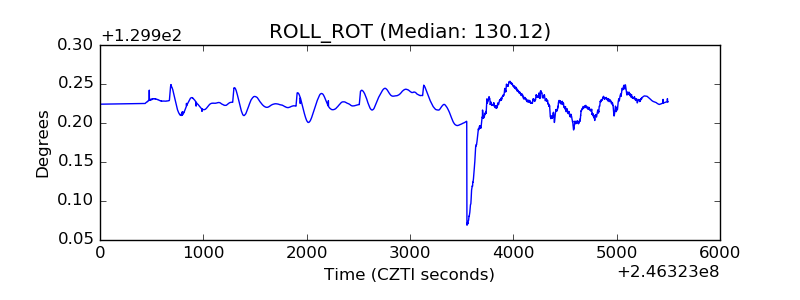 |
| _Roll_DEC | 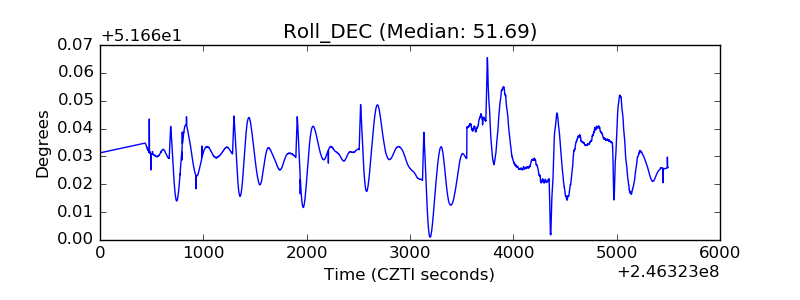 |
| _Roll_RA | 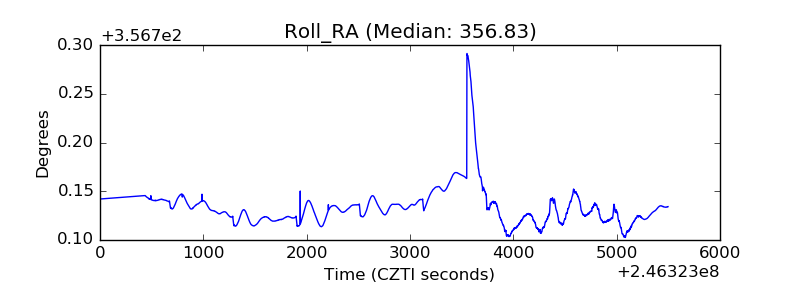 |
| Veto Counter | 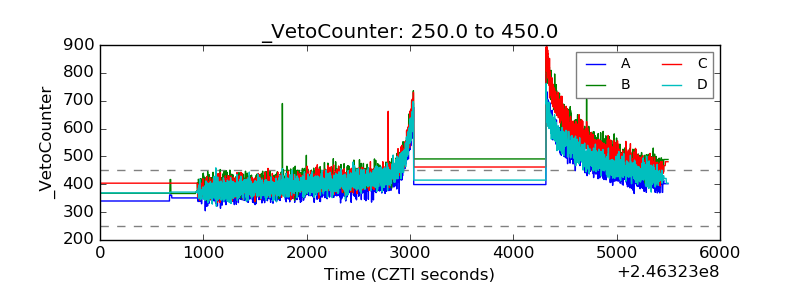 |