| Param | Original file | Final file |
|---|---|---|
| Filename | modeM0/AS1A04_049T01_9000001632_11174cztM0_level2.evt | modeM0/AS1A04_049T01_9000001632_11174cztM0_level2_quad_clean.evt |
| Size (bytes) | 252,092,160 | 45,544,320 |
| Size | 240.4 MB | 43.4 MB |
| Events in quadrant A | 1,973,158 | 296,008 |
| Events in quadrant B | 2,377,892 | 290,684 |
| Events in quadrant C | 1,326,547 | 310,100 |
| Events in quadrant D | 1,763,627 | 280,543 |
| Mode M9 | |||
|---|---|---|---|
| Quadrant | BADHDUFLAG | Total packets | Discarded packets |
| A | 0 | 4 | 0 |
| B | 0 | 4 | 0 |
| C | 0 | 4 | 0 |
| D | 0 | 6 | 1 |
| Mode SS | |||
|---|---|---|---|
| Quadrant | BADHDUFLAG | Total packets | Discarded packets |
| A | 0 | 89 | 35 |
| B | 0 | 87 | 27 |
| C | 0 | 87 | 33 |
| D | 0 | 87 | 33 |
| Mode M0 | |||
|---|---|---|---|
| Quadrant | BADHDUFLAG | Total packets | Discarded packets |
| A | 0 | 11661 | 3889 |
| B | 0 | 13930 | 4975 |
| C | 0 | 8988 | 3149 |
| D | 0 | 11337 | 4265 |
| Quadrant | Total seconds | Saturated seconds | Saturation percentage |
|---|---|---|---|
| A | 2830 | 48 | 1.696113% |
| B | 2787 | 279 | 10.010764% |
| C | 2864 | 3 | 0.104749% |
| D | 2812 | 64 | 2.275960% |
Noise dominated data is calculated using 1-second bins in cleaned event files. If a bin has >2000 counts, and if more than 50% of those come from <1% of pixels, then it is considered to be noise-dominated and hence unusable.
| Quadrant | # 1 sec bins | Bins with >0 counts | Bins with >2000 counts | High rate bins dominated by noise | Noise dominated (total time) | Noise dominated (detector-on time) | Marked lightcurve |
|---|---|---|---|---|---|---|---|
| A | 7563 | 2955 | 23 | 23 | 0.30% | 0.78% | 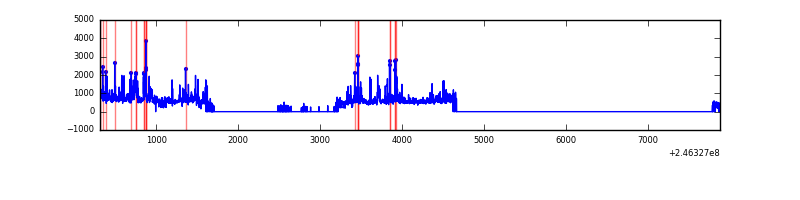 |
| B | 7564 | 2902 | 188 | 188 | 2.49% | 6.48% | 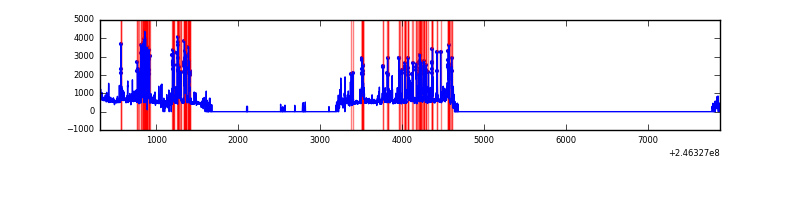 |
| C | 7563 | 3000 | 0 | 0 | 0.00% | 0.00% | 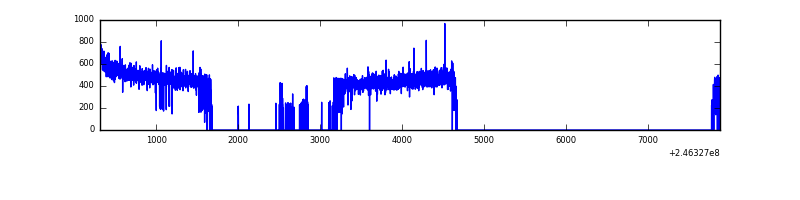 |
| D | 7563 | 2933 | 47 | 47 | 0.62% | 1.60% | 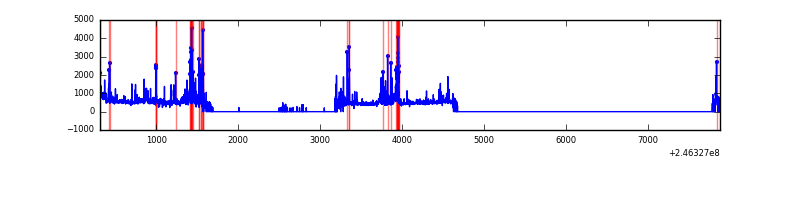 |
Top three noisy pixels from each quadrant. If the there are fewer than three noisy pixels in the level2.evt file, extra rows are filled as -1
| Pixel properties | Quadrant properties | ||||||
|---|---|---|---|---|---|---|---|
| Quadrant | DetID | PixID | Counts | Sigma | Mean | Median | Sigma |
| A | 8 | 5 | 371126 | 5265.46 | 339 | 332 | 70.4 |
| A | 8 | 15 | 259225 | 3676.41 | 339 | 332 | 70.4 |
| A | 14 | 238 | 33321 | 468.46 | 339 | 332 | 70.4 |
| B | 4 | 239 | 621726 | 9926.77 | 329 | 322 | 62.6 |
| B | 10 | 16 | 233557 | 3725.87 | 329 | 322 | 62.6 |
| B | 11 | 51 | 67292 | 1069.83 | 329 | 322 | 62.6 |
| C | 13 | 61 | 2335 | 25.28 | 339 | 342 | 78.8 |
| C | 14 | 234 | 1953 | 20.44 | 339 | 342 | 78.8 |
| C | 14 | 67 | 1217 | 11.1 | 339 | 342 | 78.8 |
| D | 9 | 202 | 150808 | 1921.11 | 323 | 315 | 78.3 |
| D | 10 | 253 | 96150 | 1223.37 | 323 | 315 | 78.3 |
| D | 13 | 152 | 74617 | 948.5 | 323 | 315 | 78.3 |
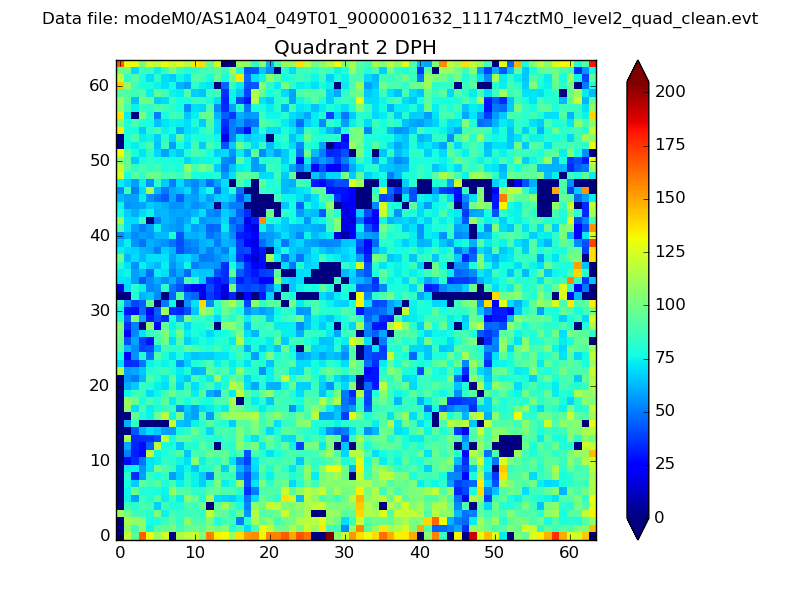
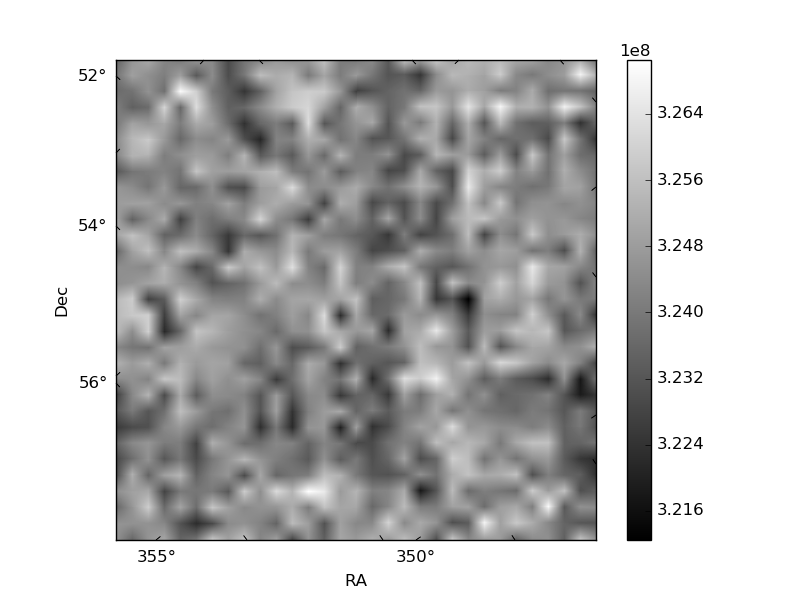
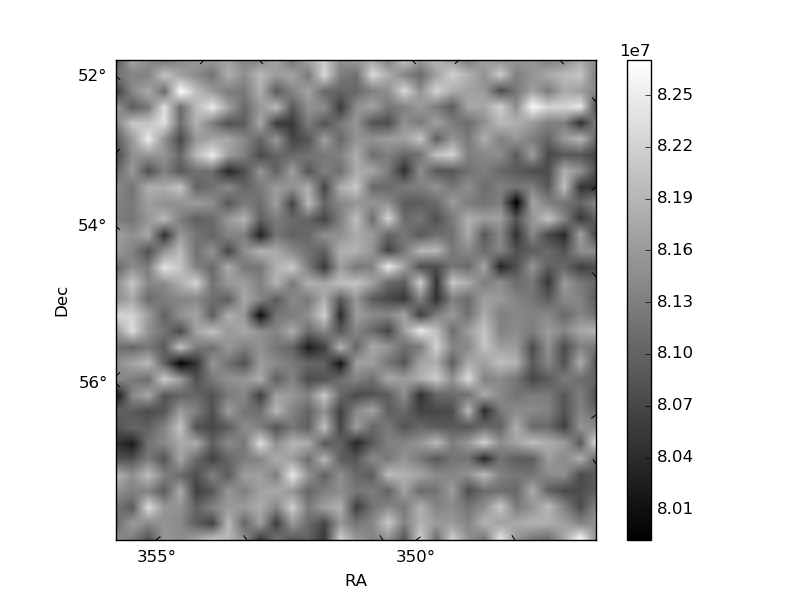
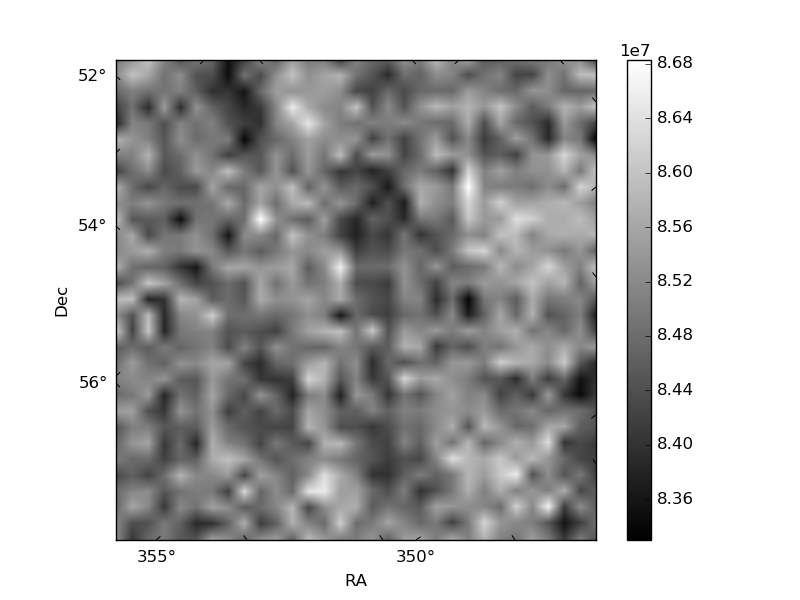
Histogram calculated using DETX and DETY for each event in the final _common_clean file
| Quadrant A | 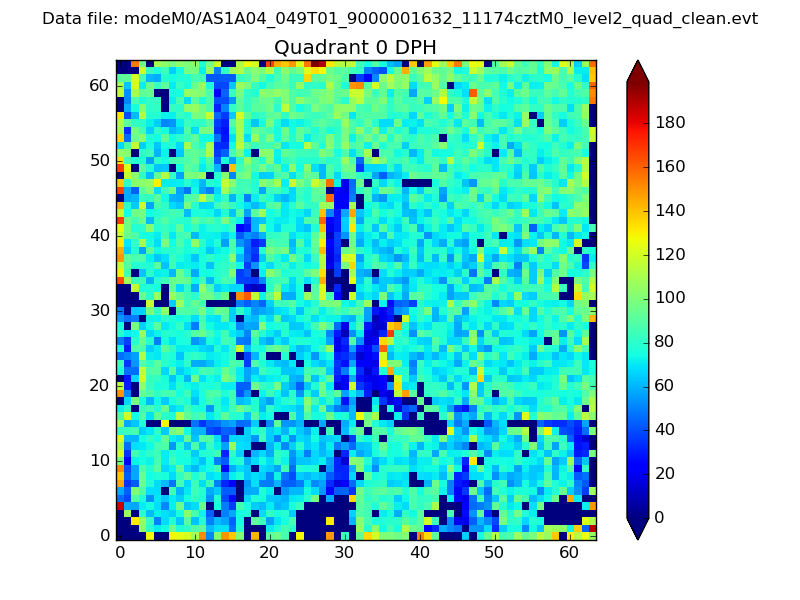 |
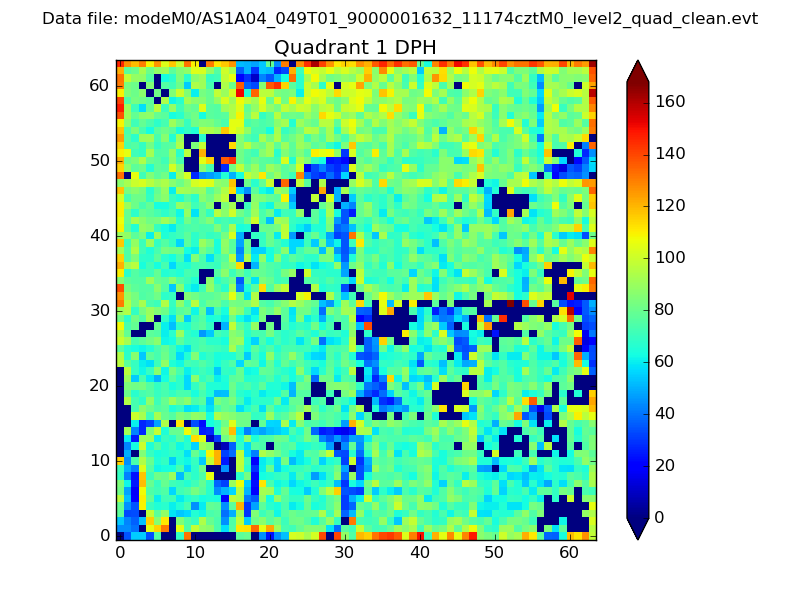 |
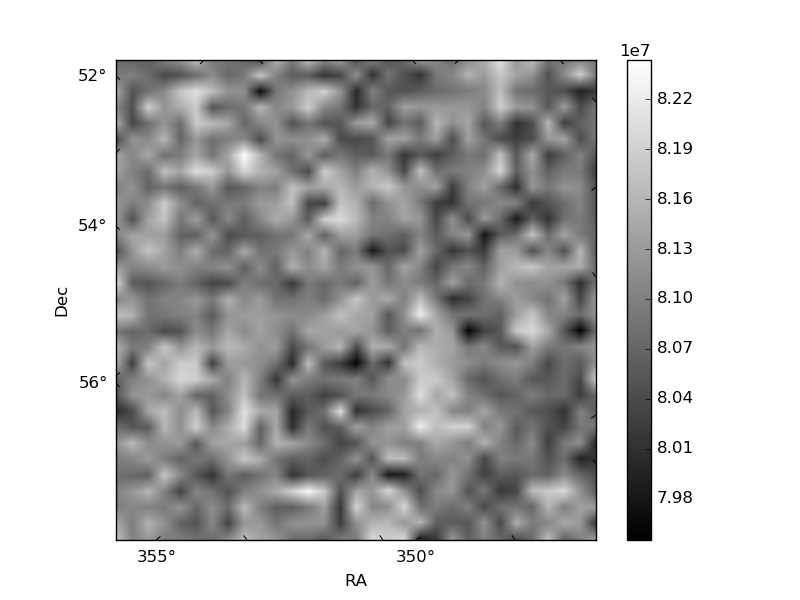
Quadrant B |
|---|---|---|---|
| Quadrant D | 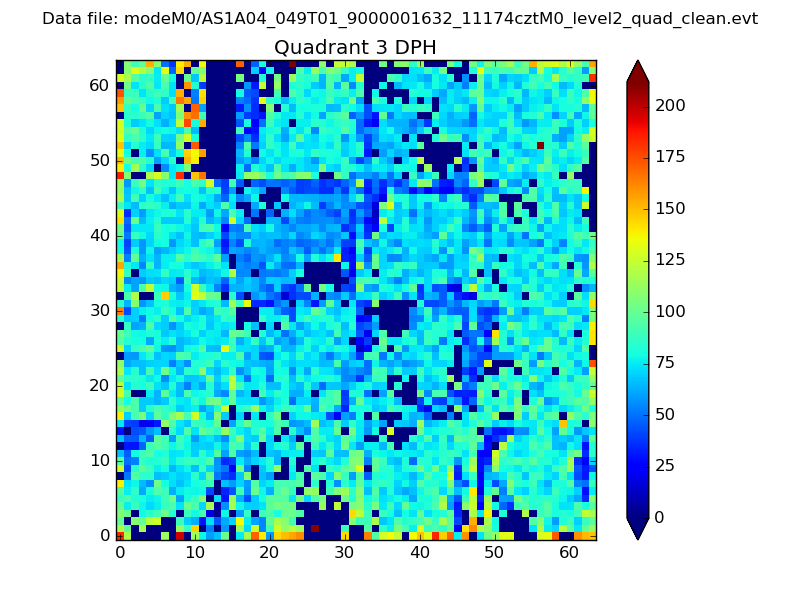 |
 |
Quadrant C |
| Plot type | Count rate plots | Images |
|---|---|---|
| Comparison with Poisson distribution Blue bars denote a histogram of data divided into 1 sec bins. Red curve is a Poisson curve with rate = median count rate of data. |
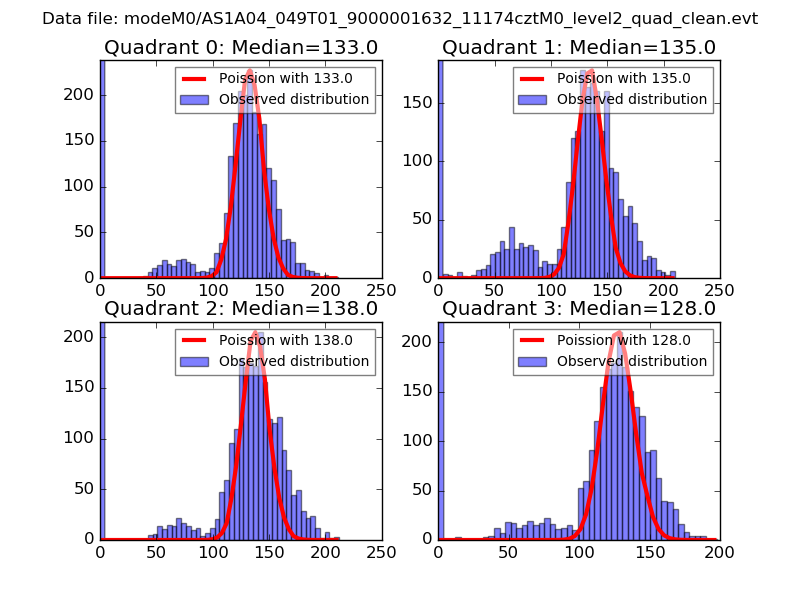 |
 |
| Quadrant-wise count rates Data is divided into 100 sec bins |
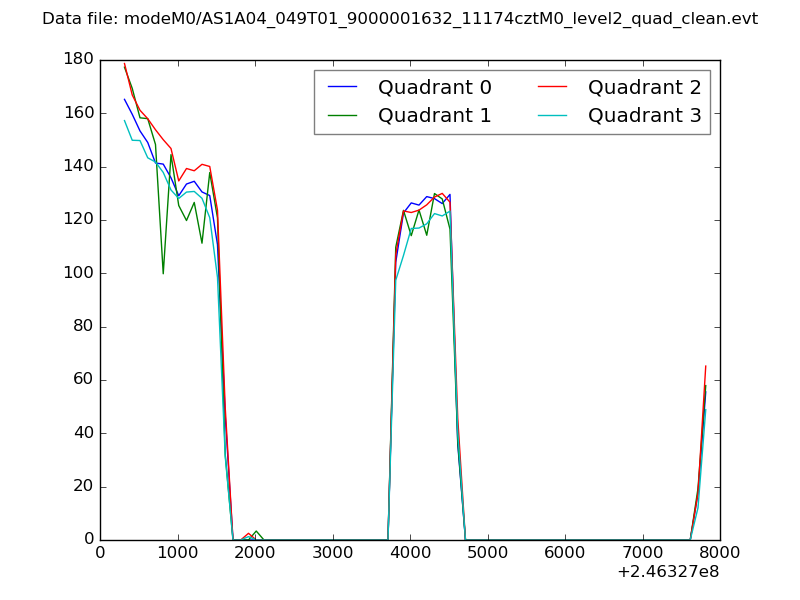 |
|
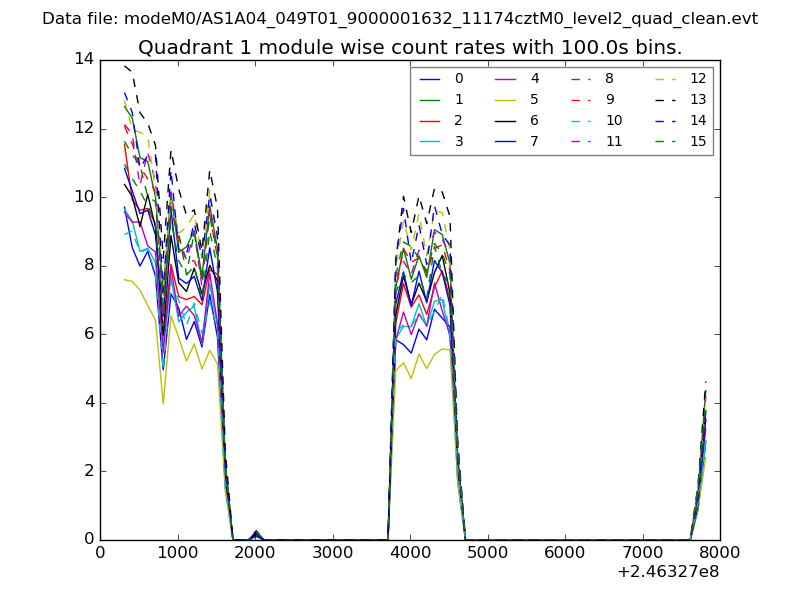
| Module-wise count rates for Quadrant A Data is divided into 100 sec bins |
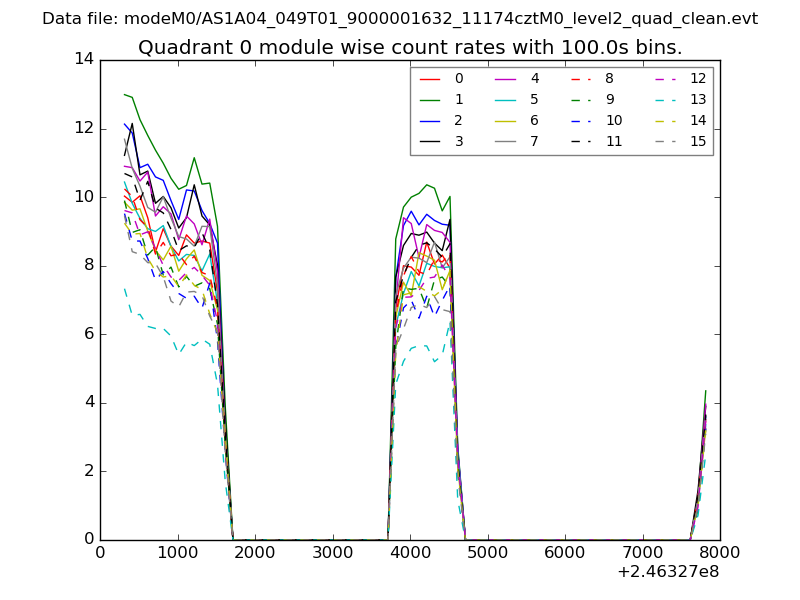 |
 |
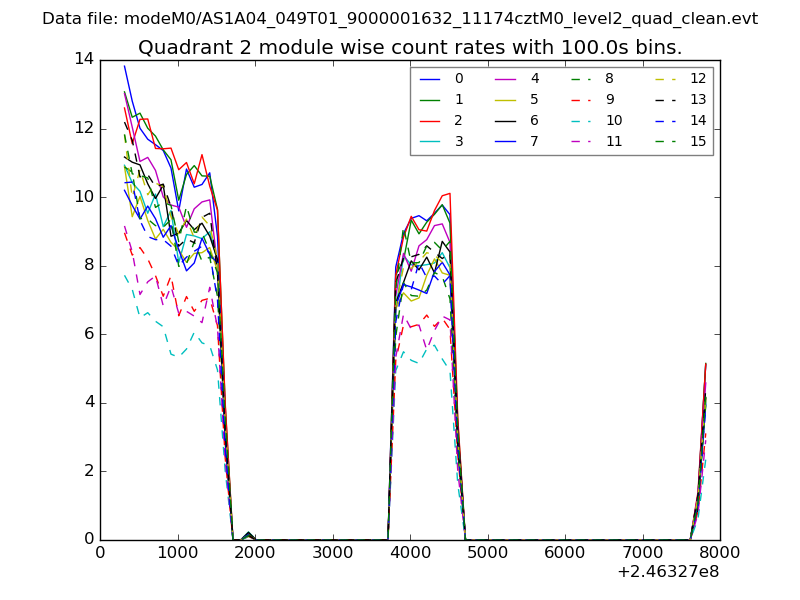
| Module-wise count rates for Quadrant B Data is divided into 100 sec bins |
 |
 |
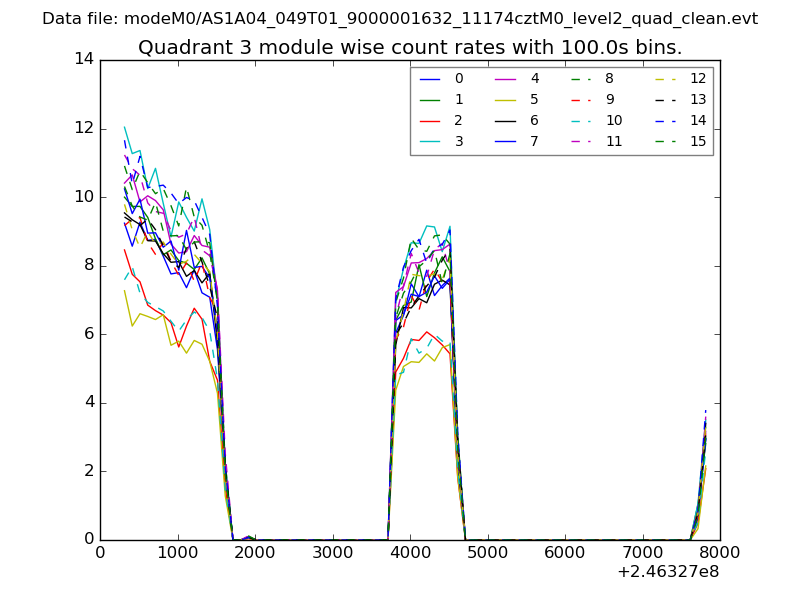
| Module-wise count rates for Quadrant C Data is divided into 100 sec bins |
 |
 |
| Module-wise count rates for Quadrant D Data is divided into 100 sec bins |
 |
 |
| Parameter | Plot |
|---|---|
| CZT HV Monitor | 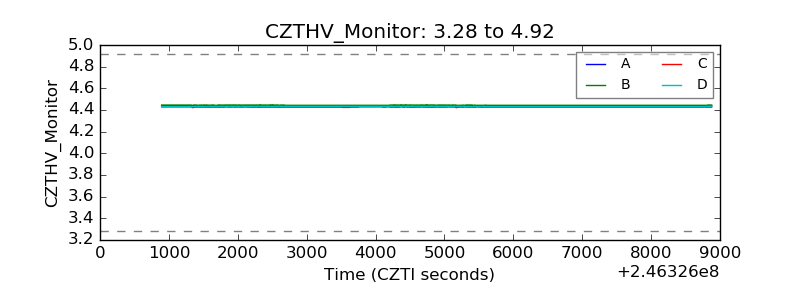 |
| D_VDD | 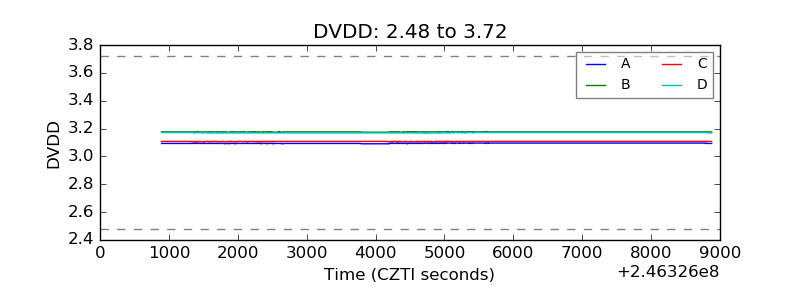 |
| Temperature 1 | 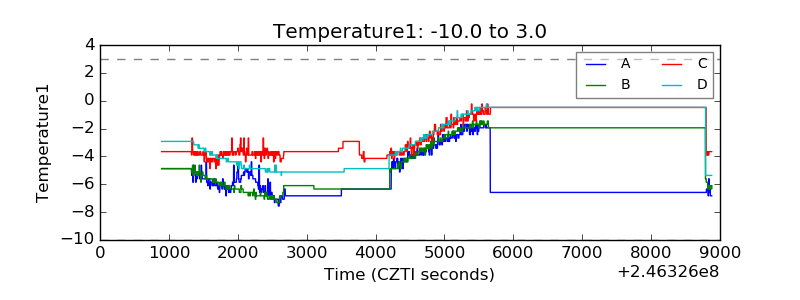 |
| Veto HV Monitor | 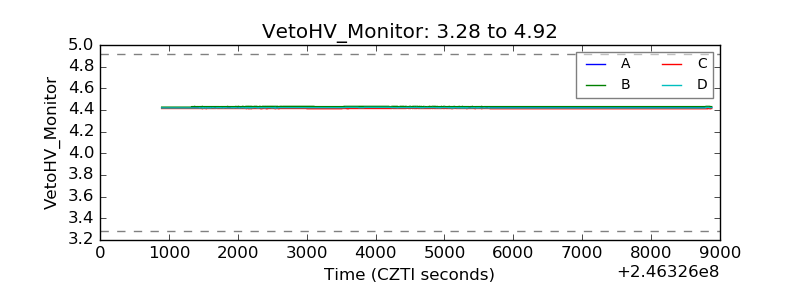 |
| Veto LLD |  |
| Alpha Counter | 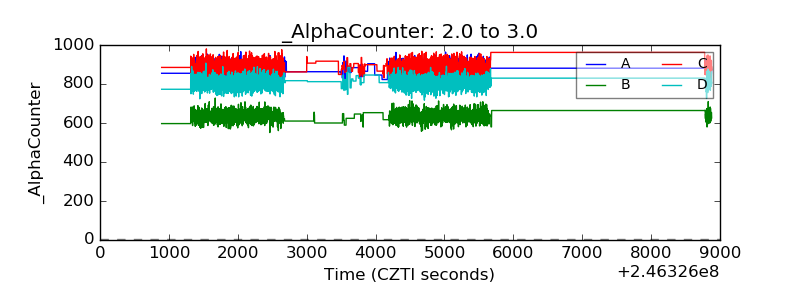 |
| _CPM_Rate | 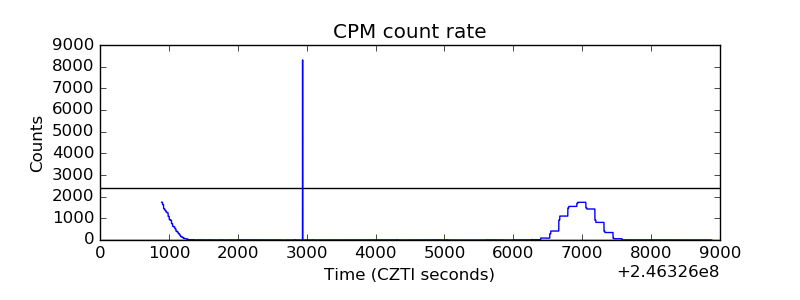 |
| CZT Counter | 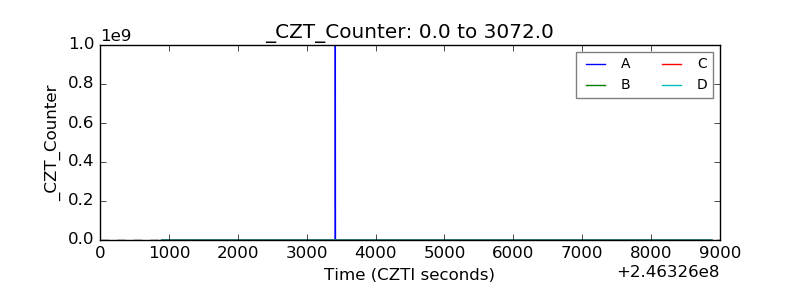 |
| +2.5 Volts monitor |  |
| +5 Volts monitor |  |
| _ROLL_ROT | 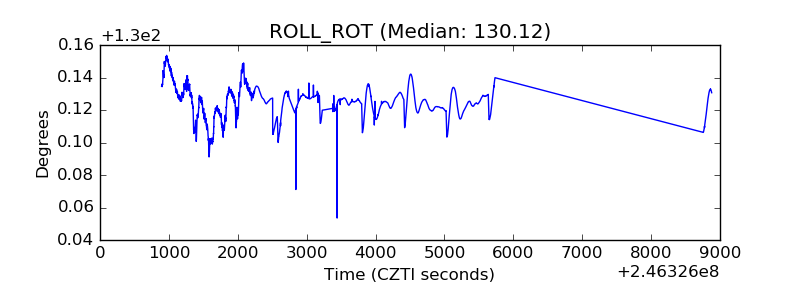 |
| _Roll_DEC | 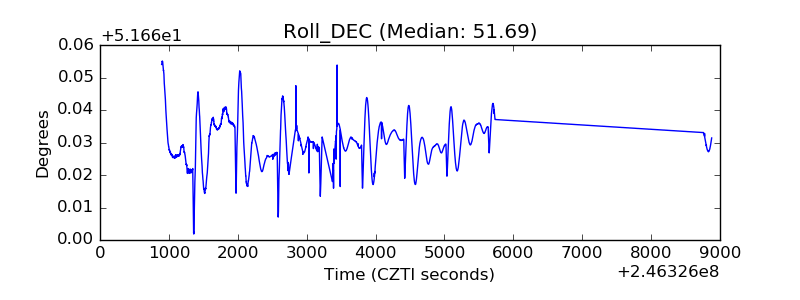 |
| _Roll_RA | 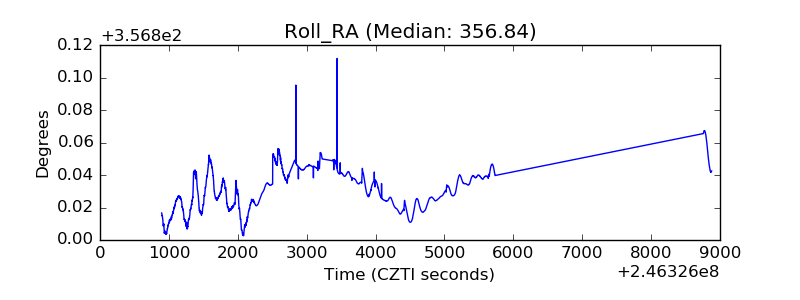 |
| Veto Counter | 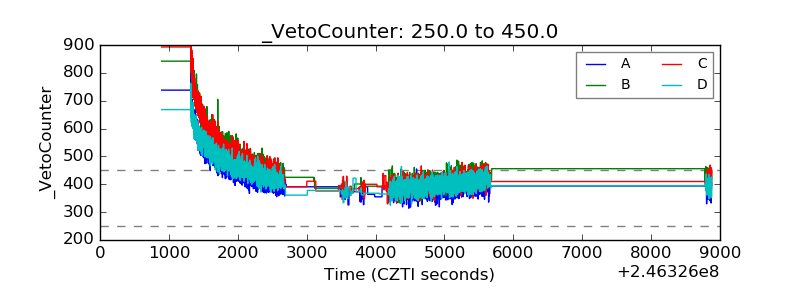 |