| Param | Original file | Final file |
|---|---|---|
| Filename | modeM0/AS1A04_049T01_9000001632_11175cztM0_level2.evt | modeM0/AS1A04_049T01_9000001632_11175cztM0_level2_quad_clean.evt |
| Size (bytes) | 593,902,080 | 87,825,600 |
| Size | 566.4 MB | 83.8 MB |
| Events in quadrant A | 5,304,379 | 534,870 |
| Events in quadrant B | 5,153,342 | 555,972 |
| Events in quadrant C | 2,894,043 | 588,093 |
| Events in quadrant D | 4,203,933 | 536,318 |
| Mode M9 | |||
|---|---|---|---|
| Quadrant | BADHDUFLAG | Total packets | Discarded packets |
| A | 0 | 16 | 0 |
| B | 0 | 16 | 0 |
| C | 0 | 16 | 0 |
| D | 0 | 17 | 0 |
| Mode SS | |||
|---|---|---|---|
| Quadrant | BADHDUFLAG | Total packets | Discarded packets |
| A | 0 | 130 | 0 |
| B | 0 | 130 | 0 |
| C | 0 | 130 | 0 |
| D | 0 | 130 | 0 |
| Mode M0 | |||
|---|---|---|---|
| Quadrant | BADHDUFLAG | Total packets | Discarded packets |
| A | 0 | 20050 | 3 |
| B | 0 | 19593 | 2 |
| C | 0 | 13029 | 4 |
| D | 0 | 17028 | 2 |
| Quadrant | Total seconds | Saturated seconds | Saturation percentage |
|---|---|---|---|
| A | 6359 | 634 | 9.970121% |
| B | 6359 | 649 | 10.206007% |
| C | 6358 | 36 | 0.566216% |
| D | 6359 | 198 | 3.113697% |
Noise dominated data is calculated using 1-second bins in cleaned event files. If a bin has >2000 counts, and if more than 50% of those come from <1% of pixels, then it is considered to be noise-dominated and hence unusable.
| Quadrant | # 1 sec bins | Bins with >0 counts | Bins with >2000 counts | High rate bins dominated by noise | Noise dominated (total time) | Noise dominated (detector-on time) | Marked lightcurve |
|---|---|---|---|---|---|---|---|
| A | 7569 | 6359 | 427 | 427 | 5.64% | 6.71% | 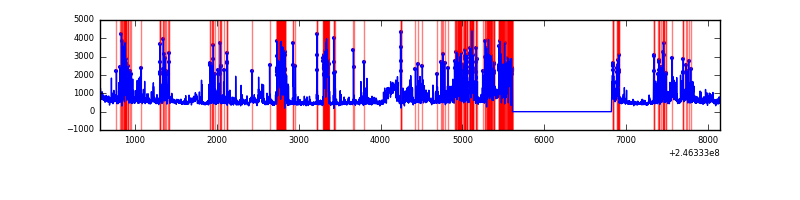 |
| B | 7569 | 6360 | 329 | 329 | 4.35% | 5.17% | 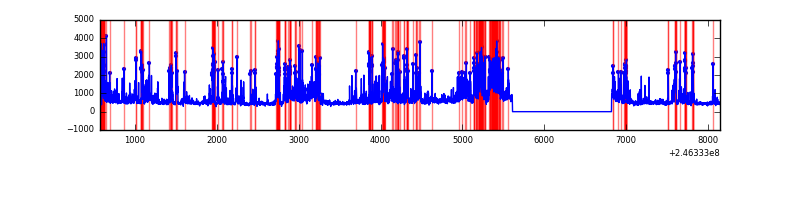 |
| C | 7569 | 6360 | 0 | 0 | 0.00% | 0.00% | 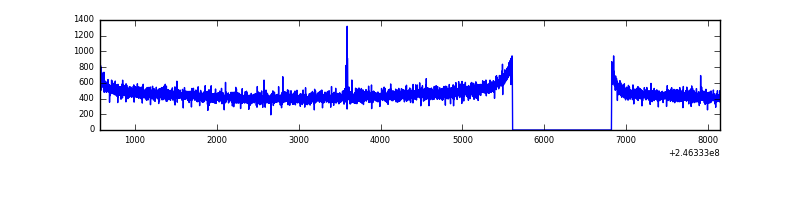 |
| D | 7569 | 6360 | 105 | 105 | 1.39% | 1.65% | 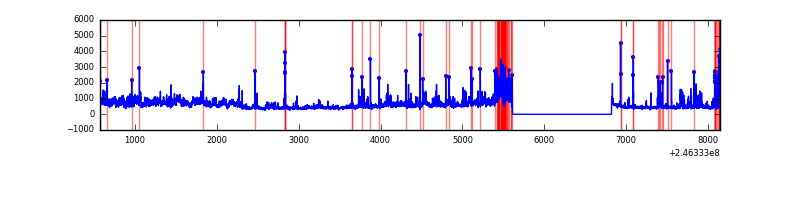 |
Top three noisy pixels from each quadrant. If the there are fewer than three noisy pixels in the level2.evt file, extra rows are filled as -1
| Pixel properties | Quadrant properties | ||||||
|---|---|---|---|---|---|---|---|
| Quadrant | DetID | PixID | Counts | Sigma | Mean | Median | Sigma |
| A | 8 | 5 | 1359140 | 9509.21 | 709 | 694 | 142.9 |
| A | 14 | 238 | 741618 | 5186.52 | 709 | 694 | 142.9 |
| A | 8 | 15 | 312458 | 2182.37 | 709 | 694 | 142.9 |
| B | 4 | 239 | 1829731 | 13340.2 | 732 | 714 | 137.1 |
| B | 4 | 80 | 99484 | 720.39 | 732 | 714 | 137.1 |
| B | 11 | 51 | 98687 | 714.58 | 732 | 714 | 137.1 |
| C | 14 | 234 | 6582 | 34.25 | 738 | 742 | 170.5 |
| C | 5 | 37 | 5757 | 29.41 | 738 | 742 | 170.5 |
| C | 13 | 61 | 5448 | 27.6 | 738 | 742 | 170.5 |
| D | 10 | 157 | 613380 | 3397.12 | 707 | 689 | 180.4 |
| D | 13 | 152 | 307294 | 1700.0 | 707 | 689 | 180.4 |
| D | 10 | 253 | 125790 | 693.63 | 707 | 689 | 180.4 |
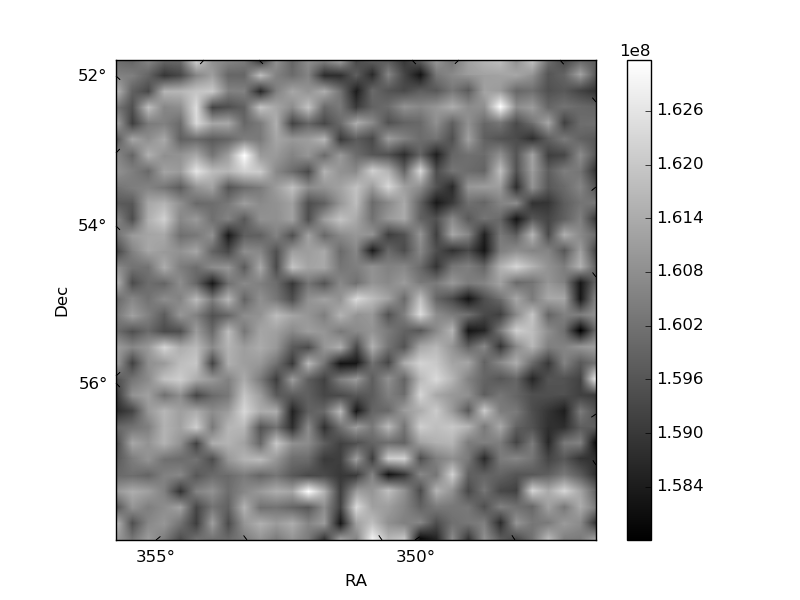
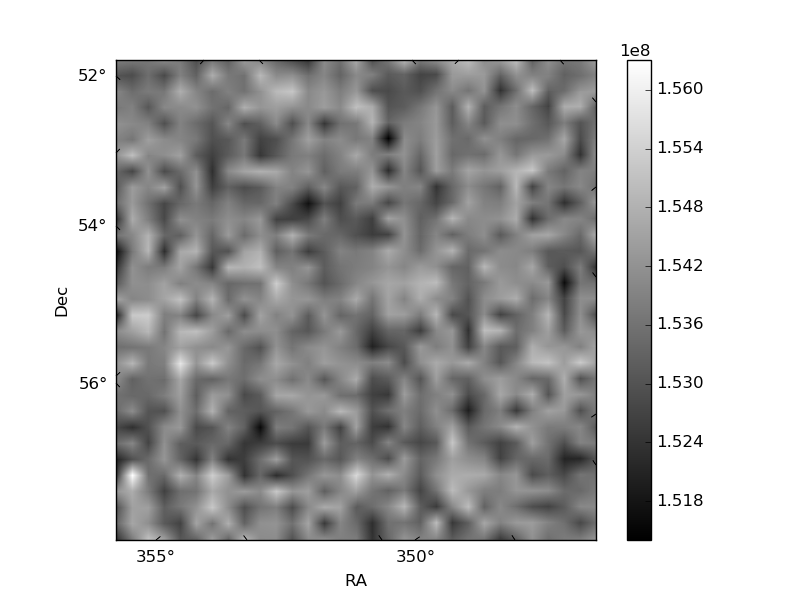
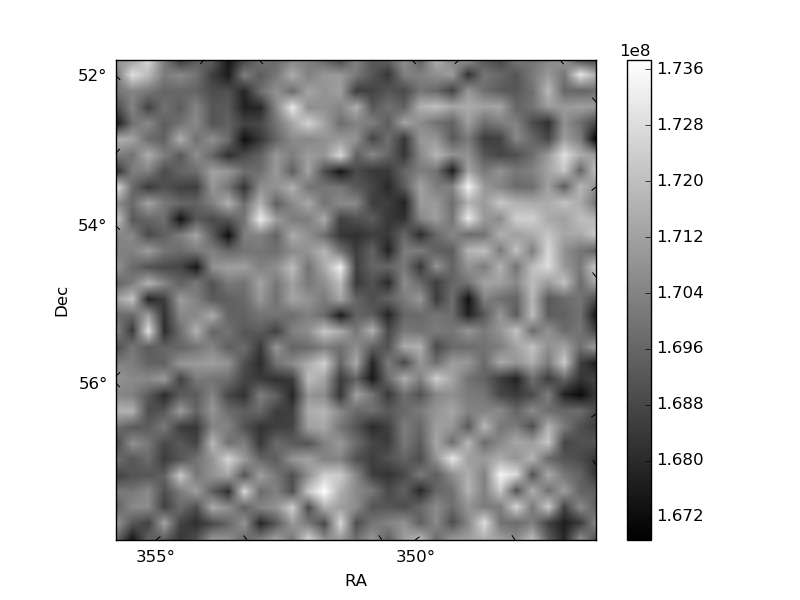
Histogram calculated using DETX and DETY for each event in the final _common_clean file
| Quadrant A | 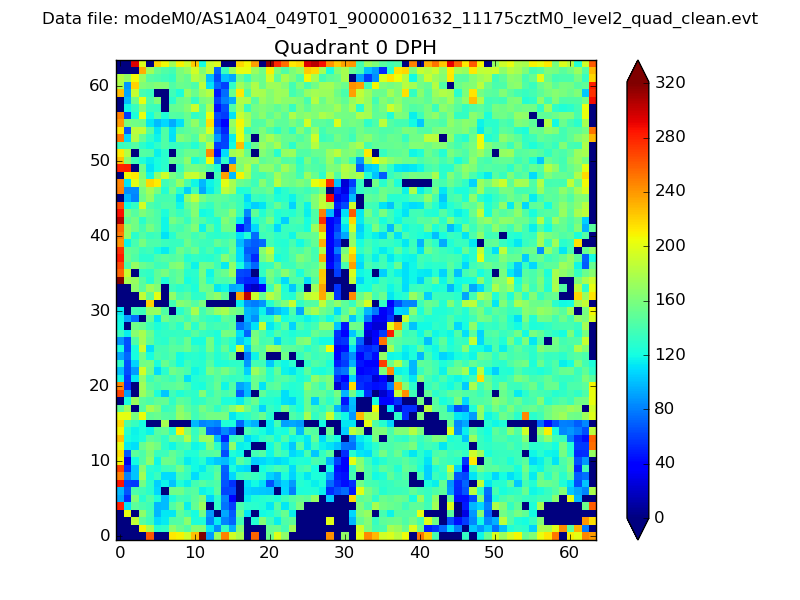 |
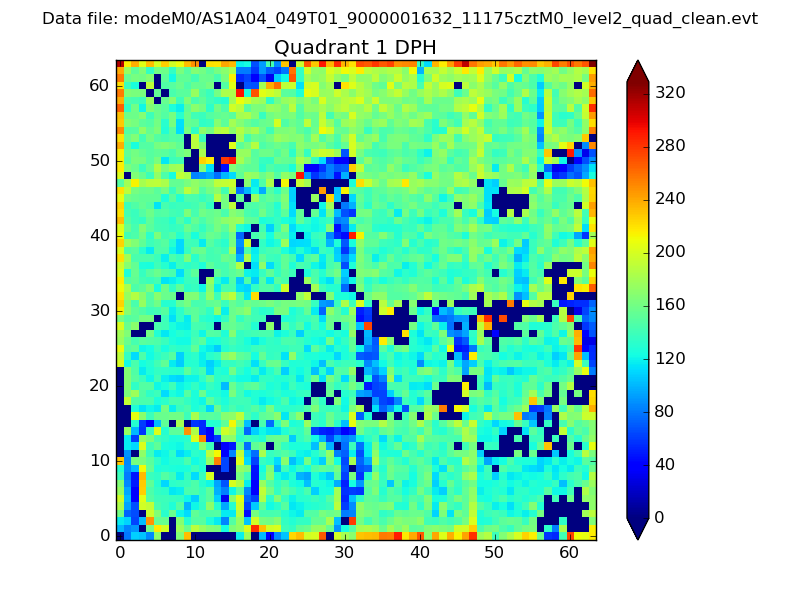 |
Quadrant B |
|---|---|---|---|
| Quadrant D | 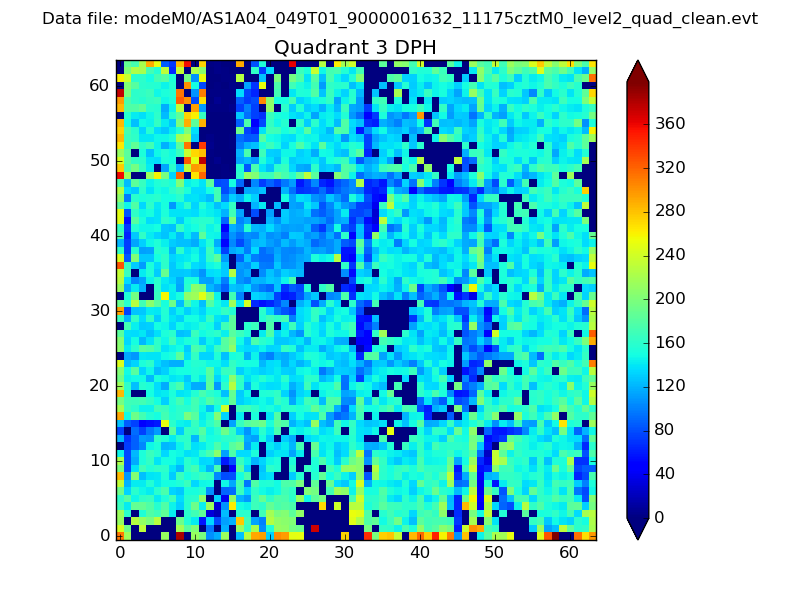 |
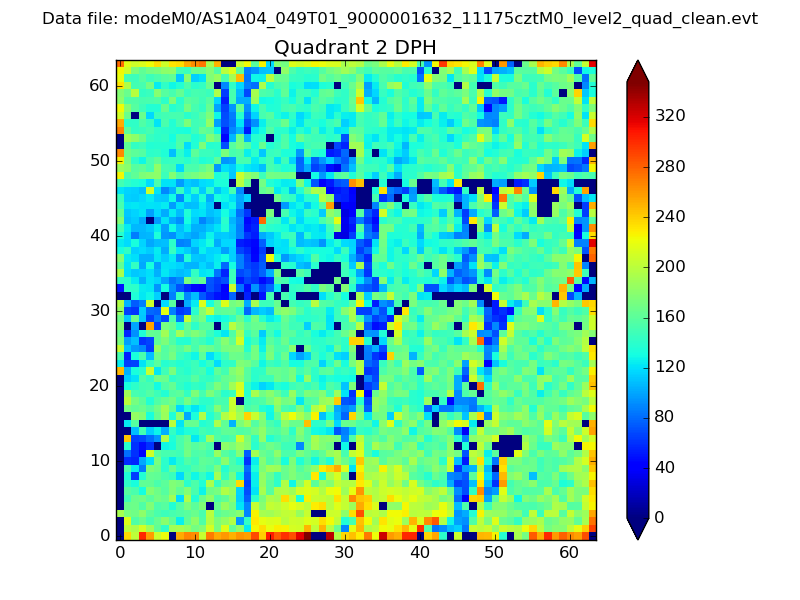 |
Quadrant C |
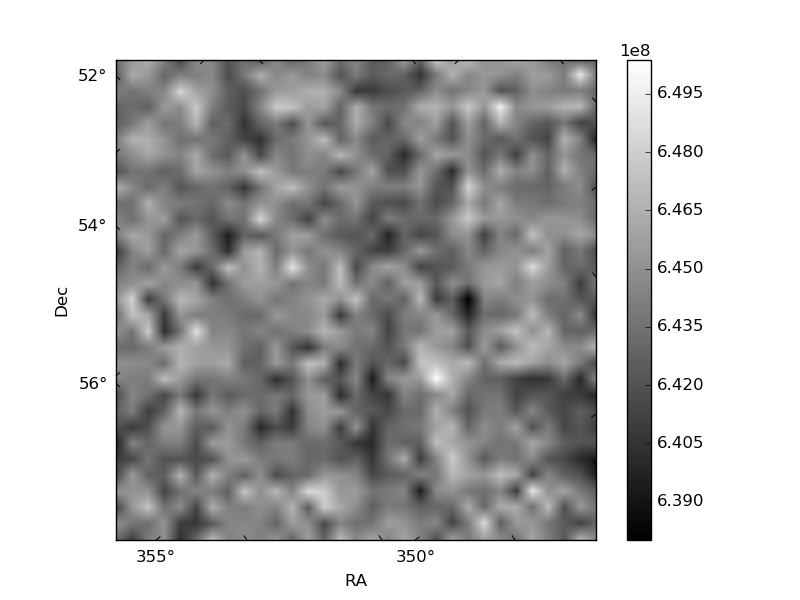
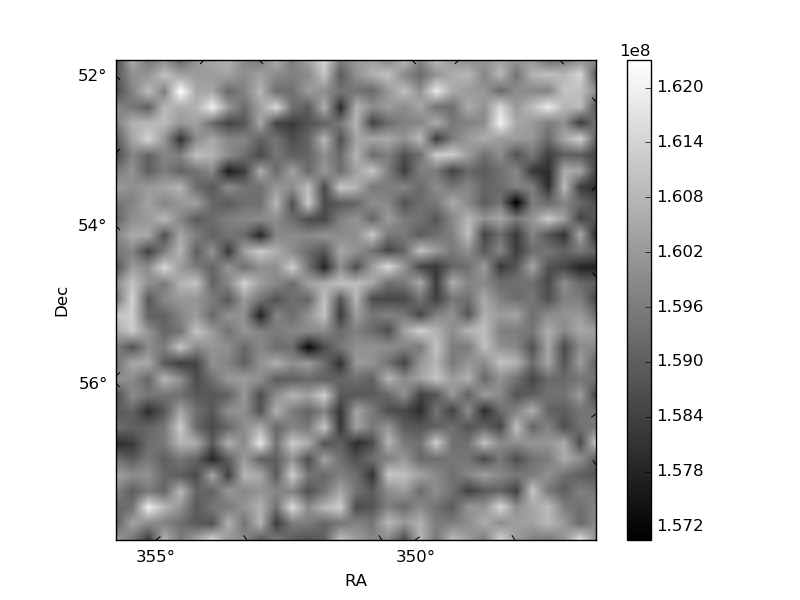
| Plot type | Count rate plots | Images |
|---|---|---|
| Comparison with Poisson distribution Blue bars denote a histogram of data divided into 1 sec bins. Red curve is a Poisson curve with rate = median count rate of data. |
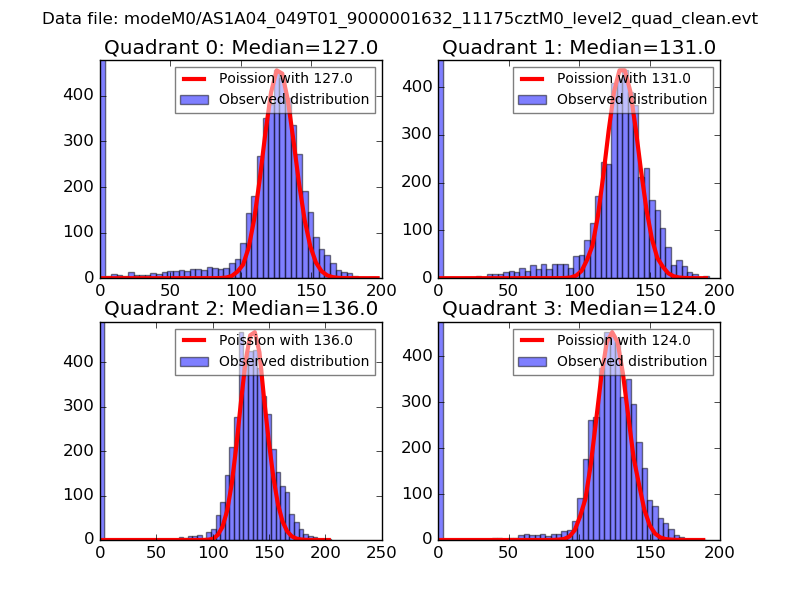 |
 |
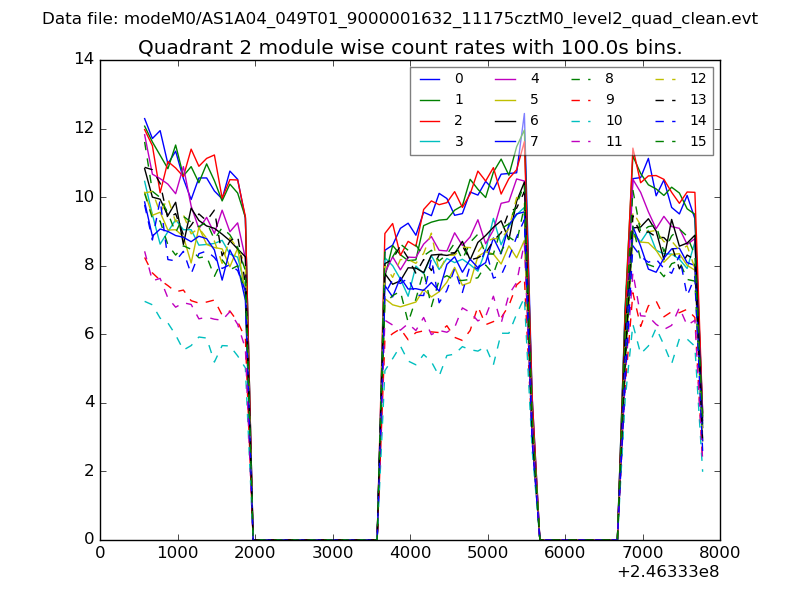
| Quadrant-wise count rates Data is divided into 100 sec bins |
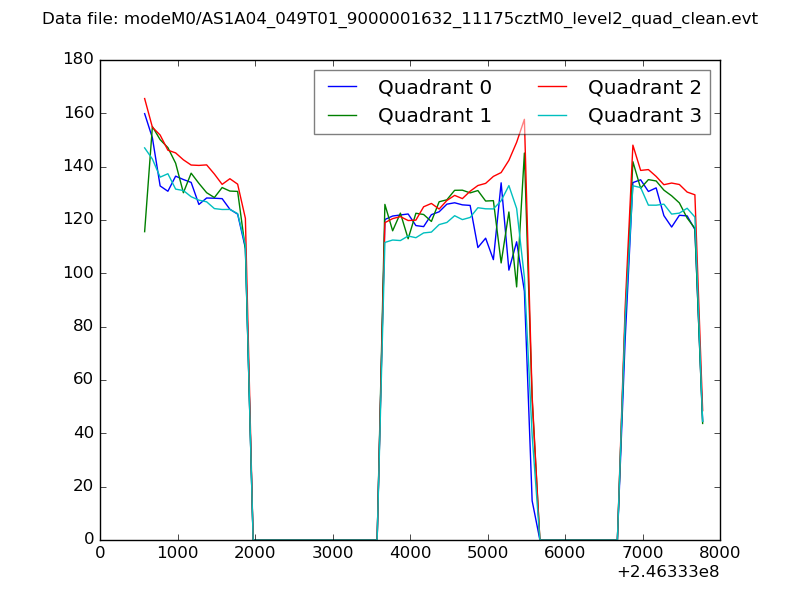 |
|
| Module-wise count rates for Quadrant A Data is divided into 100 sec bins |
 |
 |
| Module-wise count rates for Quadrant B Data is divided into 100 sec bins |
 |
 |
| Module-wise count rates for Quadrant C Data is divided into 100 sec bins |
 |
 |
| Module-wise count rates for Quadrant D Data is divided into 100 sec bins |
 |
 |
| Parameter | Plot |
|---|---|
| CZT HV Monitor | 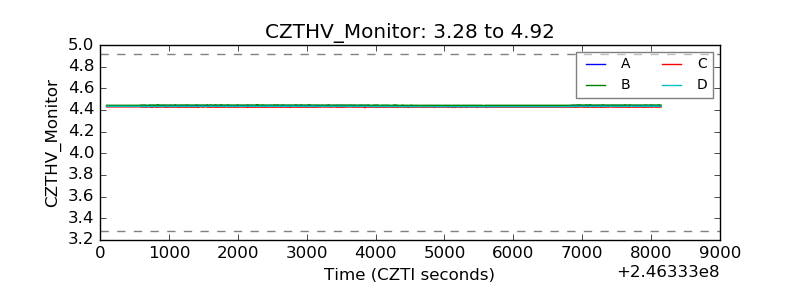 |
| D_VDD | 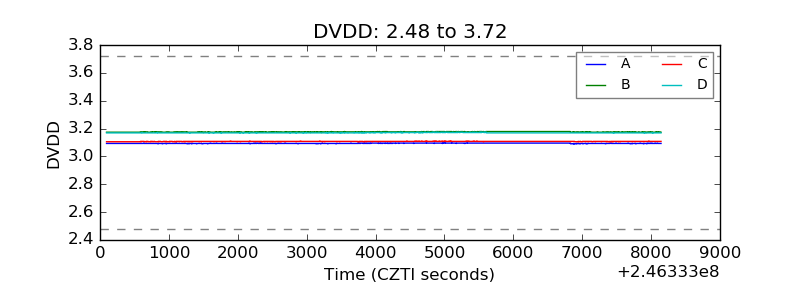 |
| Temperature 1 | 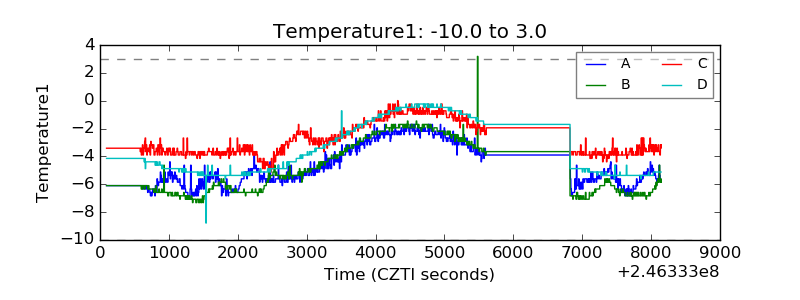 |
| Veto HV Monitor | 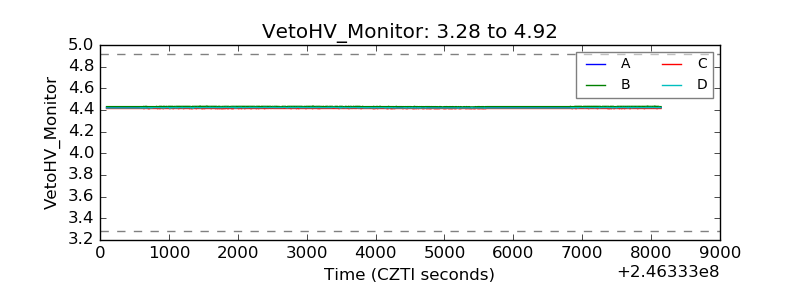 |
| Veto LLD |  |
| Alpha Counter | 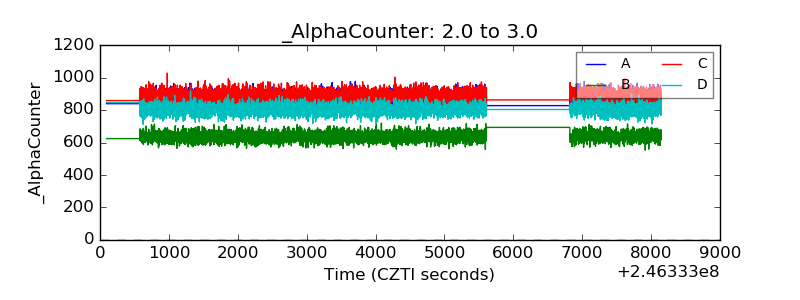 |
| _CPM_Rate | 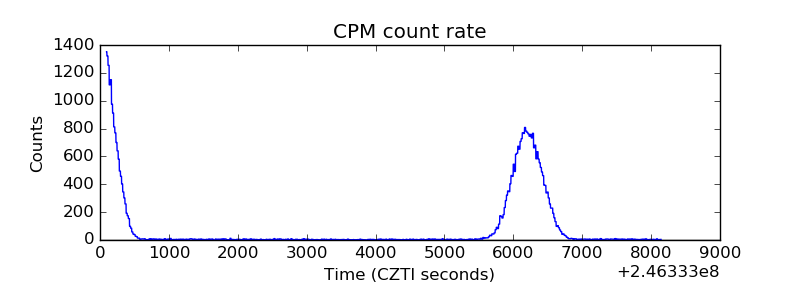 |
| CZT Counter | 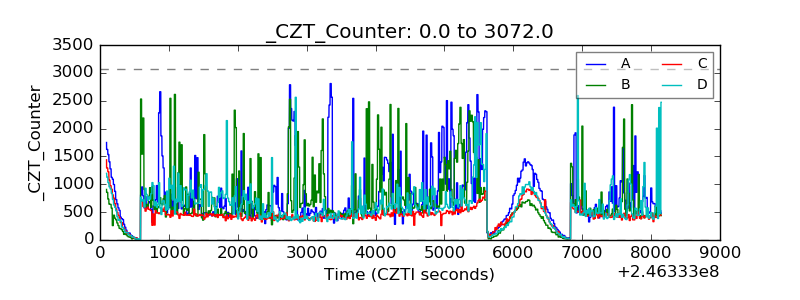 |
| +2.5 Volts monitor |  |
| +5 Volts monitor |  |
| _ROLL_ROT | 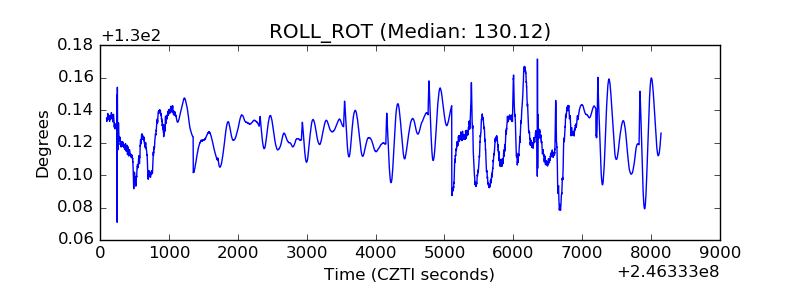 |
| _Roll_DEC | 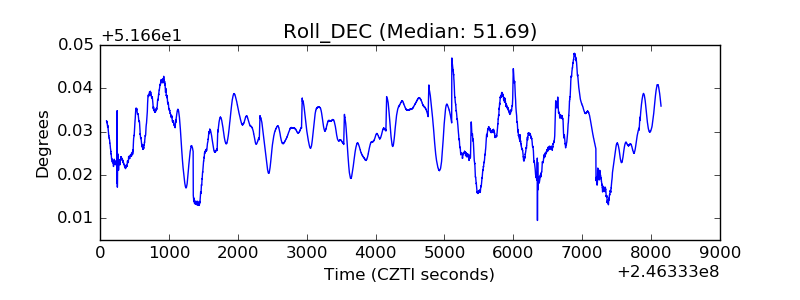 |
| _Roll_RA | 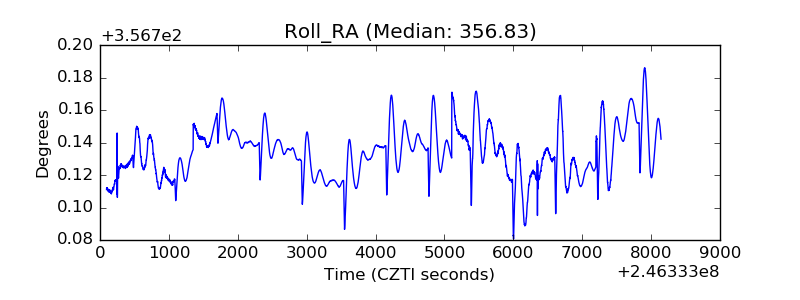 |
| Veto Counter | 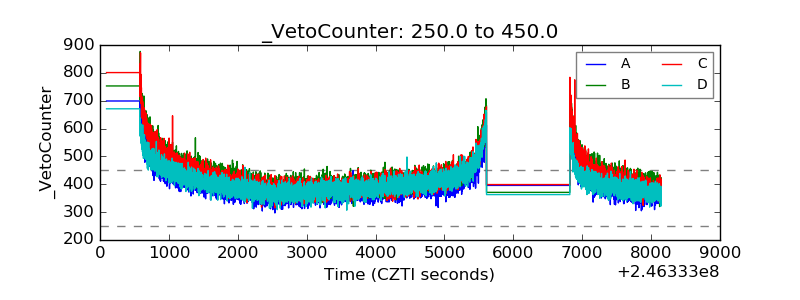 |