| Param | Original file | Final file |
|---|---|---|
| Filename | modeM0/AS1A04_049T01_9000001632_11176cztM0_level2.evt | modeM0/AS1A04_049T01_9000001632_11176cztM0_level2_quad_clean.evt |
| Size (bytes) | 1,957,317,120 | 282,107,520 |
| Size | 1.8 GB | 269.0 MB |
| Events in quadrant A | 16,753,505 | 1,715,855 |
| Events in quadrant B | 17,354,824 | 1,758,358 |
| Events in quadrant C | 9,739,172 | 1,866,854 |
| Events in quadrant D | 13,981,215 | 1,721,318 |
| Mode M9 | |||
|---|---|---|---|
| Quadrant | BADHDUFLAG | Total packets | Discarded packets |
| A | 0 | 61 | 7 |
| B | 0 | 60 | 6 |
| C | 0 | 60 | 5 |
| D | 0 | 58 | 4 |
| Mode SS | |||
|---|---|---|---|
| Quadrant | BADHDUFLAG | Total packets | Discarded packets |
| A | 0 | 455 | 15 |
| B | 0 | 456 | 12 |
| C | 0 | 456 | 16 |
| D | 0 | 454 | 16 |
| Mode M0 | |||
|---|---|---|---|
| Quadrant | BADHDUFLAG | Total packets | Discarded packets |
| A | 0 | 67450 | 3307 |
| B | 0 | 68946 | 2882 |
| C | 0 | 45452 | 1366 |
| D | 0 | 58843 | 2352 |
| Quadrant | Total seconds | Saturated seconds | Saturation percentage |
|---|---|---|---|
| A | 21471 | 1508 | 7.023427% |
| B | 21470 | 2068 | 9.632045% |
| C | 21559 | 60 | 0.278306% |
| D | 21511 | 762 | 3.542374% |
Noise dominated data is calculated using 1-second bins in cleaned event files. If a bin has >2000 counts, and if more than 50% of those come from <1% of pixels, then it is considered to be noise-dominated and hence unusable.
| Quadrant | # 1 sec bins | Bins with >0 counts | Bins with >2000 counts | High rate bins dominated by noise | Noise dominated (total time) | Noise dominated (detector-on time) | Marked lightcurve |
|---|---|---|---|---|---|---|---|
| A | 28279 | 21587 | 897 | 897 | 3.17% | 4.16% | 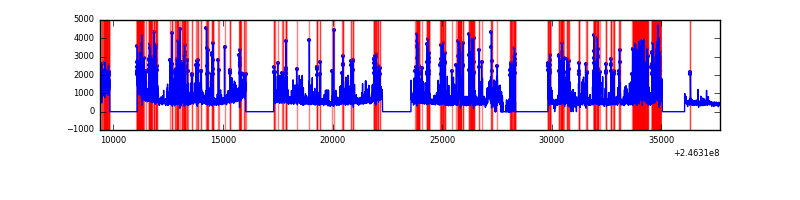 |
| B | 28279 | 21614 | 1207 | 1207 | 4.27% | 5.58% | 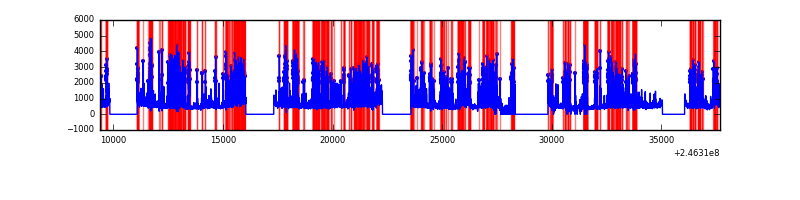 |
| C | 28279 | 21696 | 2 | 2 | 0.01% | 0.01% | 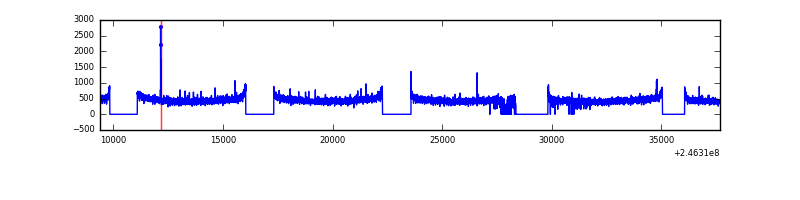 |
| D | 28278 | 21642 | 578 | 578 | 2.04% | 2.67% | 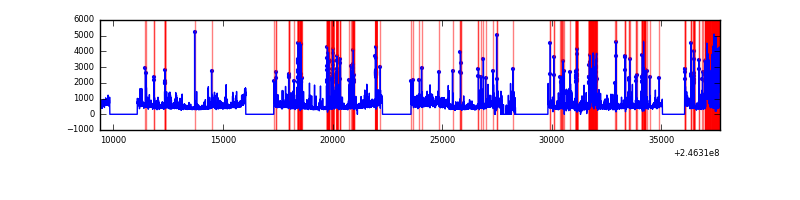 |
Top three noisy pixels from each quadrant. If the there are fewer than three noisy pixels in the level2.evt file, extra rows are filled as -1
| Pixel properties | Quadrant properties | ||||||
|---|---|---|---|---|---|---|---|
| Quadrant | DetID | PixID | Counts | Sigma | Mean | Median | Sigma |
| A | 8 | 5 | 3181455 | 6533.91 | 2442 | 2391 | 486.5 |
| A | 14 | 238 | 2084794 | 4279.95 | 2442 | 2391 | 486.5 |
| A | 8 | 15 | 1783364 | 3660.42 | 2442 | 2391 | 486.5 |
| B | 4 | 239 | 4774538 | 10554.1 | 2464 | 2408 | 452.2 |
| B | 10 | 16 | 1007367 | 2222.58 | 2464 | 2408 | 452.2 |
| B | 10 | 245 | 578416 | 1273.91 | 2464 | 2408 | 452.2 |
| C | 14 | 234 | 28607 | 45.87 | 2488 | 2504 | 569.1 |
| C | 13 | 61 | 18493 | 28.1 | 2488 | 2504 | 569.1 |
| C | 1 | 3 | 6300 | 6.67 | 2488 | 2504 | 569.1 |
| D | 10 | 157 | 800033 | 1352.7 | 2395 | 2339 | 589.7 |
| D | 10 | 253 | 796147 | 1346.12 | 2395 | 2339 | 589.7 |
| D | 13 | 152 | 610009 | 1030.47 | 2395 | 2339 | 589.7 |
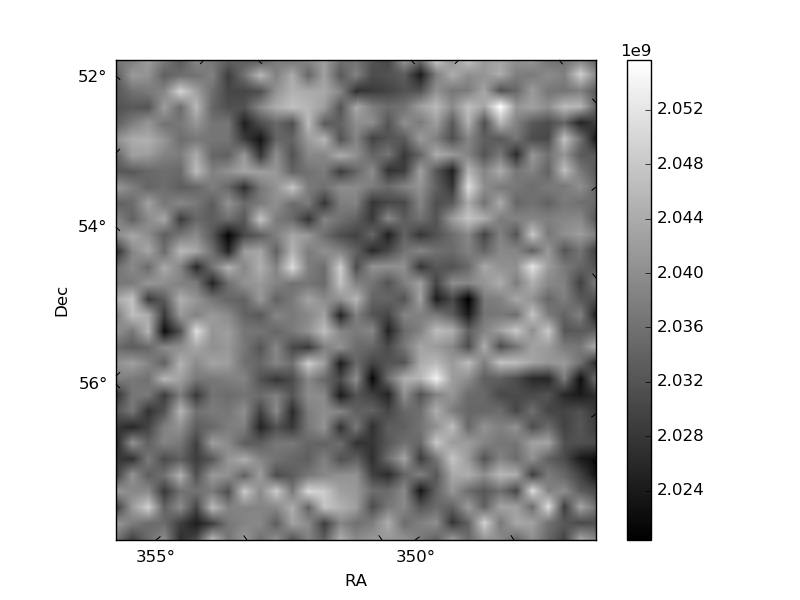
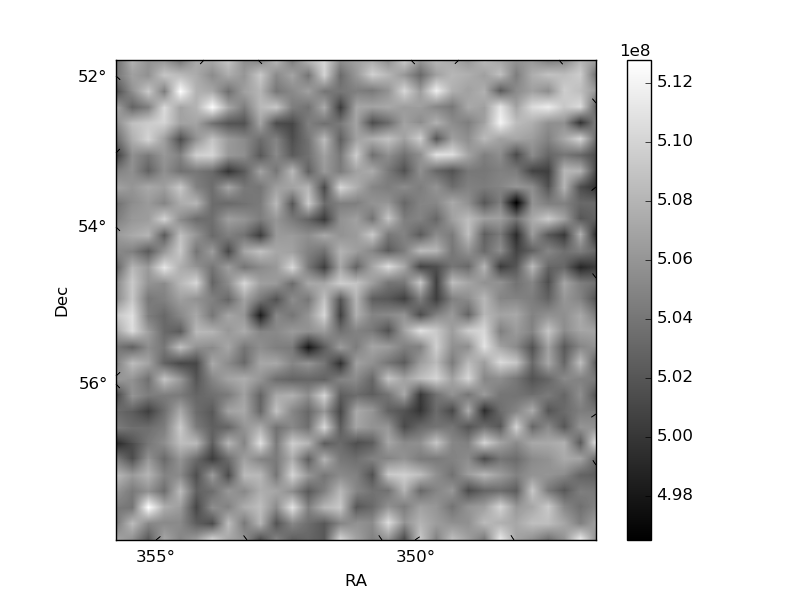
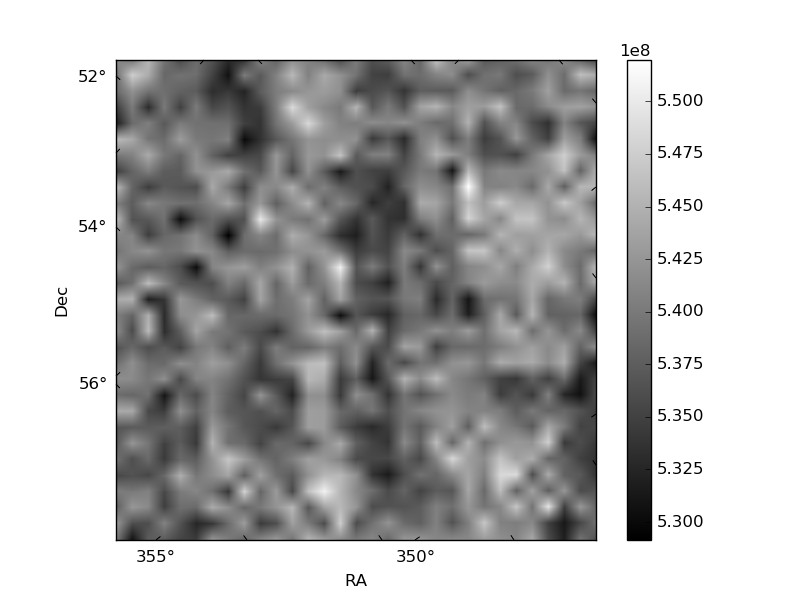
Histogram calculated using DETX and DETY for each event in the final _common_clean file
| Quadrant A | 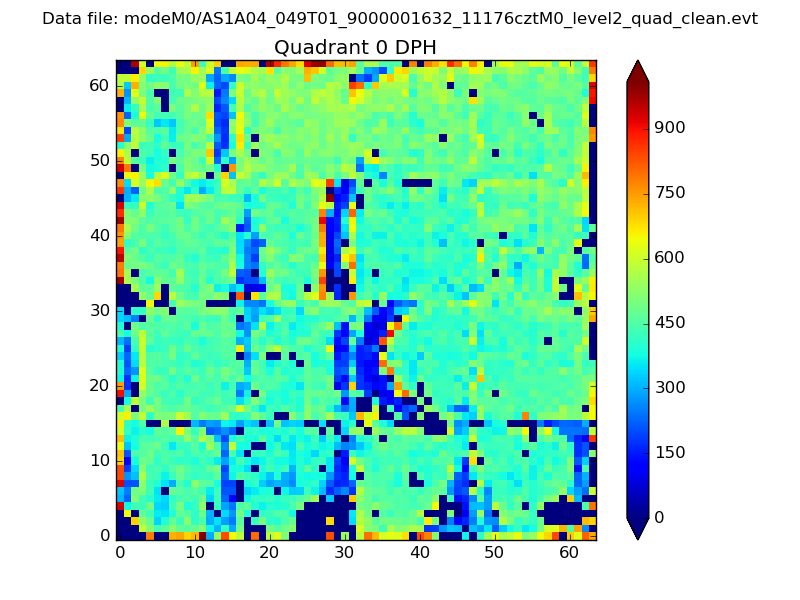 |
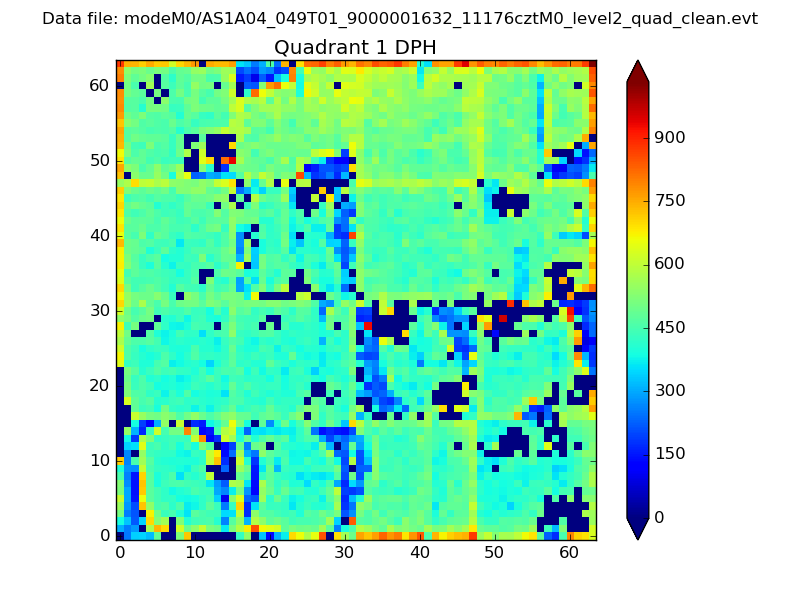 |
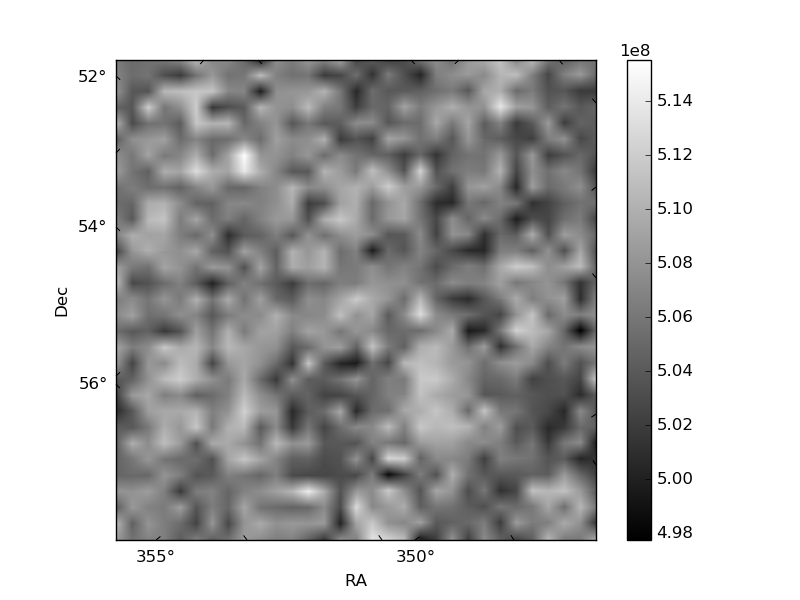
Quadrant B |
|---|---|---|---|
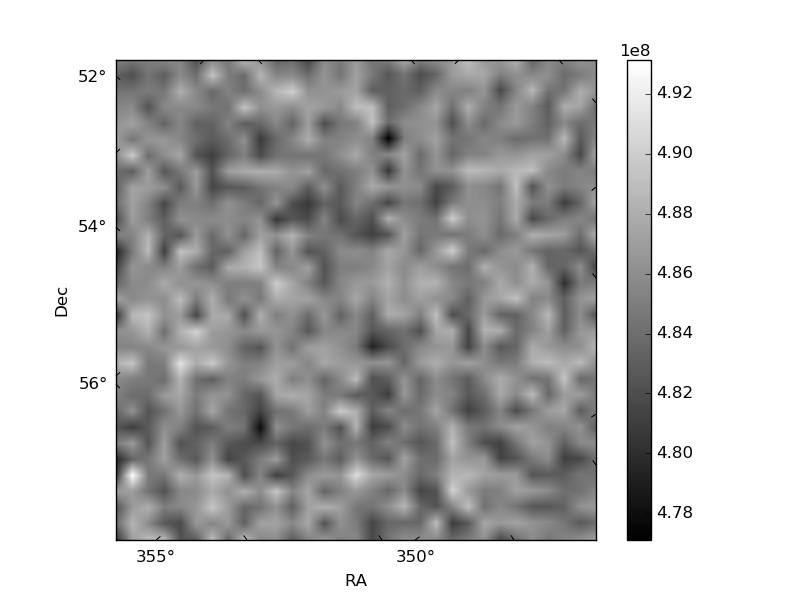
| Quadrant D | 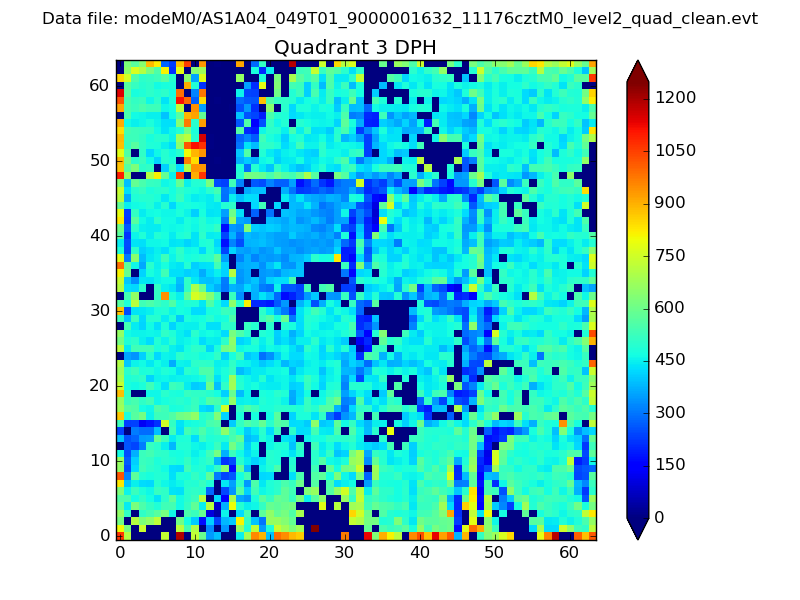 |
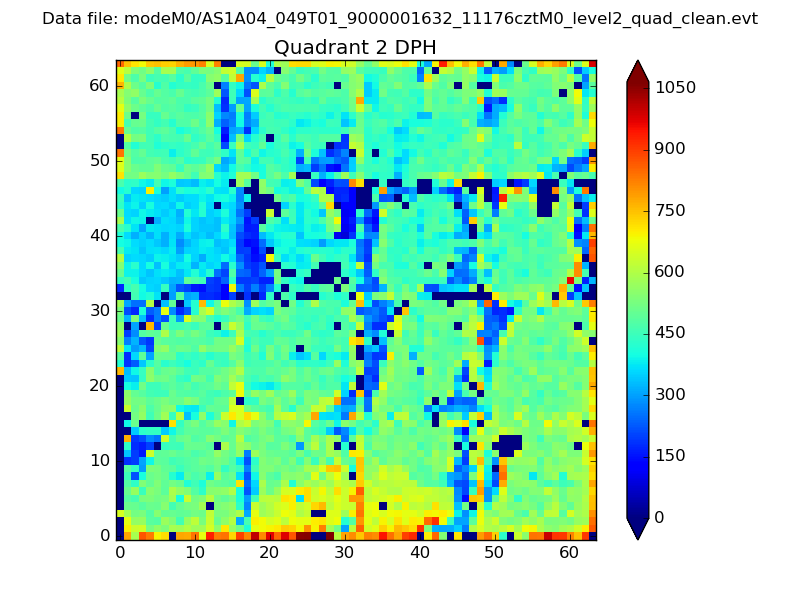 |
Quadrant C |
| Plot type | Count rate plots | Images |
|---|---|---|
| Comparison with Poisson distribution Blue bars denote a histogram of data divided into 1 sec bins. Red curve is a Poisson curve with rate = median count rate of data. |
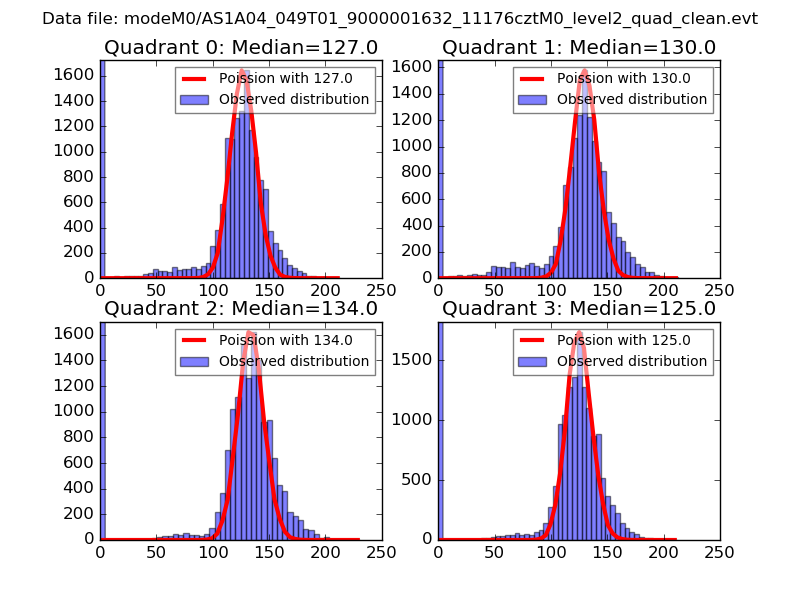 |
 |
| Quadrant-wise count rates Data is divided into 100 sec bins |
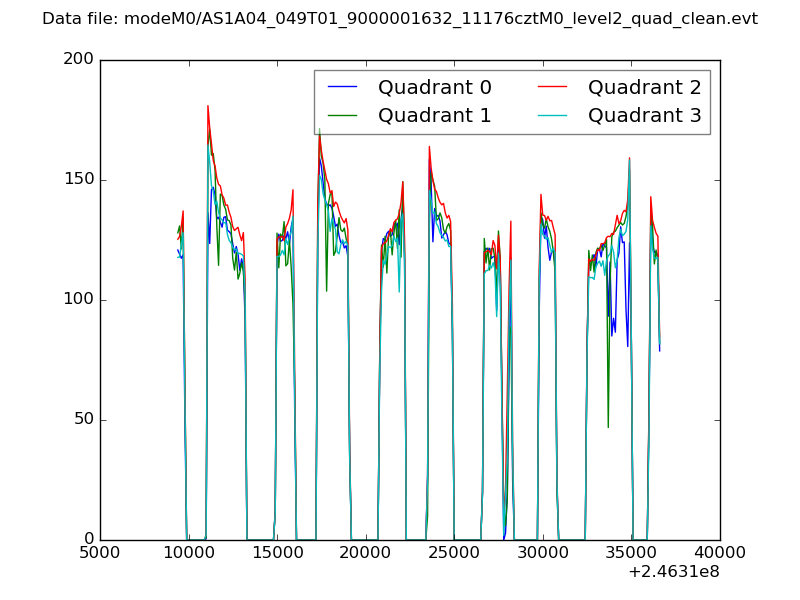 |
|
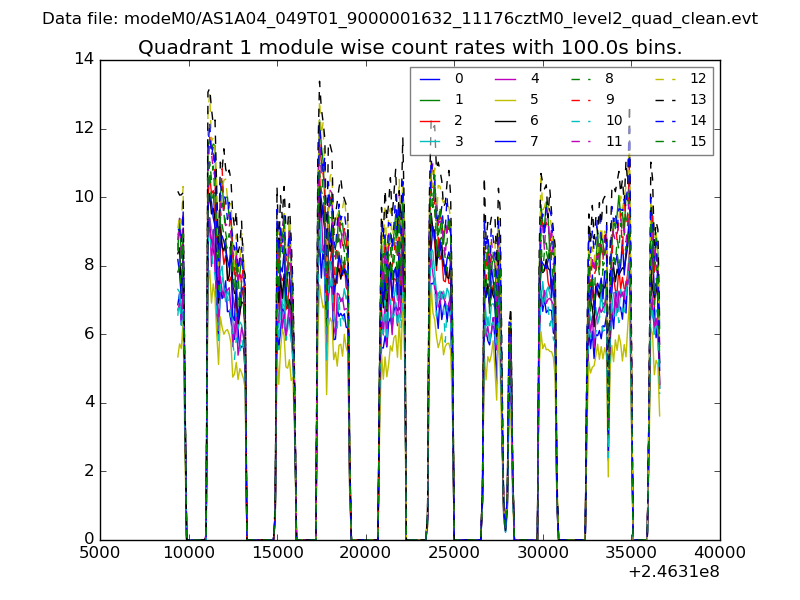
| Module-wise count rates for Quadrant A Data is divided into 100 sec bins |
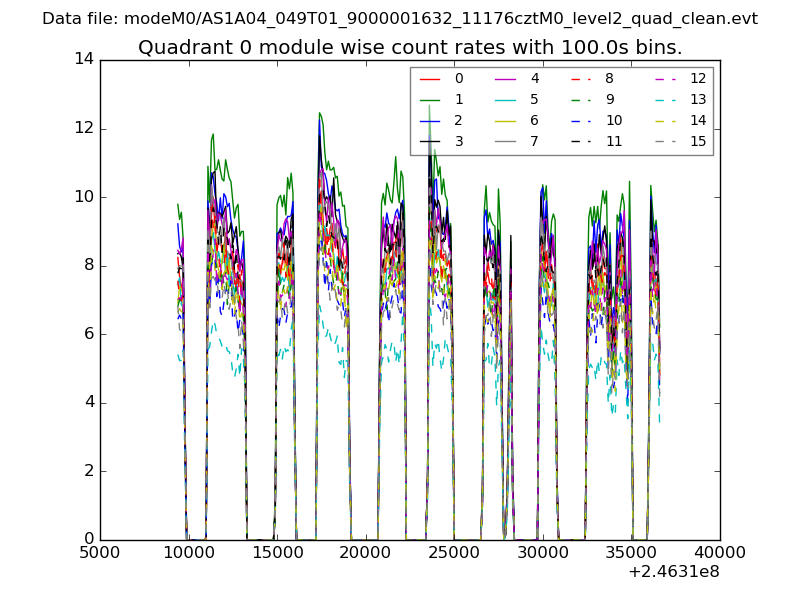 |
 |
| Module-wise count rates for Quadrant B Data is divided into 100 sec bins |
 |
 |
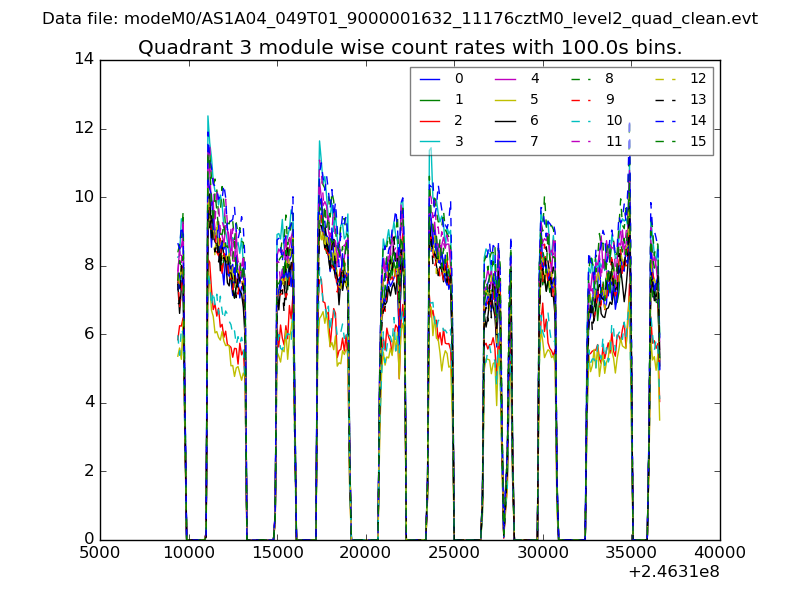
| Module-wise count rates for Quadrant C Data is divided into 100 sec bins |
 |
 |
| Module-wise count rates for Quadrant D Data is divided into 100 sec bins |
 |
 |
| Parameter | Plot |
|---|---|
| CZT HV Monitor |  |
| D_VDD | 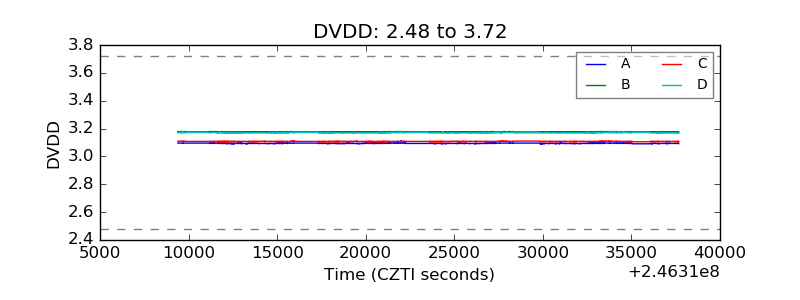 |
| Temperature 1 | 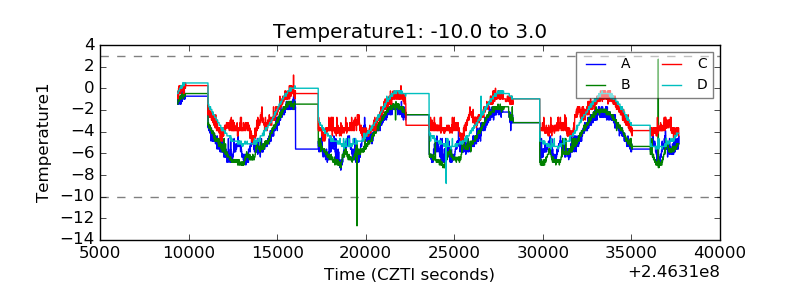 |
| Veto HV Monitor | 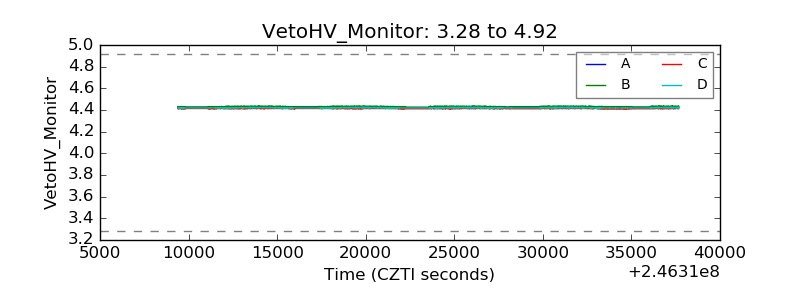 |
| Veto LLD | 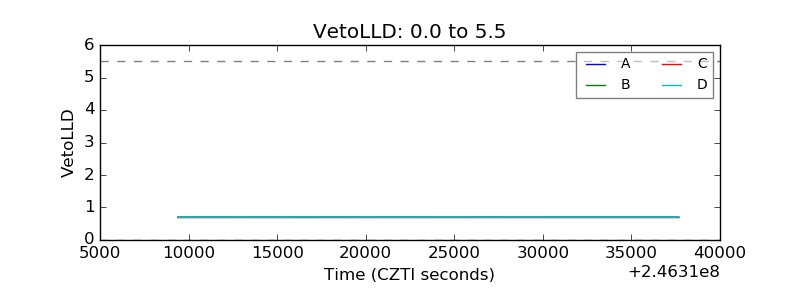 |
| Alpha Counter | 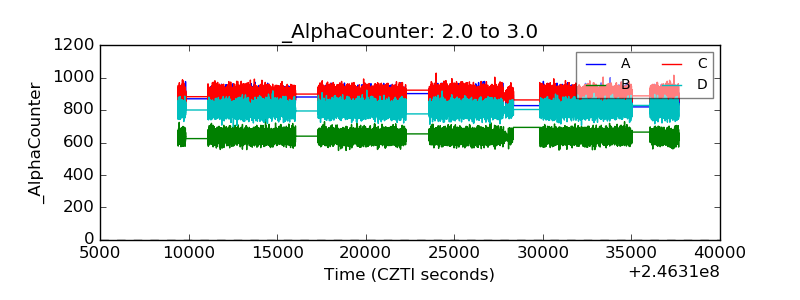 |
| _CPM_Rate | 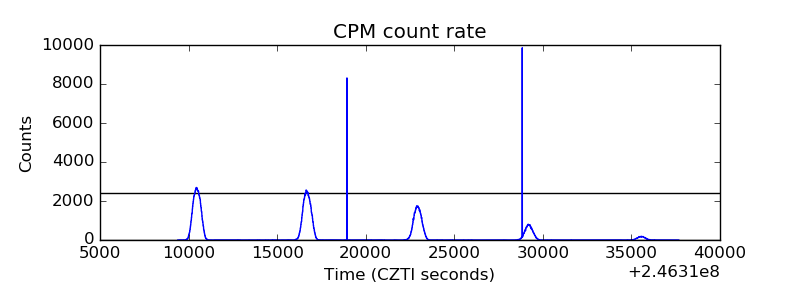 |
| CZT Counter | 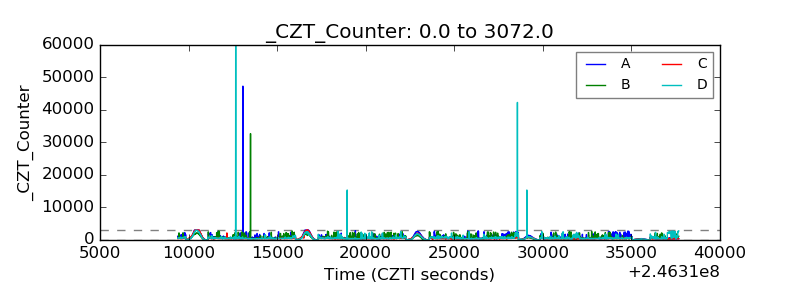 |
| +2.5 Volts monitor |  |
| +5 Volts monitor | 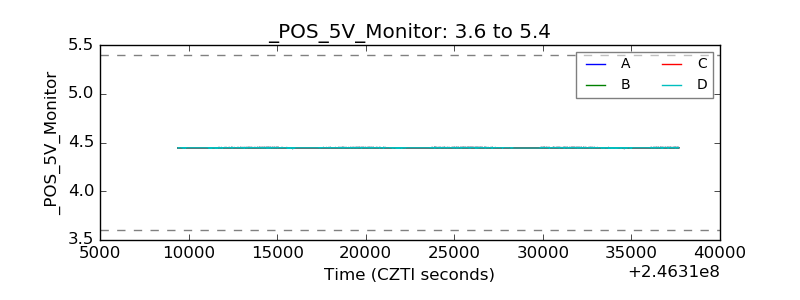 |
| _ROLL_ROT | 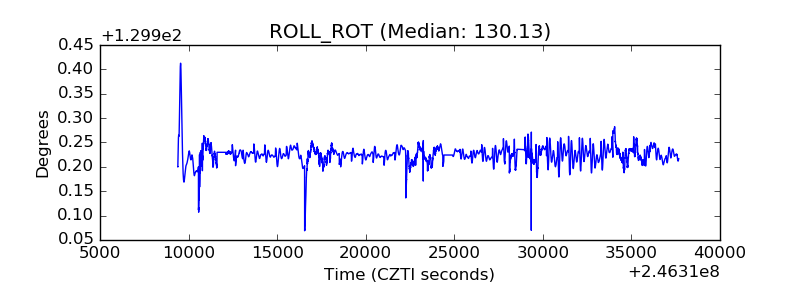 |
| _Roll_DEC | 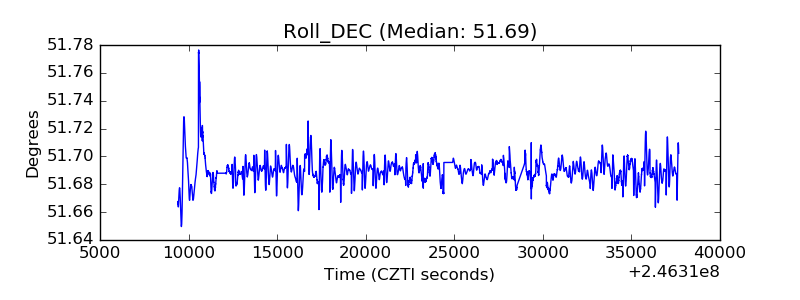 |
| _Roll_RA | 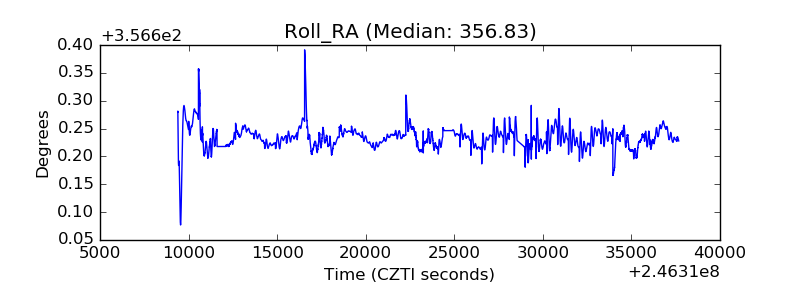 |
| Veto Counter | 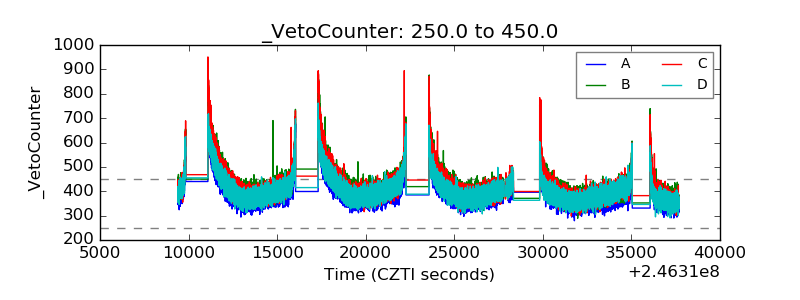 |