| Param | Original file | Final file |
|---|---|---|
| Filename | modeM0/AS1A04_049T01_9000001632_11177cztM0_level2.evt | modeM0/AS1A04_049T01_9000001632_11177cztM0_level2_quad_clean.evt |
| Size (bytes) | 675,046,080 | 83,687,040 |
| Size | 643.8 MB | 79.8 MB |
| Events in quadrant A | 4,344,561 | 506,304 |
| Events in quadrant B | 5,315,431 | 511,877 |
| Events in quadrant C | 3,188,738 | 532,649 |
| Events in quadrant D | 7,110,773 | 484,252 |
| Mode M9 | |||
|---|---|---|---|
| Quadrant | BADHDUFLAG | Total packets | Discarded packets |
| A | 0 | 6 | 0 |
| B | 0 | 6 | 0 |
| C | 0 | 6 | 0 |
| D | 0 | 7 | 0 |
| Mode SS | |||
|---|---|---|---|
| Quadrant | BADHDUFLAG | Total packets | Discarded packets |
| A | 0 | 144 | 0 |
| B | 0 | 144 | 0 |
| C | 0 | 144 | 0 |
| D | 0 | 144 | 0 |
| Mode M0 | |||
|---|---|---|---|
| Quadrant | BADHDUFLAG | Total packets | Discarded packets |
| A | 0 | 17691 | 3 |
| B | 0 | 20535 | 4 |
| C | 0 | 14666 | 2 |
| D | 0 | 26015 | 4 |
| Quadrant | Total seconds | Saturated seconds | Saturation percentage |
|---|---|---|---|
| A | 7166 | 280 | 3.907340% |
| B | 7165 | 580 | 8.094906% |
| C | 7166 | 79 | 1.102428% |
| D | 7165 | 848 | 11.835311% |
Noise dominated data is calculated using 1-second bins in cleaned event files. If a bin has >2000 counts, and if more than 50% of those come from <1% of pixels, then it is considered to be noise-dominated and hence unusable.
| Quadrant | # 1 sec bins | Bins with >0 counts | Bins with >2000 counts | High rate bins dominated by noise | Noise dominated (total time) | Noise dominated (detector-on time) | Marked lightcurve |
|---|---|---|---|---|---|---|---|
| A | 7716 | 7167 | 106 | 106 | 1.37% | 1.48% | 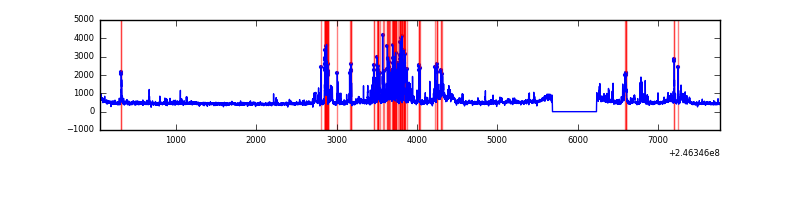 |
| B | 7716 | 7167 | 229 | 229 | 2.97% | 3.20% | 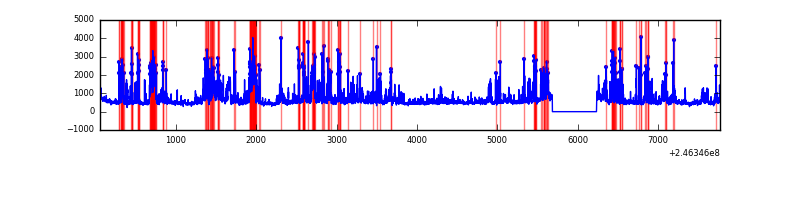 |
| C | 7716 | 7167 | 1 | 1 | 0.01% | 0.01% |  |
| D | 7716 | 7167 | 654 | 654 | 8.48% | 9.13% | 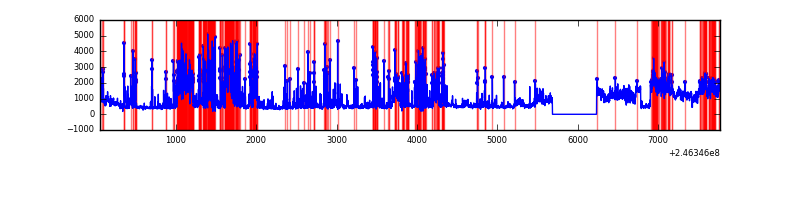 |
Top three noisy pixels from each quadrant. If the there are fewer than three noisy pixels in the level2.evt file, extra rows are filled as -1
| Pixel properties | Quadrant properties | ||||||
|---|---|---|---|---|---|---|---|
| Quadrant | DetID | PixID | Counts | Sigma | Mean | Median | Sigma |
| A | 14 | 238 | 666409 | 3974.56 | 821 | 802 | 167.5 |
| A | 8 | 5 | 325368 | 1938.09 | 821 | 802 | 167.5 |
| A | 8 | 15 | 131556 | 780.78 | 821 | 802 | 167.5 |
| B | 4 | 239 | 1538862 | 9837.52 | 817 | 796 | 156.3 |
| B | 10 | 16 | 164886 | 1049.52 | 817 | 796 | 156.3 |
| B | 15 | 204 | 136327 | 866.86 | 817 | 796 | 156.3 |
| C | 14 | 234 | 8718 | 41.86 | 814 | 816 | 188.8 |
| C | 13 | 61 | 6055 | 27.75 | 814 | 816 | 188.8 |
| C | 12 | 4 | 4576 | 19.92 | 814 | 816 | 188.8 |
| D | 13 | 152 | 1403669 | 7600.99 | 768 | 744 | 184.6 |
| D | 10 | 253 | 1189102 | 6438.47 | 768 | 744 | 184.6 |
| D | 2 | 136 | 635928 | 3441.4 | 768 | 744 | 184.6 |
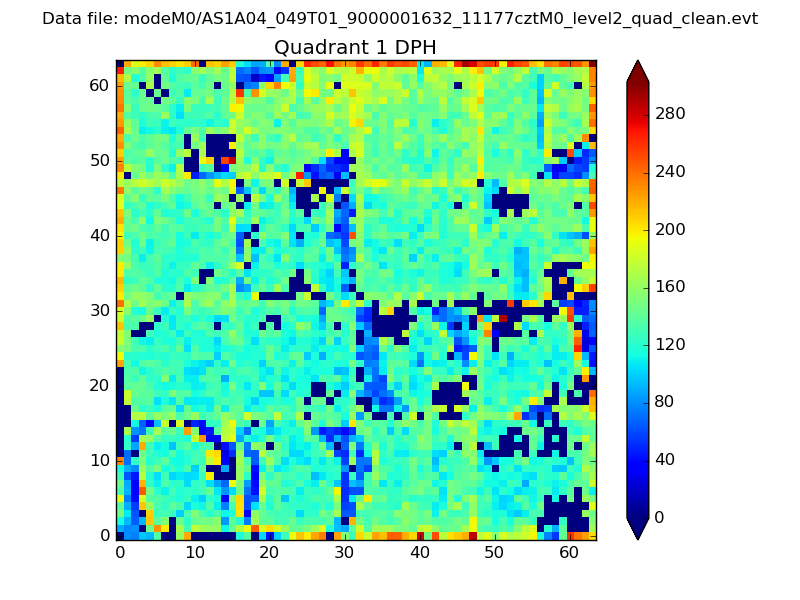
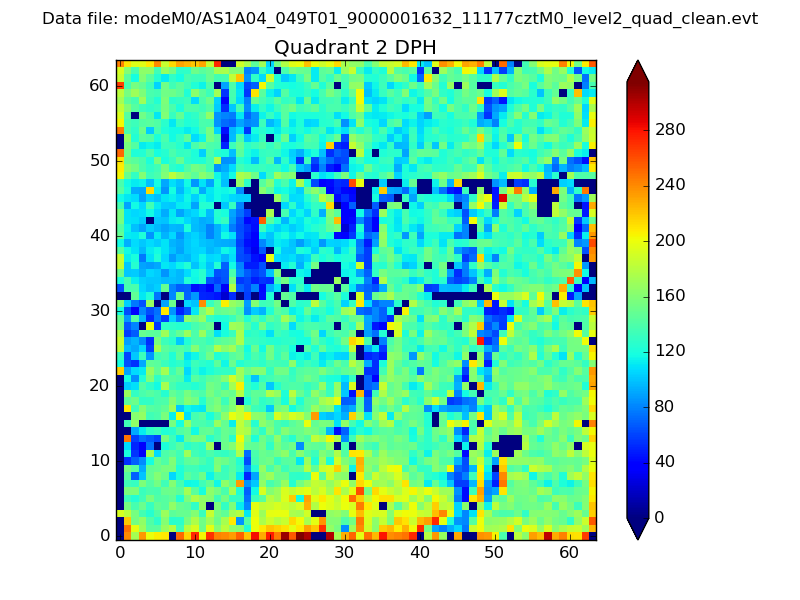
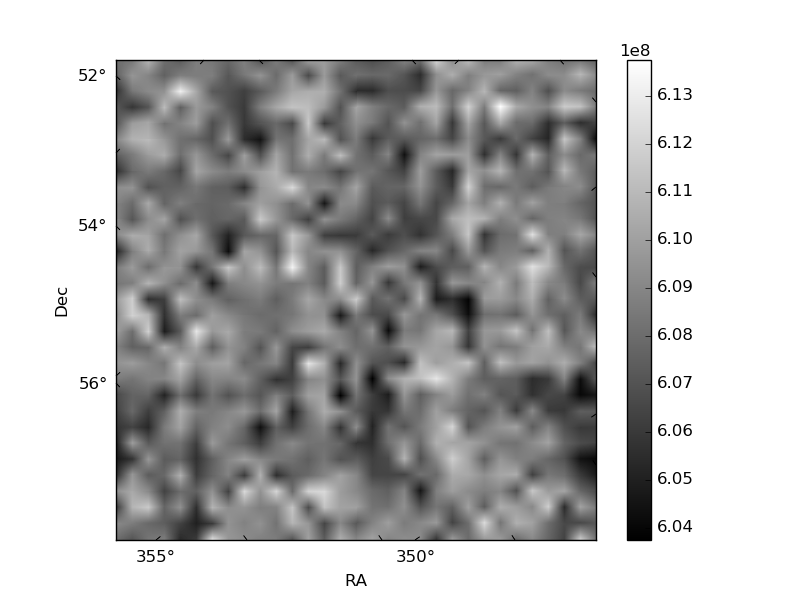
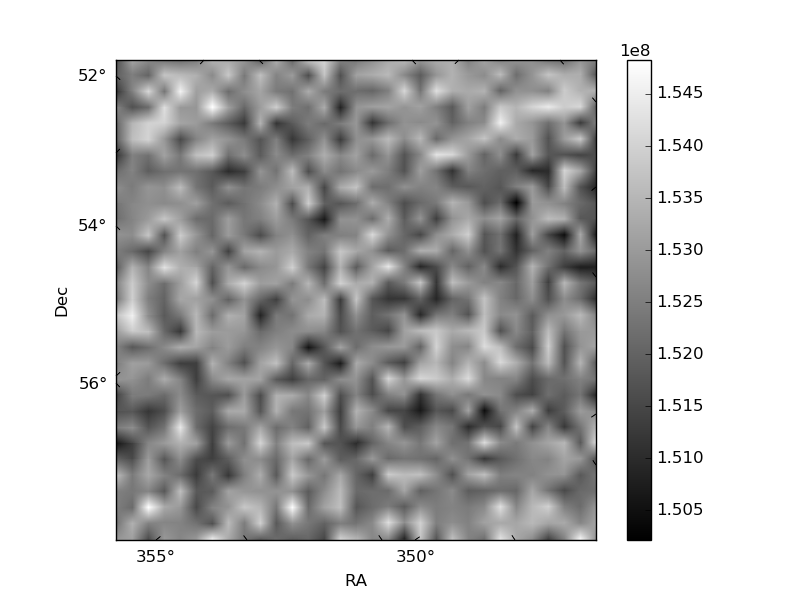
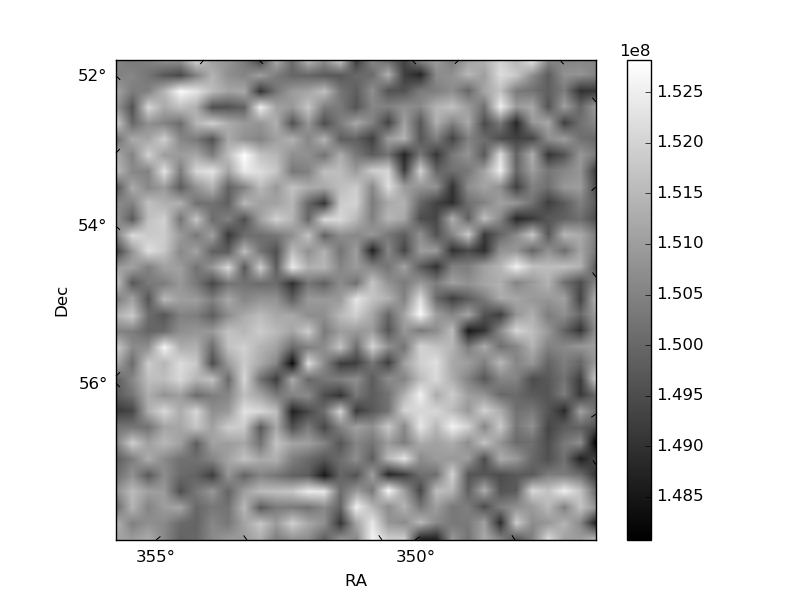
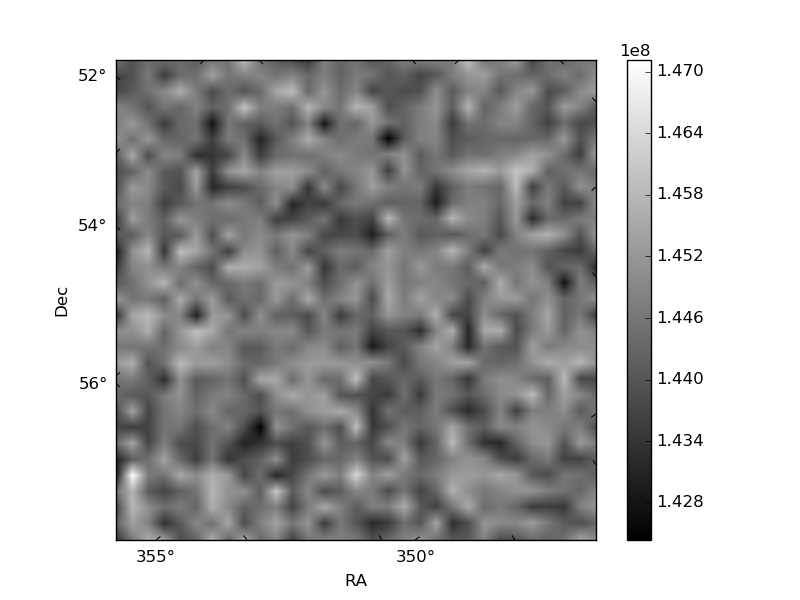
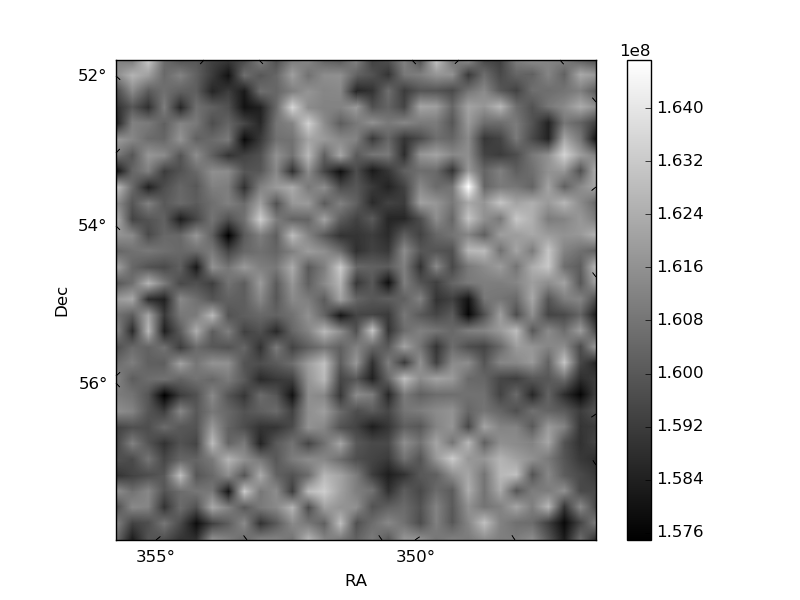
Histogram calculated using DETX and DETY for each event in the final _common_clean file
| Quadrant A | 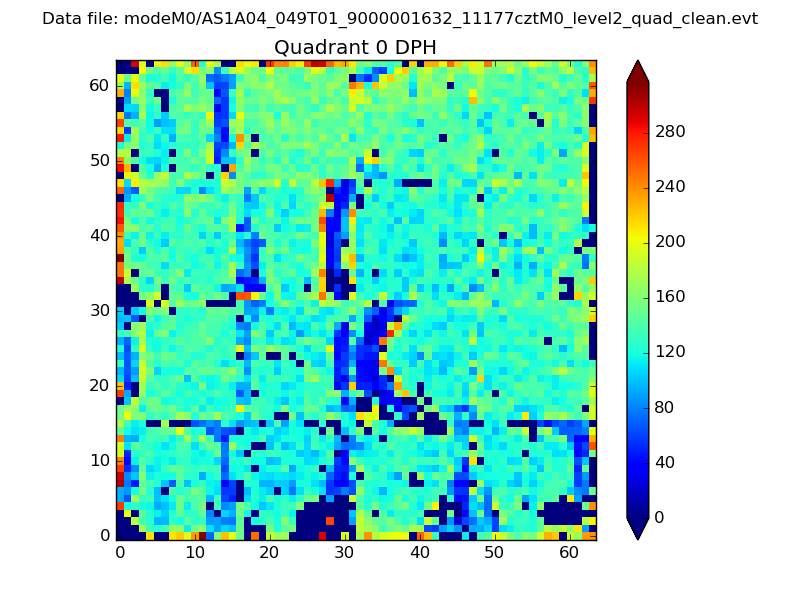 |
 |
Quadrant B |
|---|---|---|---|
| Quadrant D | 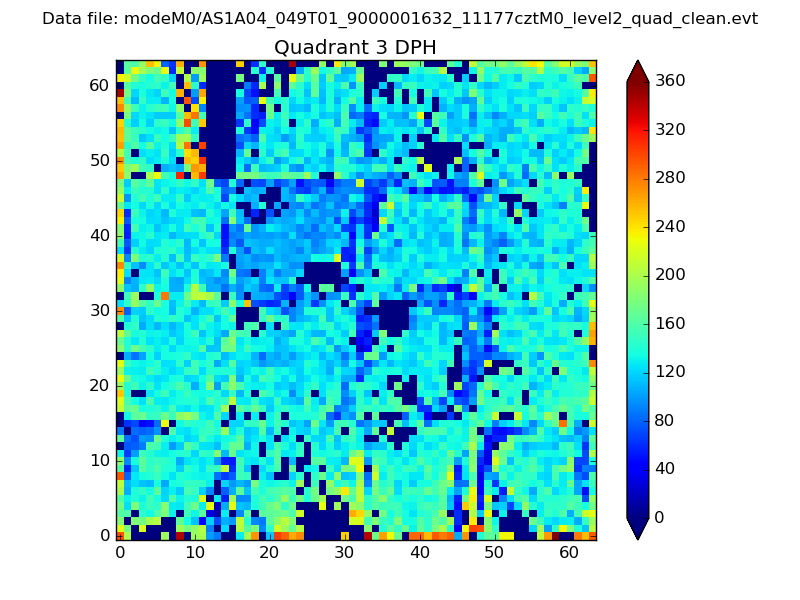 |
 |
Quadrant C |
| Plot type | Count rate plots | Images |
|---|---|---|
| Comparison with Poisson distribution Blue bars denote a histogram of data divided into 1 sec bins. Red curve is a Poisson curve with rate = median count rate of data. |
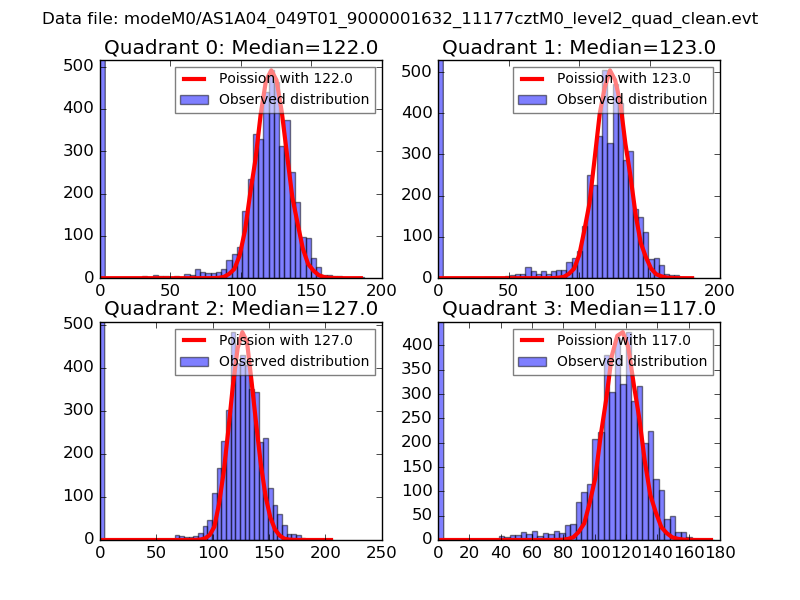 |
 |
| Quadrant-wise count rates Data is divided into 100 sec bins |
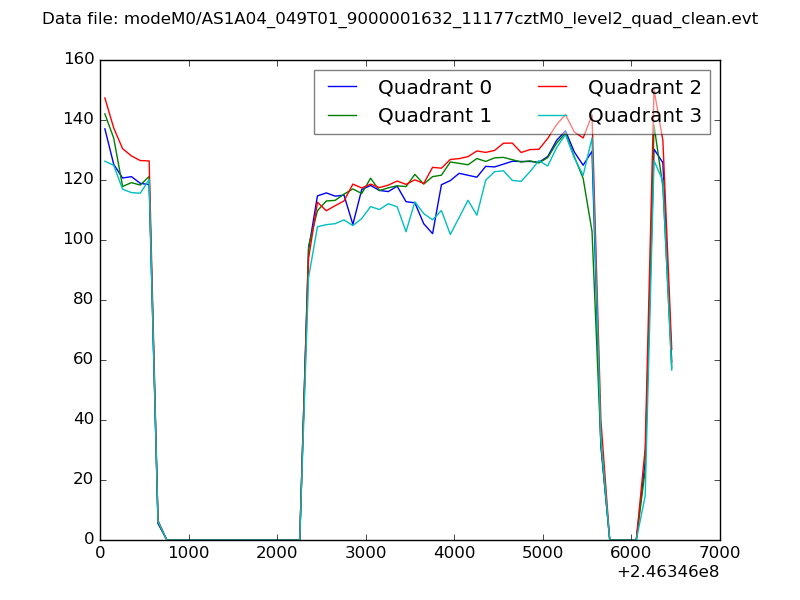 |
|
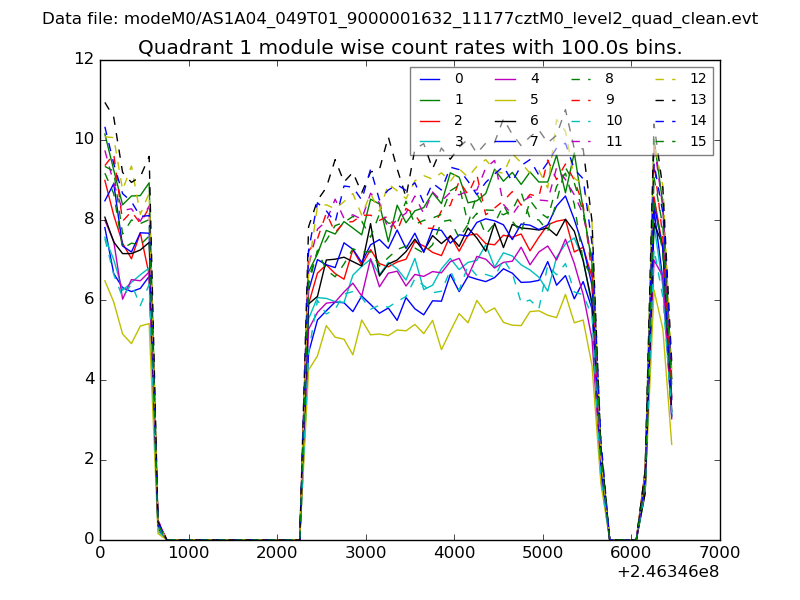
| Module-wise count rates for Quadrant A Data is divided into 100 sec bins |
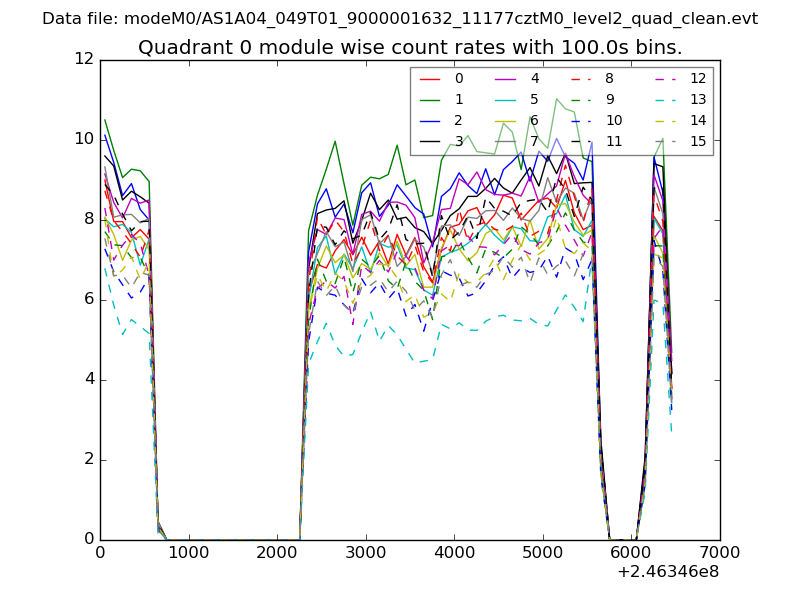 |
 |
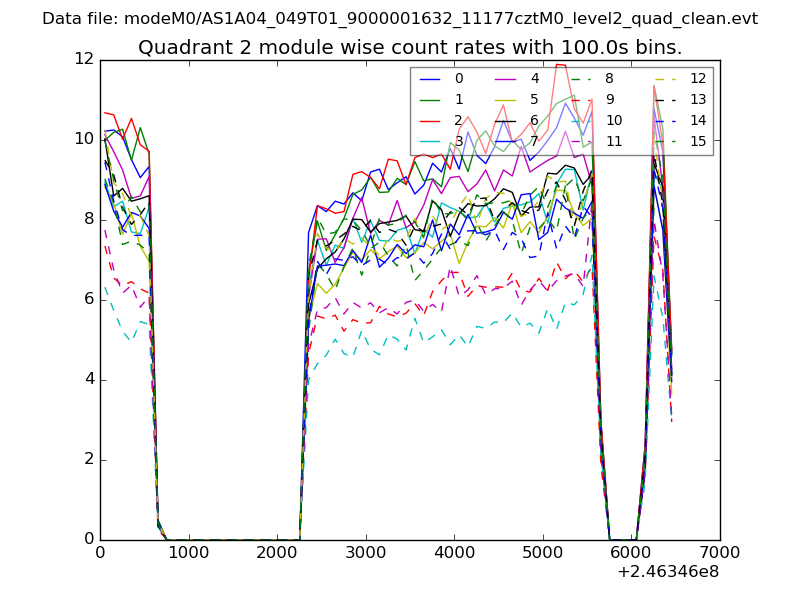
| Module-wise count rates for Quadrant B Data is divided into 100 sec bins |
 |
 |
| Module-wise count rates for Quadrant C Data is divided into 100 sec bins |
 |
 |
| Module-wise count rates for Quadrant D Data is divided into 100 sec bins |
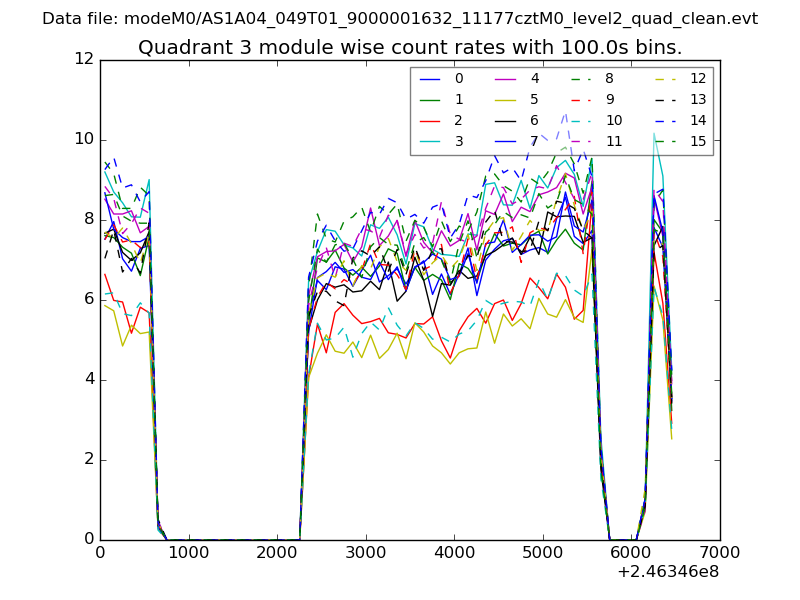 |
 |
| Parameter | Plot |
|---|---|
| CZT HV Monitor | 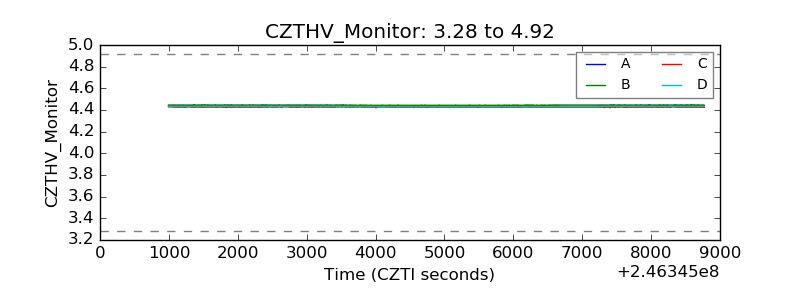 |
| D_VDD | 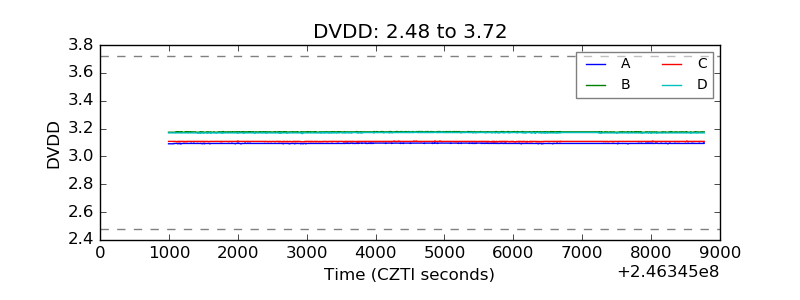 |
| Temperature 1 | 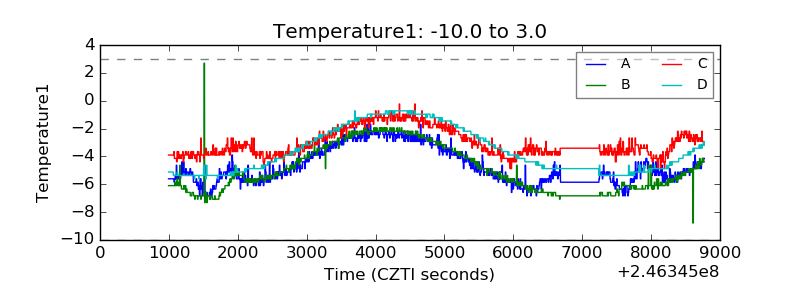 |
| Veto HV Monitor | 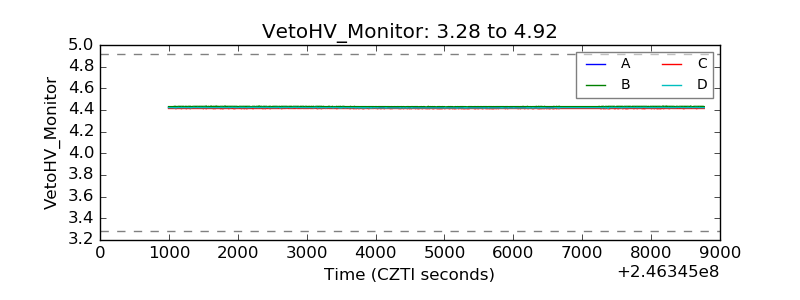 |
| Veto LLD | 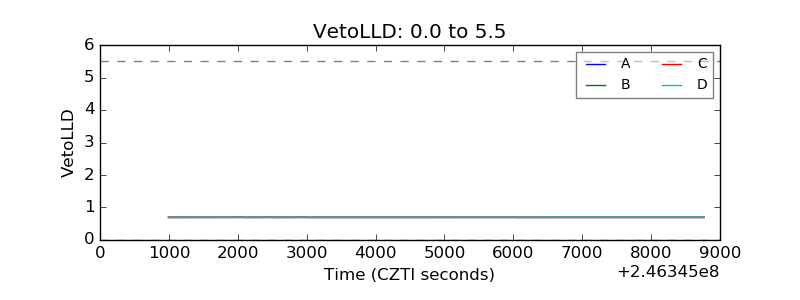 |
| Alpha Counter | 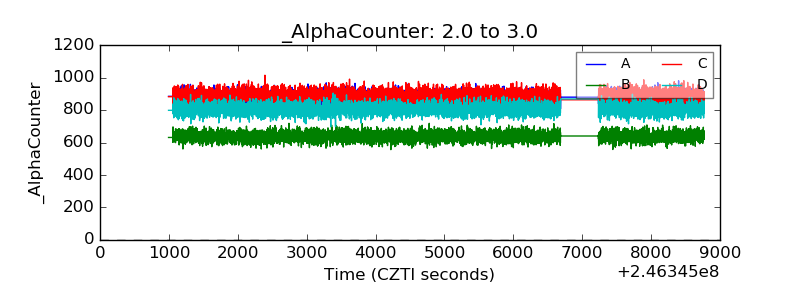 |
| _CPM_Rate | 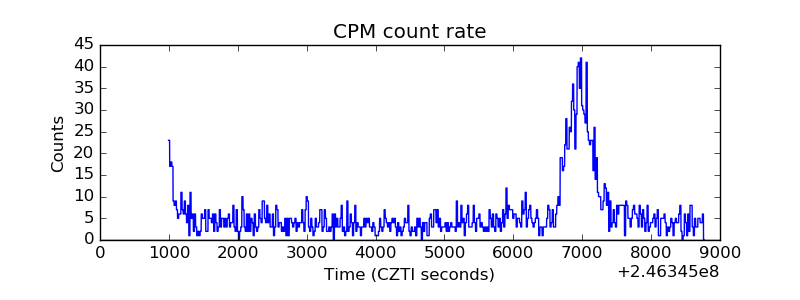 |
| CZT Counter | 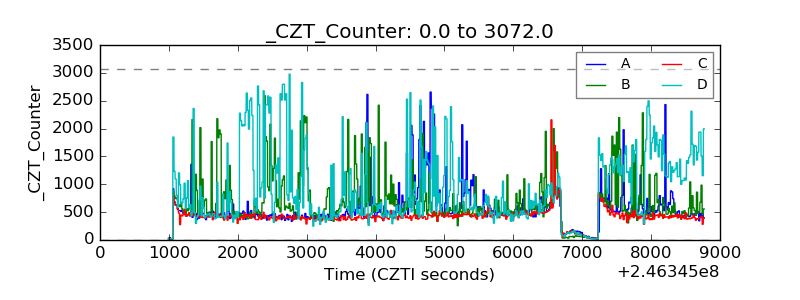 |
| +2.5 Volts monitor |  |
| +5 Volts monitor |  |
| _ROLL_ROT | 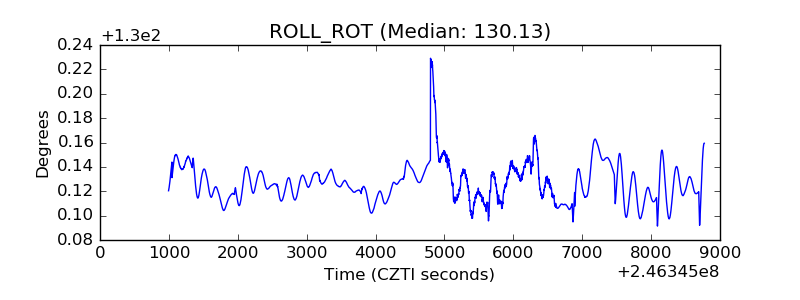 |
| _Roll_DEC | 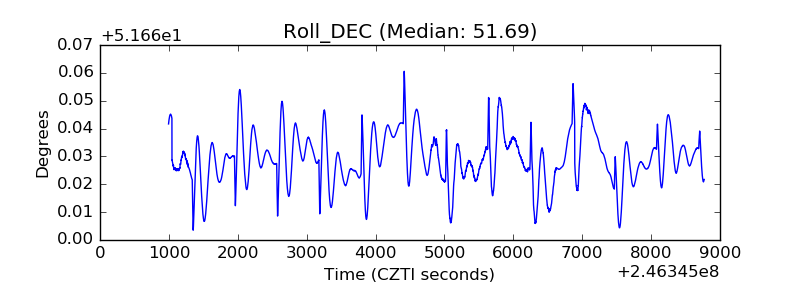 |
| _Roll_RA | 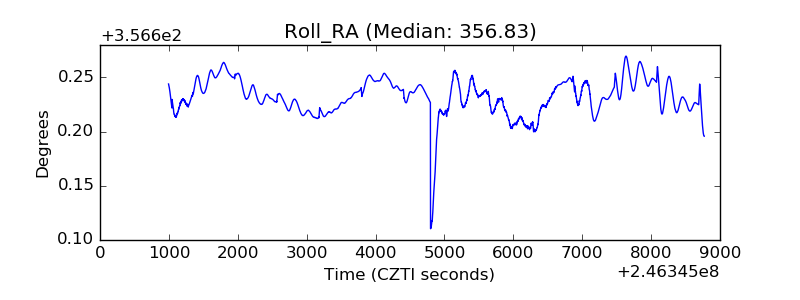 |
| Veto Counter | 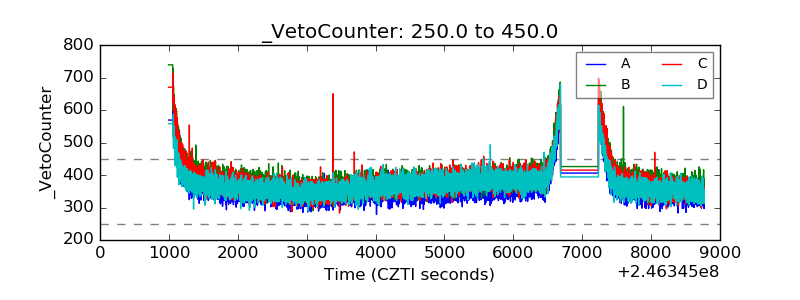 |