| Param | Original file | Final file |
|---|---|---|
| Filename | modeM0/AS1A04_049T01_9000001632_11179cztM0_level2.evt | modeM0/AS1A04_049T01_9000001632_11179cztM0_level2_quad_clean.evt |
| Size (bytes) | 101,113,920 | 10,704,960 |
| Size | 96.4 MB | 10.2 MB |
| Events in quadrant A | 684,627 | 59,022 |
| Events in quadrant B | 779,788 | 60,186 |
| Events in quadrant C | 489,311 | 58,500 |
| Events in quadrant D | 1,022,583 | 53,615 |
| Mode SS | |||
|---|---|---|---|
| Quadrant | BADHDUFLAG | Total packets | Discarded packets |
| A | 0 | 28 | 2 |
| B | 0 | 28 | 4 |
| C | 0 | 28 | 2 |
| D | 0 | 27 | 3 |
| Mode M0 | |||
|---|---|---|---|
| Quadrant | BADHDUFLAG | Total packets | Discarded packets |
| A | 0 | 3103 | 259 |
| B | 0 | 3385 | 272 |
| C | 0 | 2710 | 265 |
| D | 0 | 4535 | 686 |
| Quadrant | Total seconds | Saturated seconds | Saturation percentage |
|---|---|---|---|
| A | 1226 | 41 | 3.344209% |
| B | 1228 | 25 | 2.035831% |
| C | 1222 | 0 | 0.000000% |
| D | 1202 | 76 | 6.322795% |
Noise dominated data is calculated using 1-second bins in cleaned event files. If a bin has >2000 counts, and if more than 50% of those come from <1% of pixels, then it is considered to be noise-dominated and hence unusable.
| Quadrant | # 1 sec bins | Bins with >0 counts | Bins with >2000 counts | High rate bins dominated by noise | Noise dominated (total time) | Noise dominated (detector-on time) | Marked lightcurve |
|---|---|---|---|---|---|---|---|
| A | 1308 | 1259 | 28 | 28 | 2.14% | 2.22% | 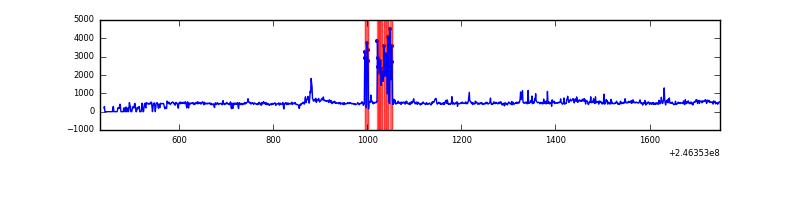 |
| B | 1317 | 1262 | 18 | 18 | 1.37% | 1.43% | 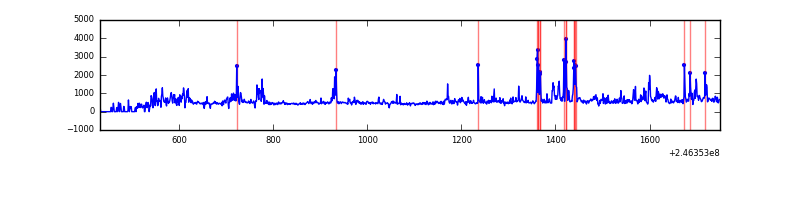 |
| C | 1299 | 1251 | 0 | 0 | 0.00% | 0.00% | 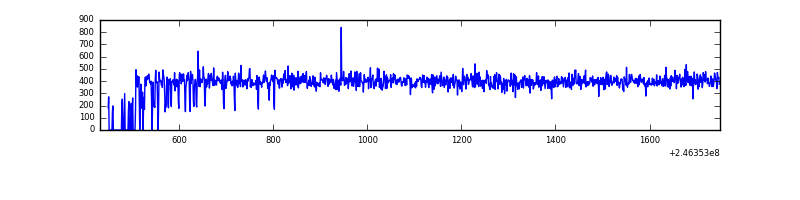 |
| D | 1291 | 1242 | 77 | 77 | 5.96% | 6.20% | 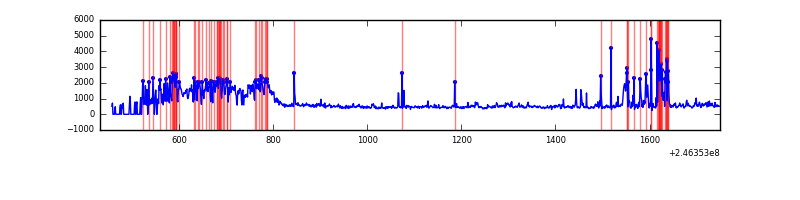 |
Top three noisy pixels from each quadrant. If the there are fewer than three noisy pixels in the level2.evt file, extra rows are filled as -1
| Pixel properties | Quadrant properties | ||||||
|---|---|---|---|---|---|---|---|
| Quadrant | DetID | PixID | Counts | Sigma | Mean | Median | Sigma |
| A | 8 | 5 | 125110 | 4337.51 | 130 | 127 | 28.8 |
| A | 8 | 15 | 36382 | 1258.22 | 130 | 127 | 28.8 |
| A | 14 | 238 | 13790 | 474.17 | 130 | 127 | 28.8 |
| B | 4 | 239 | 149913 | 5543.64 | 131 | 128 | 27.0 |
| B | 11 | 51 | 40667 | 1500.38 | 131 | 128 | 27.0 |
| B | 10 | 16 | 24832 | 914.31 | 131 | 128 | 27.0 |
| C | 13 | 61 | 949 | 26.36 | 125 | 125 | 31.3 |
| C | 14 | 234 | 910 | 25.11 | 125 | 125 | 31.3 |
| C | 8 | 222 | 342 | 6.94 | 125 | 125 | 31.3 |
| D | 13 | 152 | 219145 | 7087.63 | 120 | 116 | 30.9 |
| D | 2 | 136 | 192648 | 6230.2 | 120 | 116 | 30.9 |
| D | 1 | 52 | 109945 | 3553.99 | 120 | 116 | 30.9 |
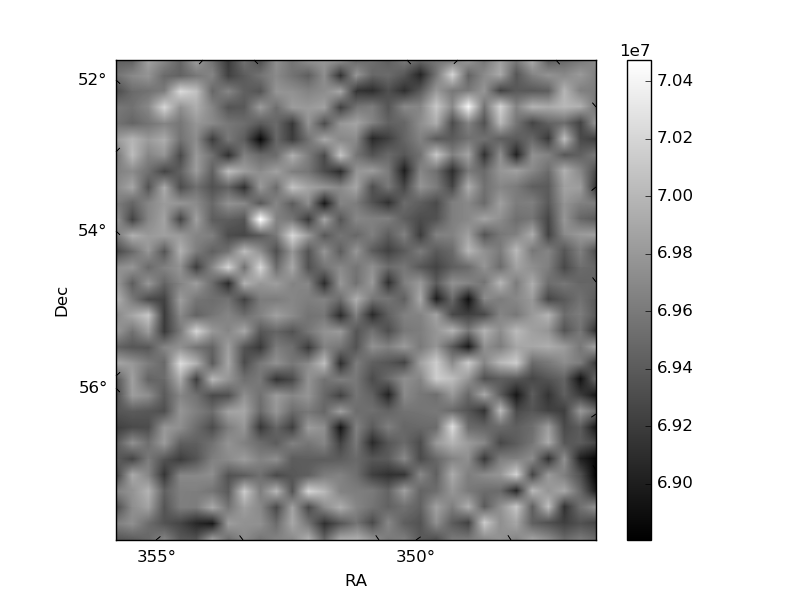
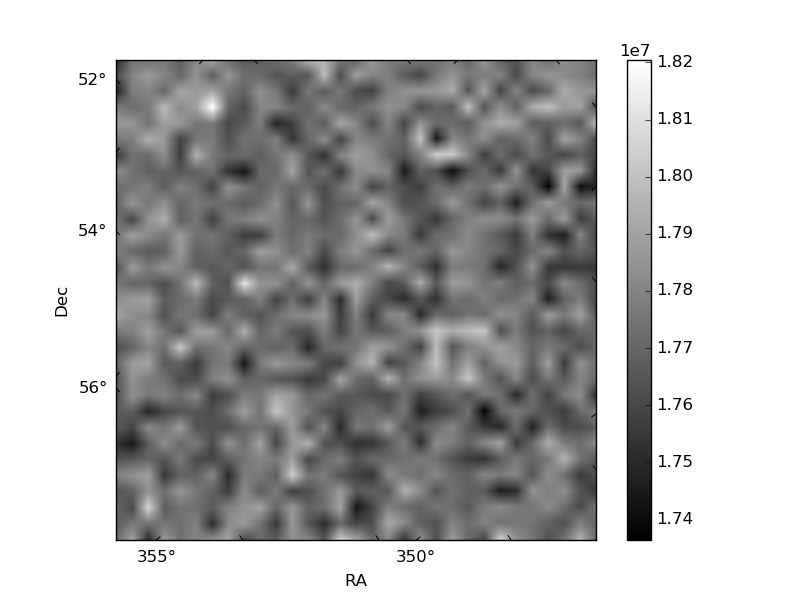
Histogram calculated using DETX and DETY for each event in the final _common_clean file
| Quadrant A | 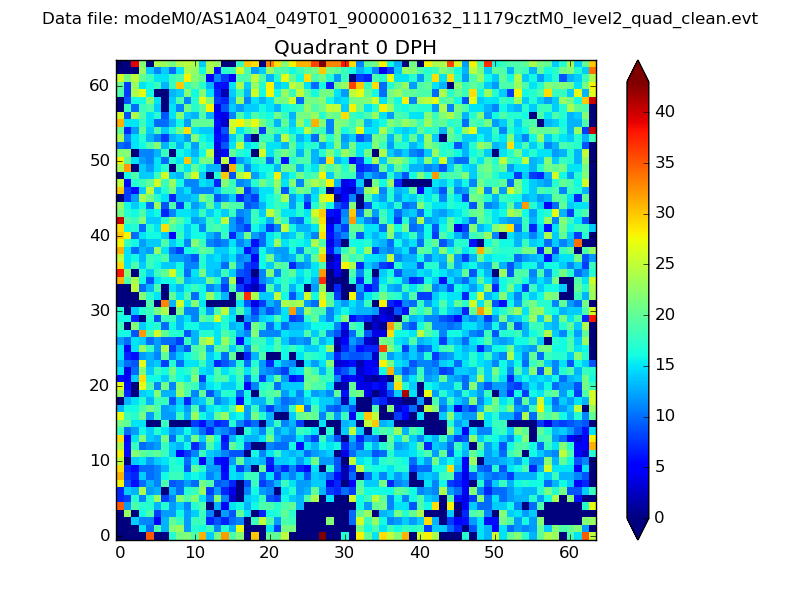 |
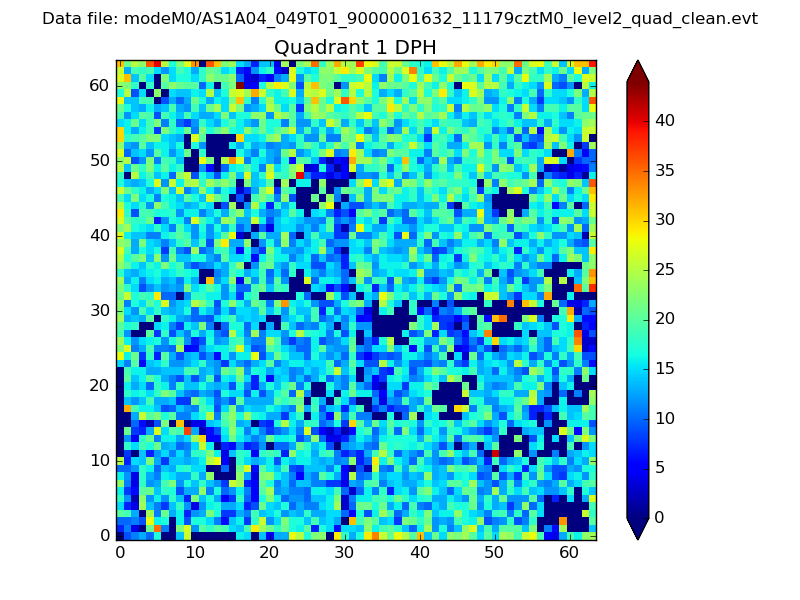 |
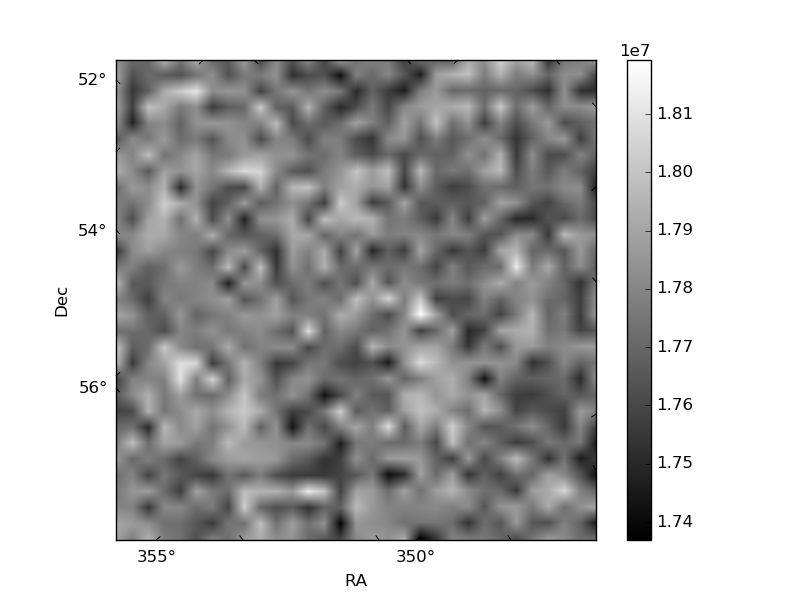
Quadrant B |
|---|---|---|---|
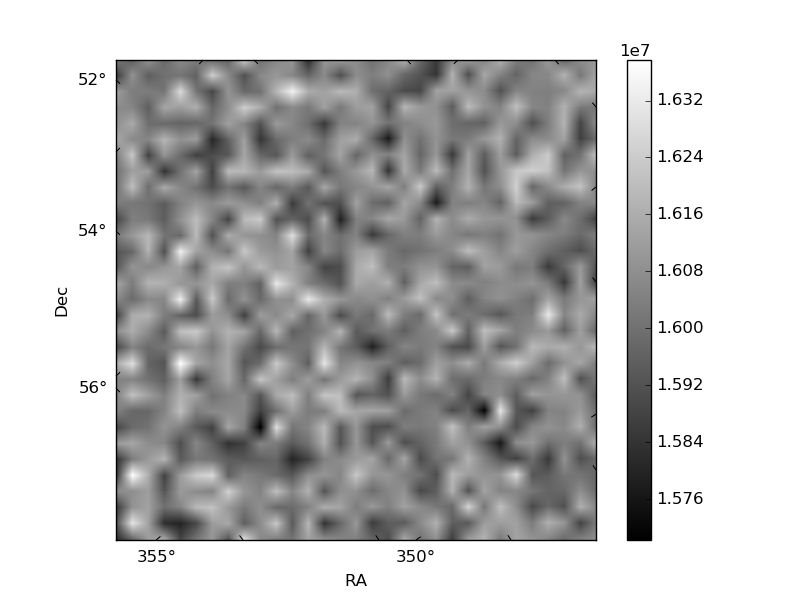
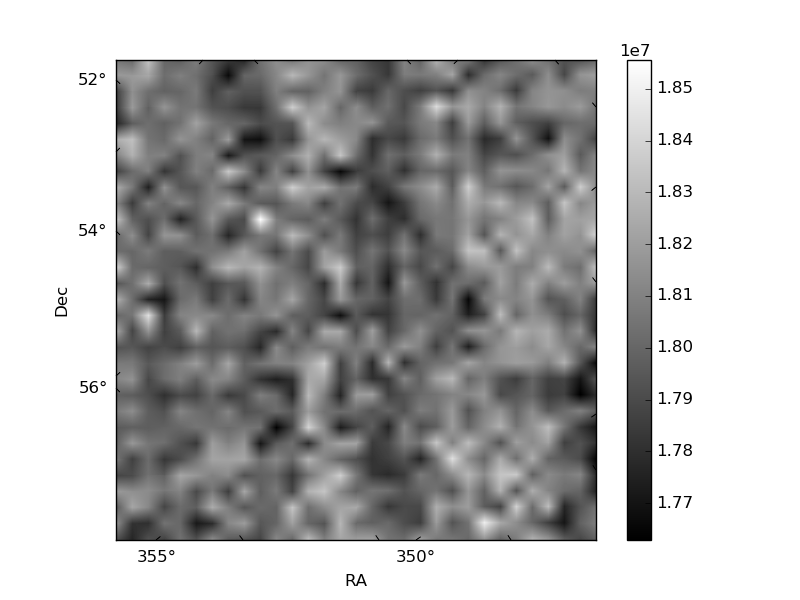
| Quadrant D | 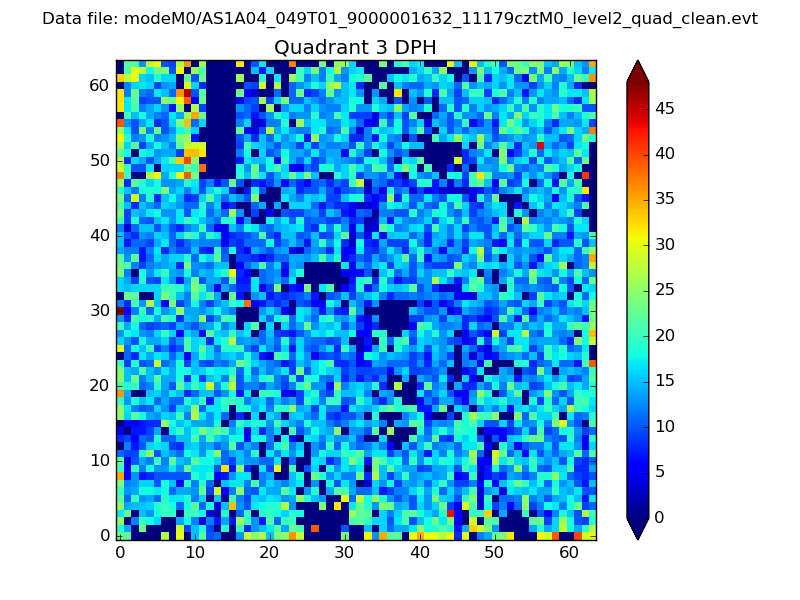 |
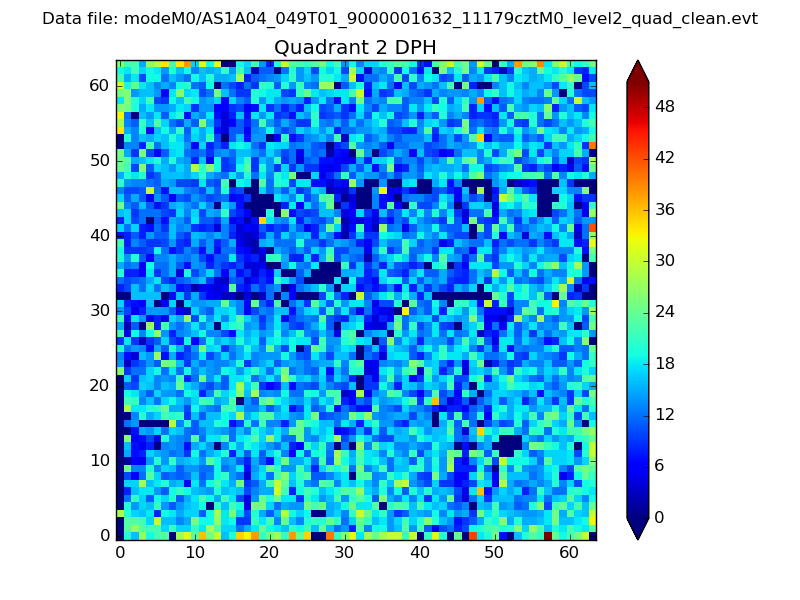 |
Quadrant C |
| Plot type | Count rate plots | Images |
|---|---|---|
| Comparison with Poisson distribution Blue bars denote a histogram of data divided into 1 sec bins. Red curve is a Poisson curve with rate = median count rate of data. |
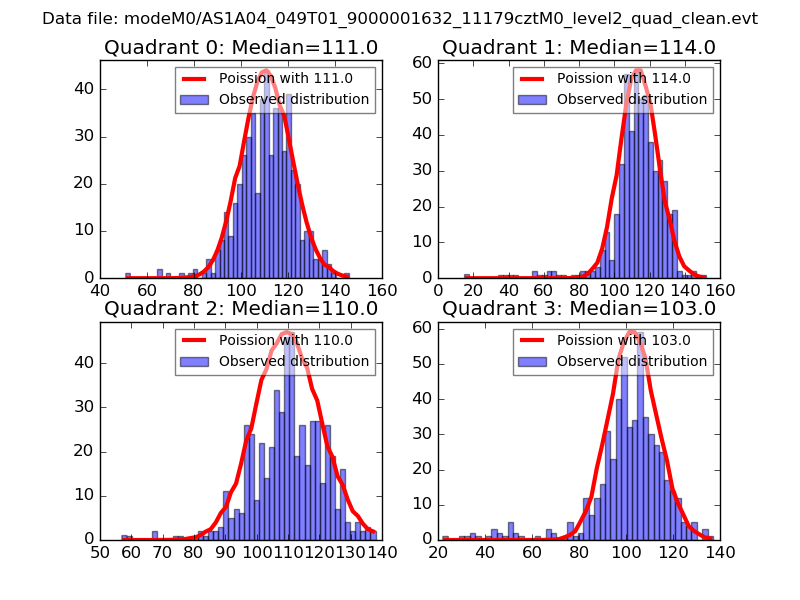 |
 |
| Quadrant-wise count rates Data is divided into 100 sec bins |
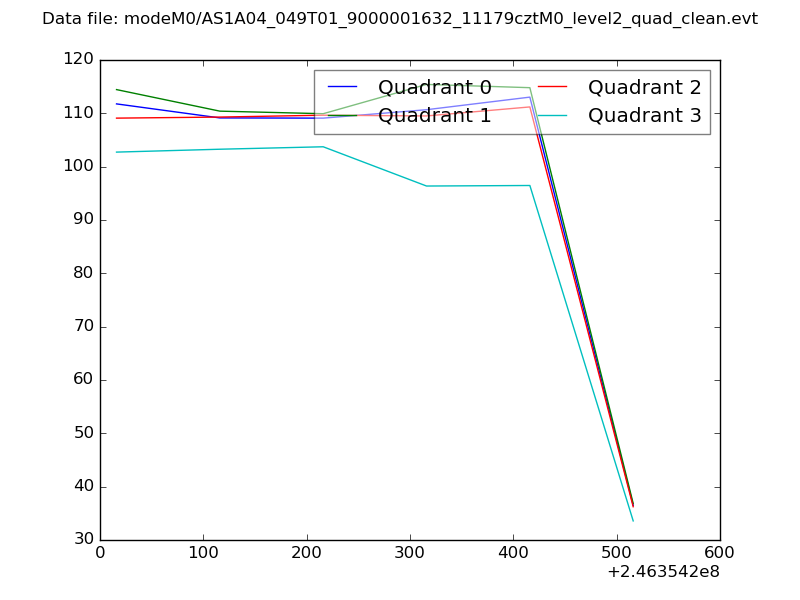 |
|
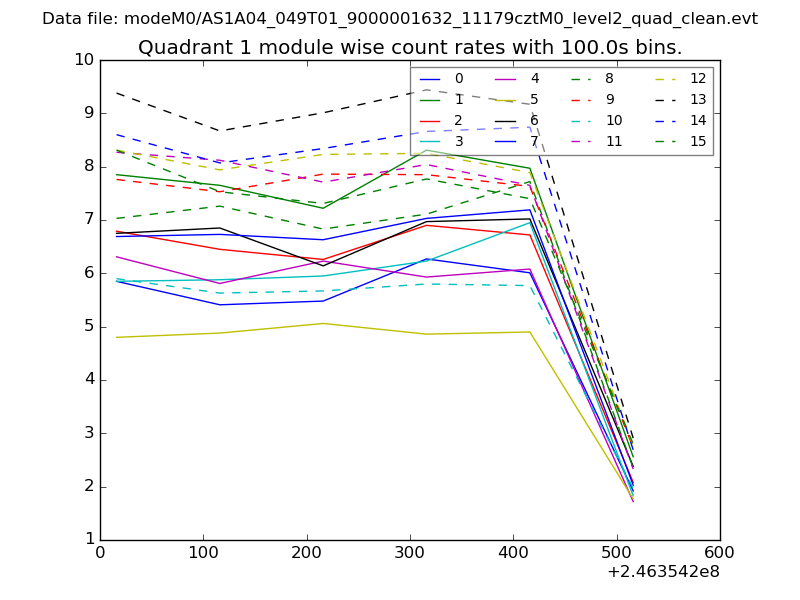
| Module-wise count rates for Quadrant A Data is divided into 100 sec bins |
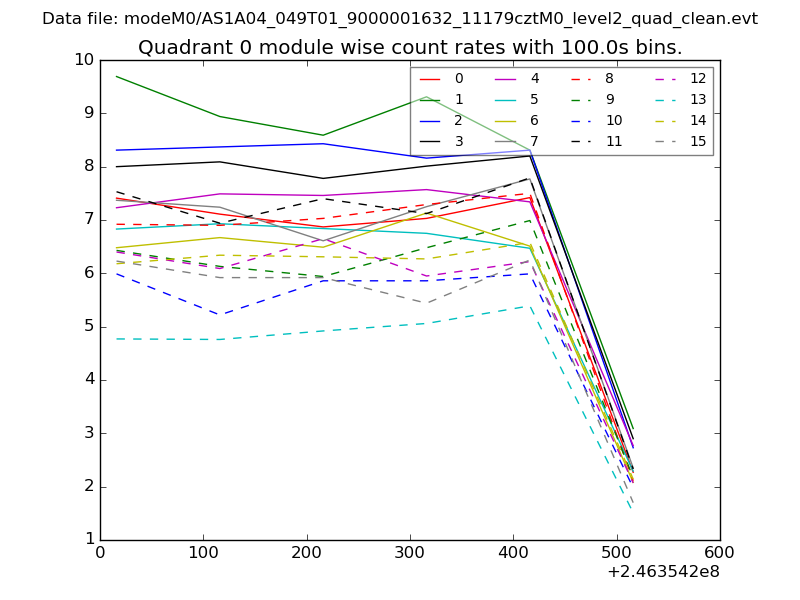 |
 |
| Module-wise count rates for Quadrant B Data is divided into 100 sec bins |
 |
 |
| Module-wise count rates for Quadrant C Data is divided into 100 sec bins |
 |
 |
| Module-wise count rates for Quadrant D Data is divided into 100 sec bins |
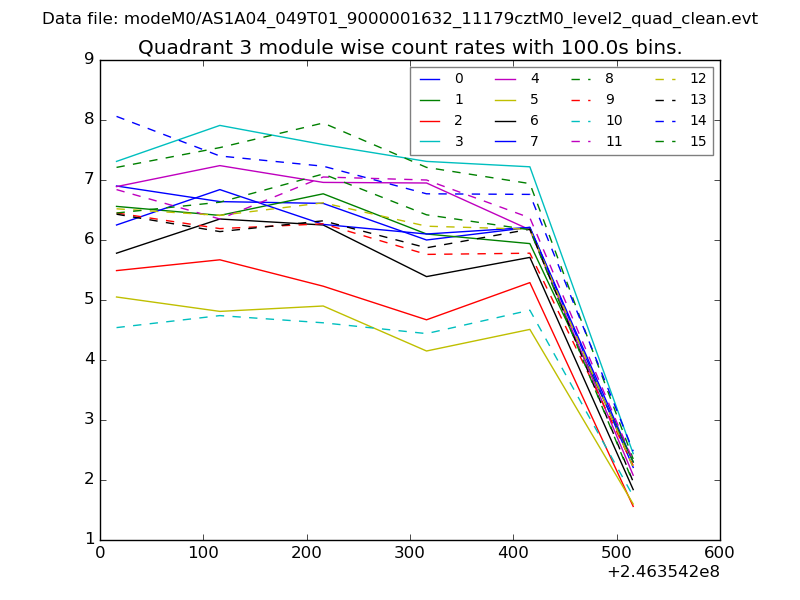 |
 |
| Parameter | Plot |
|---|---|
| CZT HV Monitor | 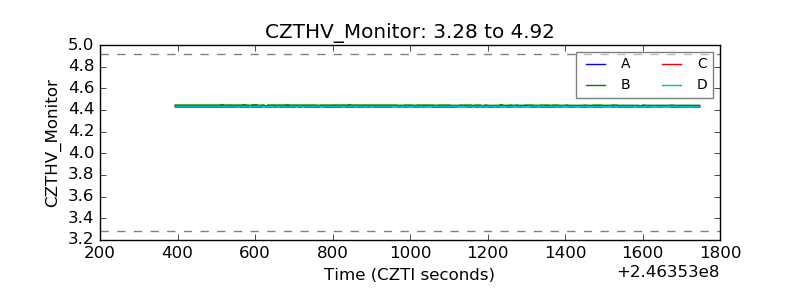 |
| D_VDD | 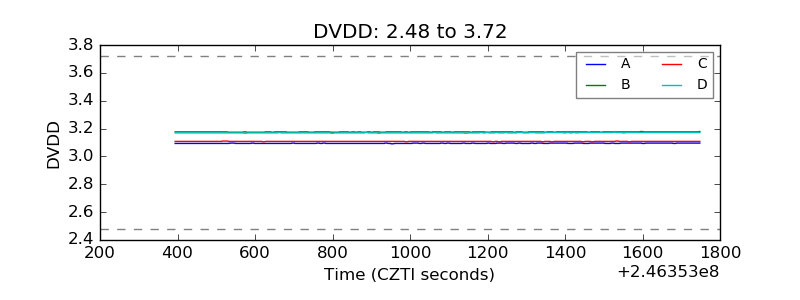 |
| Temperature 1 | 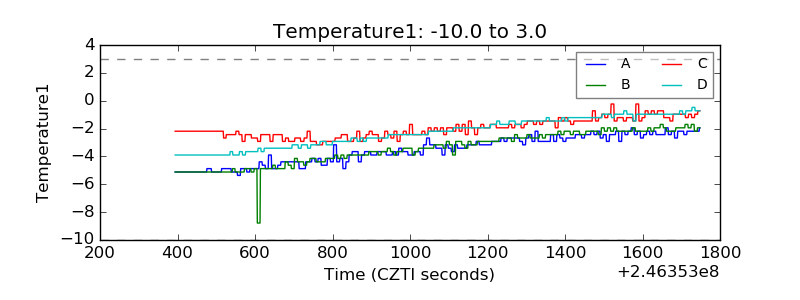 |
| Veto HV Monitor | 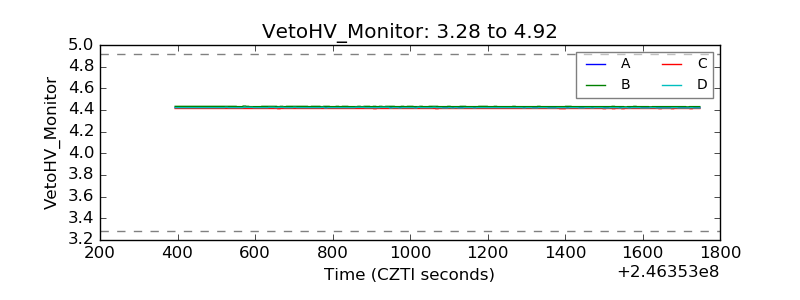 |
| Veto LLD |  |
| Alpha Counter | 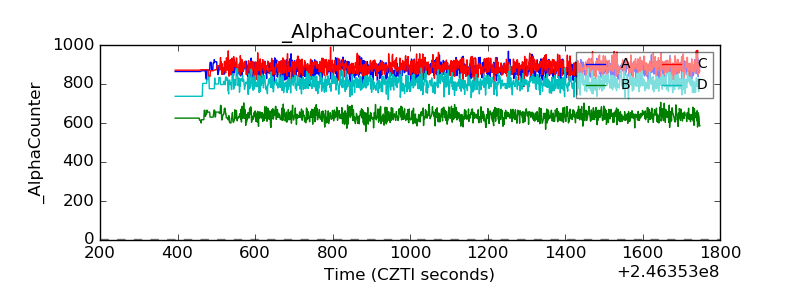 |
| _CPM_Rate | 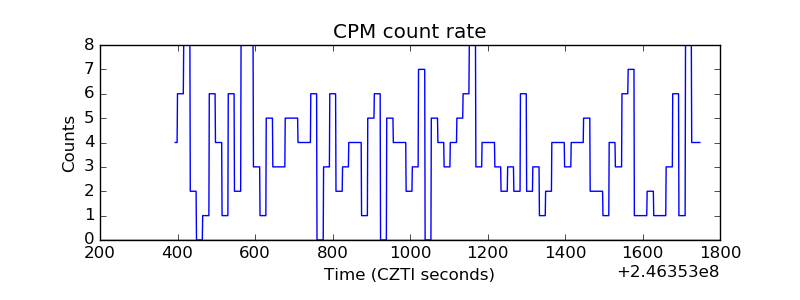 |
| CZT Counter | 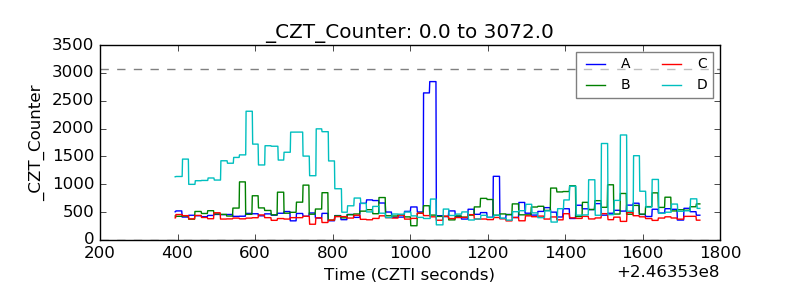 |
| +2.5 Volts monitor |  |
| +5 Volts monitor |  |
| _ROLL_ROT | 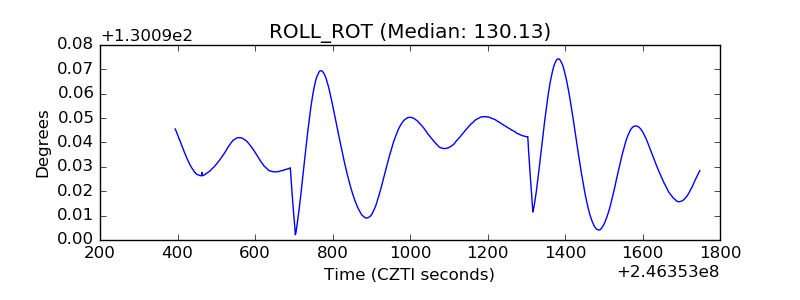 |
| _Roll_DEC | 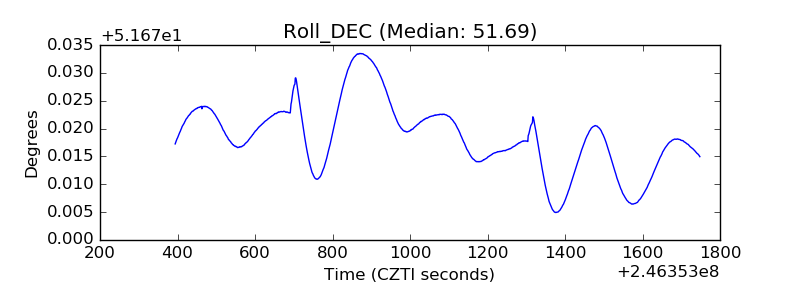 |
| _Roll_RA | 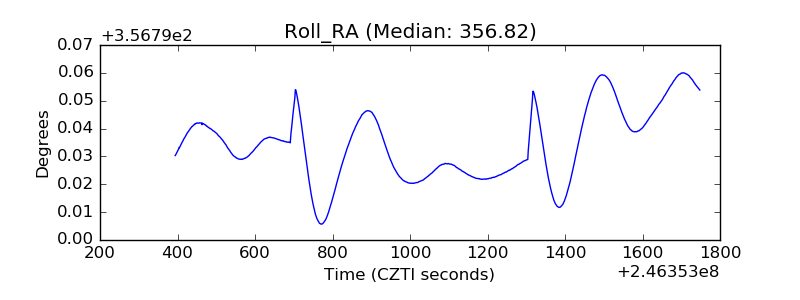 |
| Veto Counter | 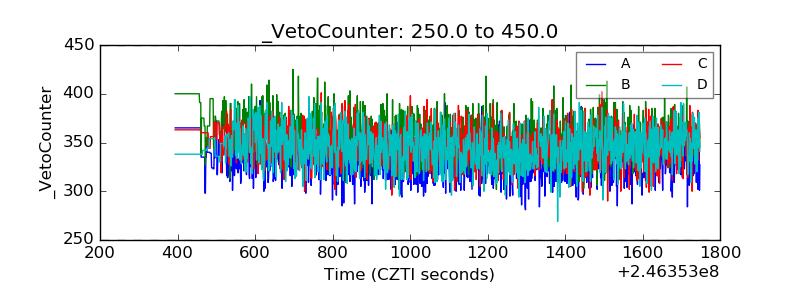 |