| Param | Original file | Final file |
|---|---|---|
| Filename | modeM0/AS1A04_171T01_9000001634_11179cztM0_level2.evt | modeM0/AS1A04_171T01_9000001634_11179cztM0_level2_quad_clean.evt |
| Size (bytes) | 868,559,040 | 111,934,080 |
| Size | 828.3 MB | 106.7 MB |
| Events in quadrant A | 7,096,246 | 681,115 |
| Events in quadrant B | 6,545,871 | 682,219 |
| Events in quadrant C | 4,687,658 | 698,254 |
| Events in quadrant D | 7,317,394 | 654,281 |
| Mode SS | |||
|---|---|---|---|
| Quadrant | BADHDUFLAG | Total packets | Discarded packets |
| A | 0 | 206 | 10 |
| B | 0 | 206 | 12 |
| C | 0 | 206 | 8 |
| D | 0 | 206 | 8 |
| Mode M0 | |||
|---|---|---|---|
| Quadrant | BADHDUFLAG | Total packets | Discarded packets |
| A | 0 | 29737 | 1849 |
| B | 0 | 27254 | 1512 |
| C | 0 | 22001 | 964 |
| D | 0 | 30358 | 2174 |
| Quadrant | Total seconds | Saturated seconds | Saturation percentage |
|---|---|---|---|
| A | 9669 | 795 | 8.222153% |
| B | 9714 | 1034 | 10.644431% |
| C | 9782 | 546 | 5.581681% |
| D | 9652 | 920 | 9.531703% |
Noise dominated data is calculated using 1-second bins in cleaned event files. If a bin has >2000 counts, and if more than 50% of those come from <1% of pixels, then it is considered to be noise-dominated and hence unusable.
| Quadrant | # 1 sec bins | Bins with >0 counts | Bins with >2000 counts | High rate bins dominated by noise | Noise dominated (total time) | Noise dominated (detector-on time) | Marked lightcurve |
|---|---|---|---|---|---|---|---|
| A | 10336 | 9880 | 51 | 51 | 0.49% | 0.52% | 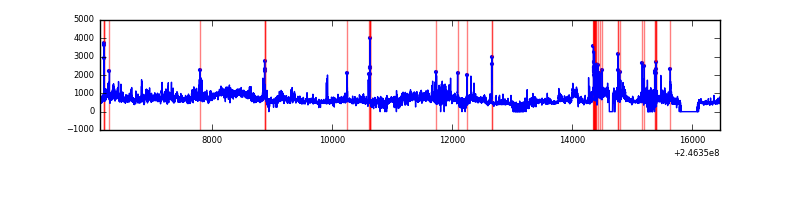 |
| B | 10336 | 9925 | 213 | 213 | 2.06% | 2.15% | 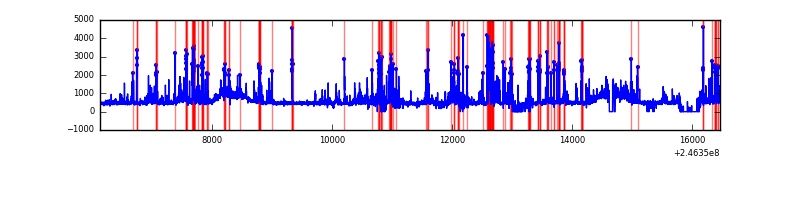 |
| C | 10336 | 9933 | 0 | 0 | 0.00% | 0.00% | 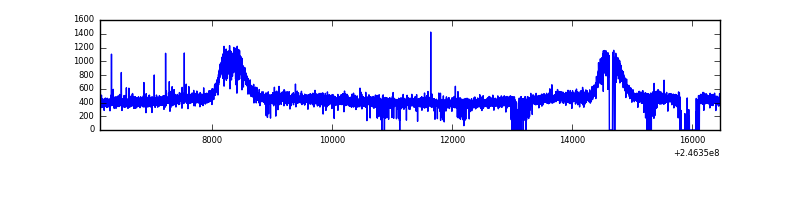 |
| D | 10336 | 9853 | 273 | 273 | 2.64% | 2.77% | 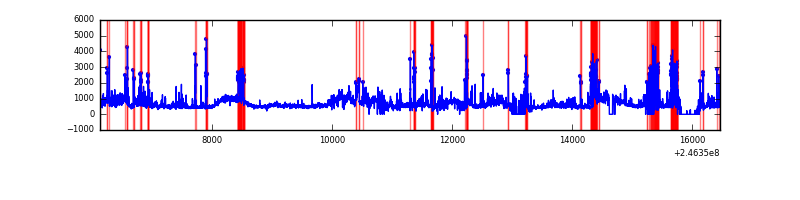 |
Top three noisy pixels from each quadrant. If the there are fewer than three noisy pixels in the level2.evt file, extra rows are filled as -1
| Pixel properties | Quadrant properties | ||||||
|---|---|---|---|---|---|---|---|
| Quadrant | DetID | PixID | Counts | Sigma | Mean | Median | Sigma |
| A | 8 | 15 | 1372678 | 5569.08 | 1190 | 1158 | 246.3 |
| A | 8 | 5 | 993163 | 4028.05 | 1190 | 1158 | 246.3 |
| A | 14 | 238 | 88843 | 356.05 | 1190 | 1158 | 246.3 |
| B | 4 | 239 | 1397881 | 5930.39 | 1193 | 1161 | 235.5 |
| B | 10 | 16 | 156851 | 661.05 | 1193 | 1161 | 235.5 |
| B | 15 | 204 | 95756 | 401.65 | 1193 | 1161 | 235.5 |
| C | 13 | 61 | 9021 | 27.73 | 1200 | 1205 | 281.9 |
| C | 12 | 4 | 3870 | 9.45 | 1200 | 1205 | 281.9 |
| C | 14 | 234 | 3689 | 8.81 | 1200 | 1205 | 281.9 |
| D | 13 | 152 | 725393 | 2574.74 | 1152 | 1116 | 281.3 |
| D | 1 | 52 | 608190 | 2158.09 | 1152 | 1116 | 281.3 |
| D | 2 | 136 | 443328 | 1572.02 | 1152 | 1116 | 281.3 |
Histogram calculated using DETX and DETY for each event in the final _common_clean file
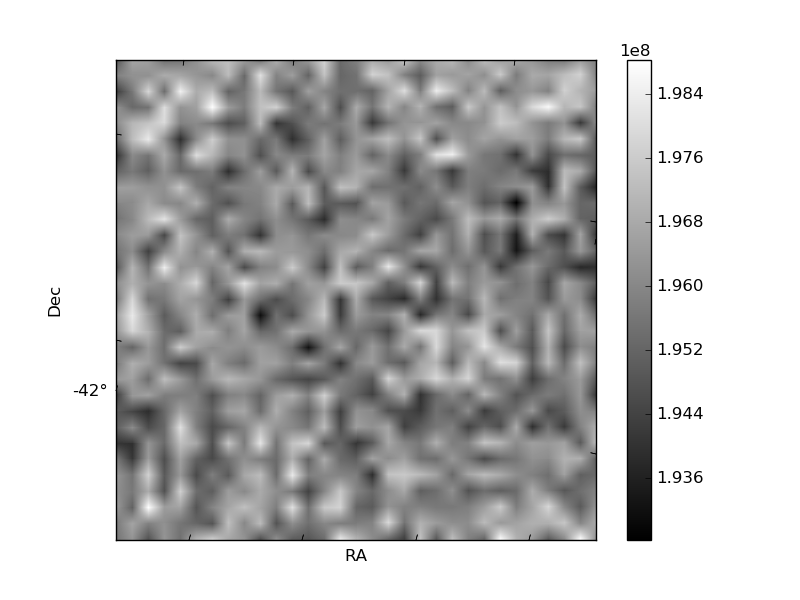
| Quadrant A |  |
 |
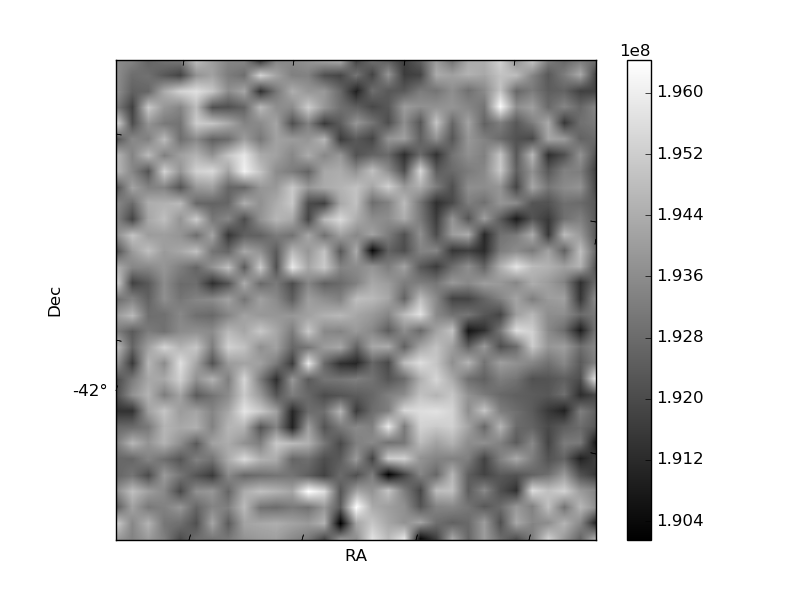
Quadrant B |
|---|---|---|---|
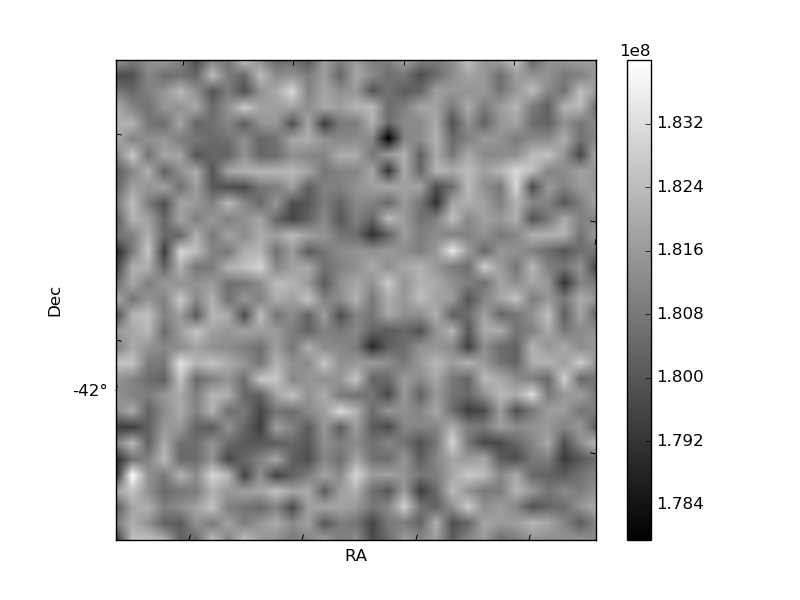
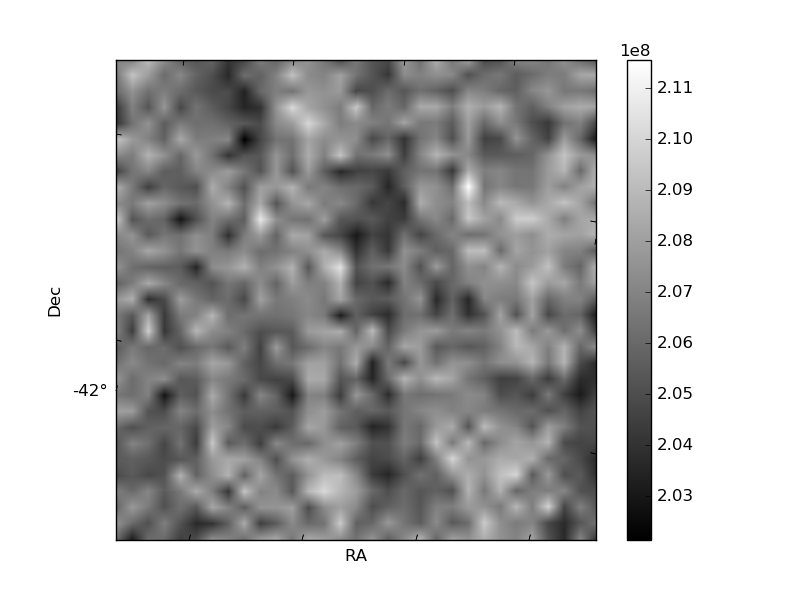
| Quadrant D | 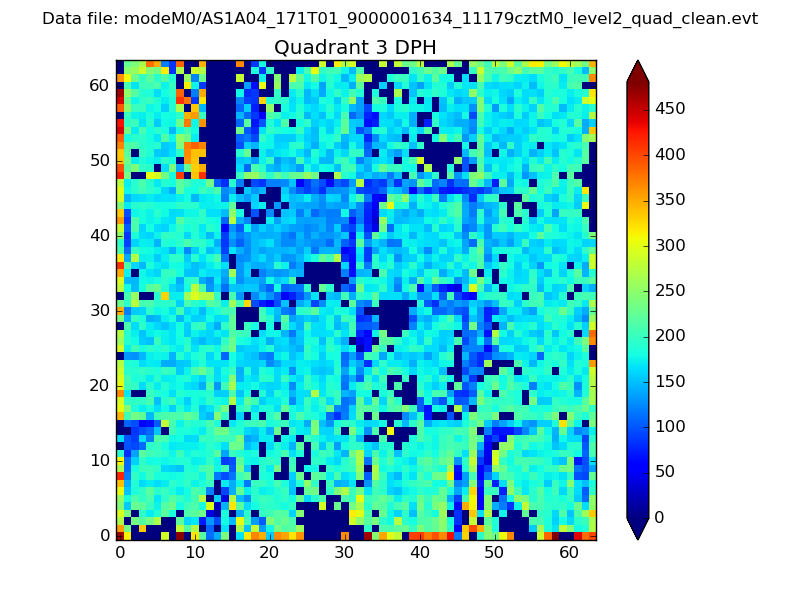 |
 |
Quadrant C |
| Plot type | Count rate plots | Images |
|---|---|---|
| Comparison with Poisson distribution Blue bars denote a histogram of data divided into 1 sec bins. Red curve is a Poisson curve with rate = median count rate of data. |
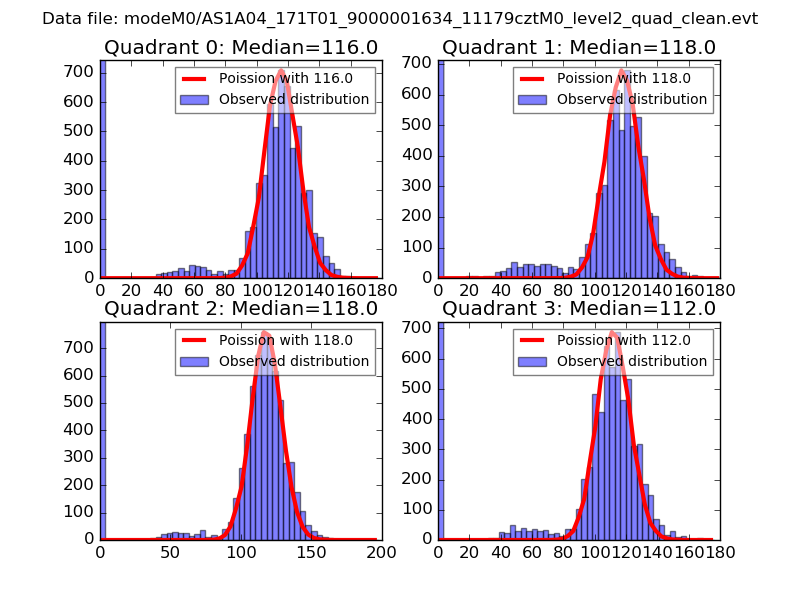 |
 |
| Quadrant-wise count rates Data is divided into 100 sec bins |
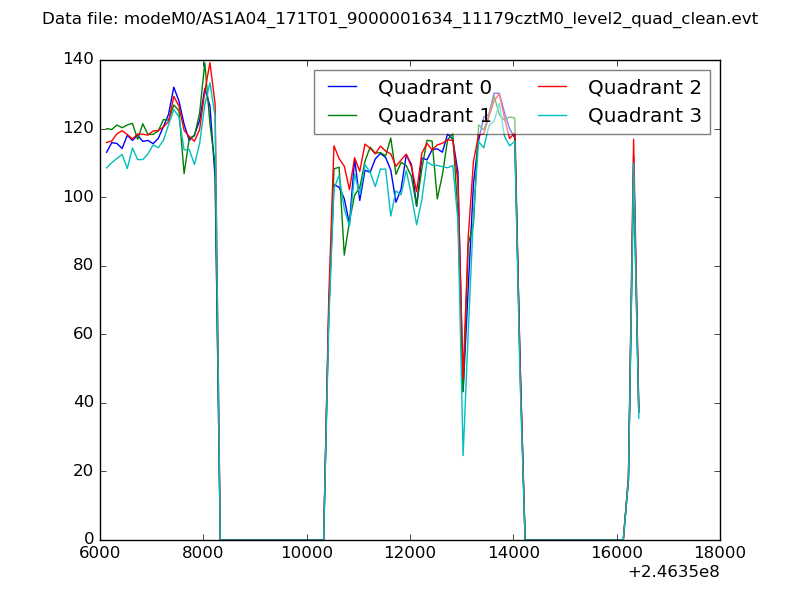 |
|
| Module-wise count rates for Quadrant A Data is divided into 100 sec bins |
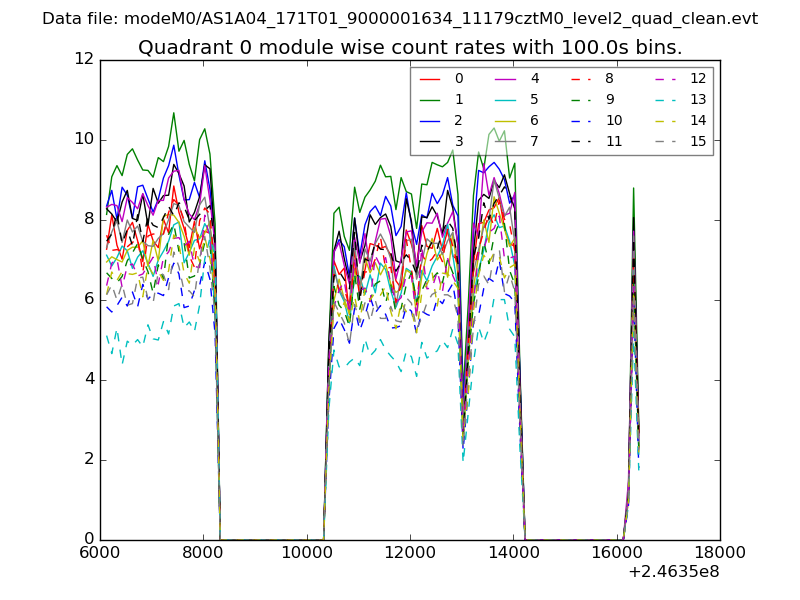 |
 |
| Module-wise count rates for Quadrant B Data is divided into 100 sec bins |
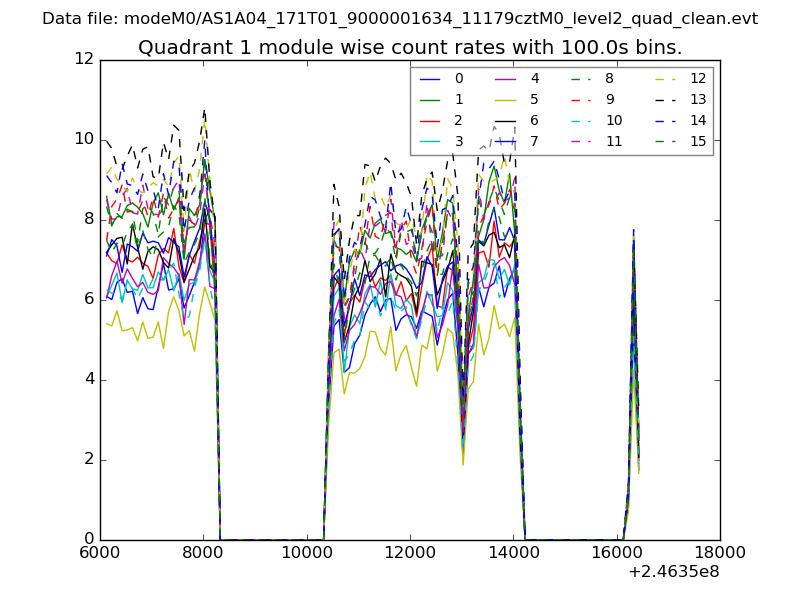 |
 |
| Module-wise count rates for Quadrant C Data is divided into 100 sec bins |
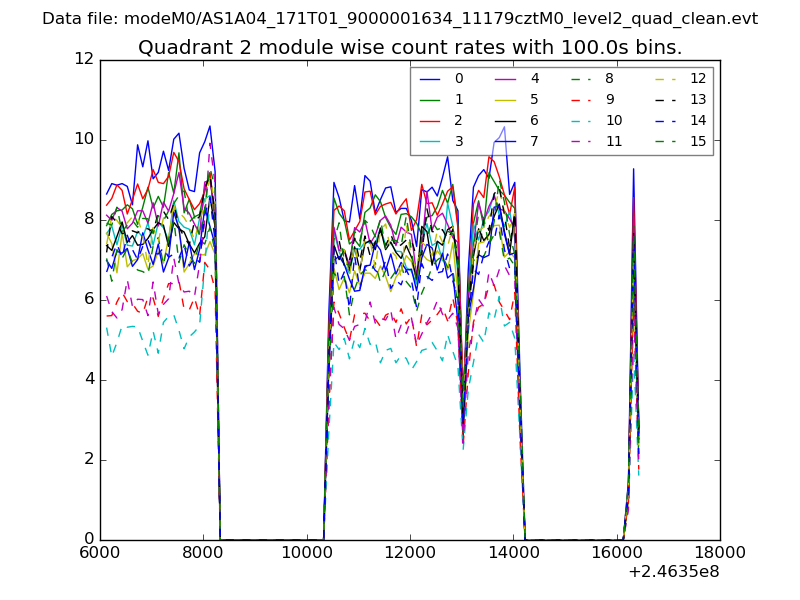 |
 |
| Module-wise count rates for Quadrant D Data is divided into 100 sec bins |
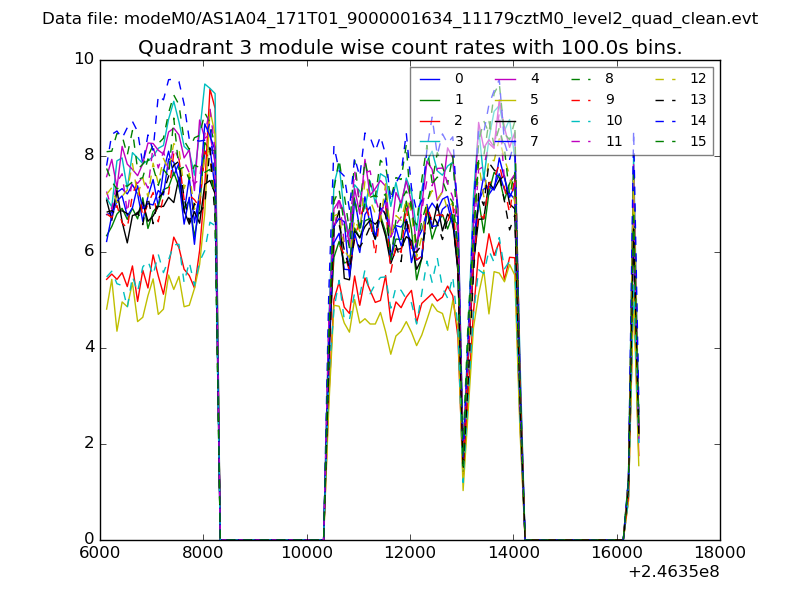 |
 |
| Parameter | Plot |
|---|---|
| CZT HV Monitor | 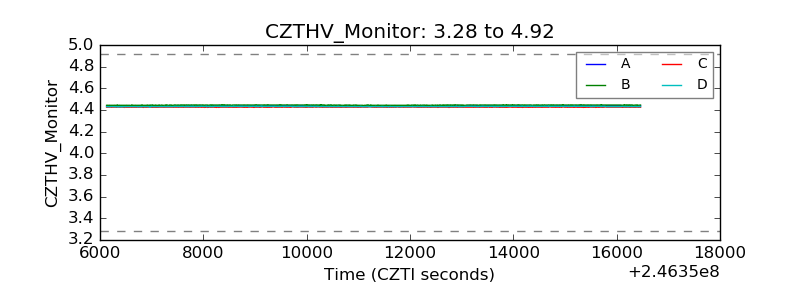 |
| D_VDD | 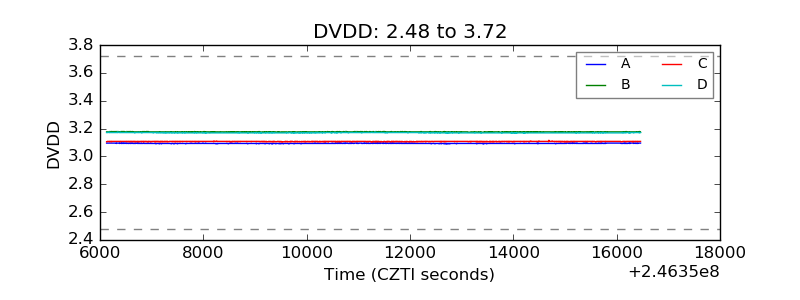 |
| Temperature 1 | 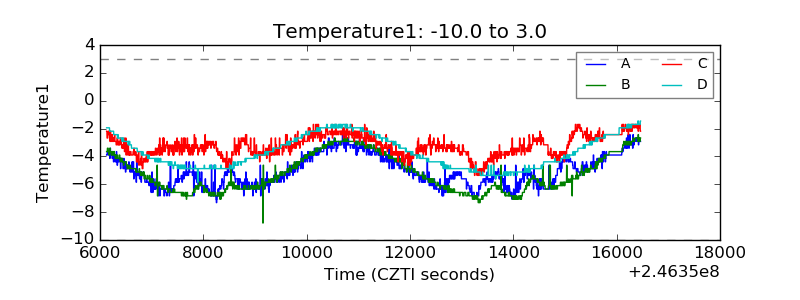 |
| Veto HV Monitor | 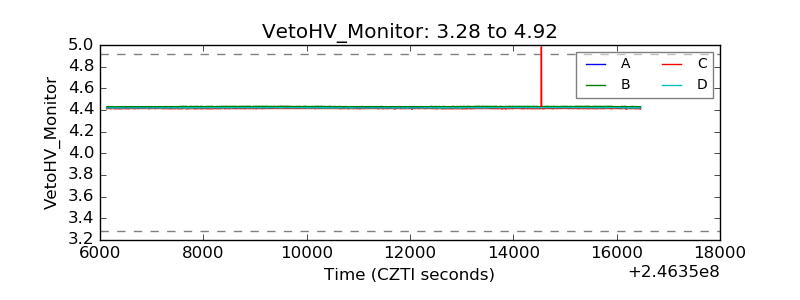 |
| Veto LLD | 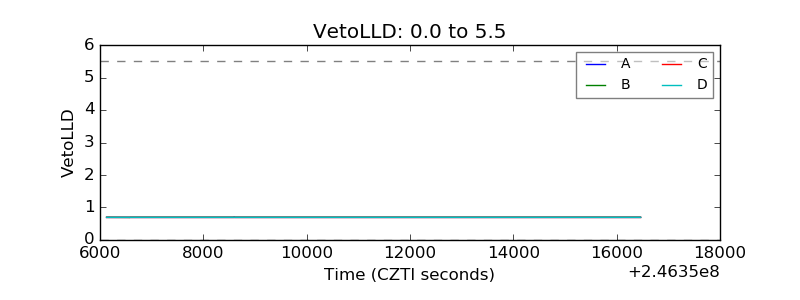 |
| Alpha Counter | 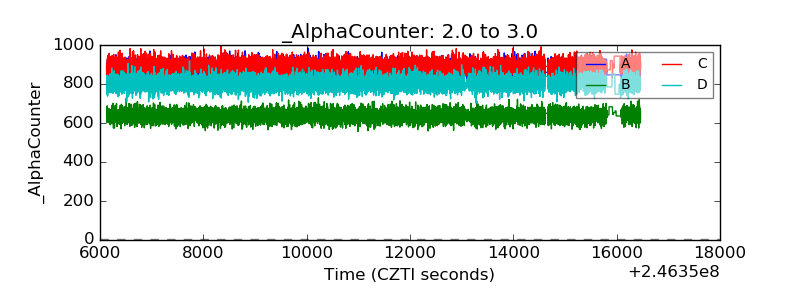 |
| _CPM_Rate | 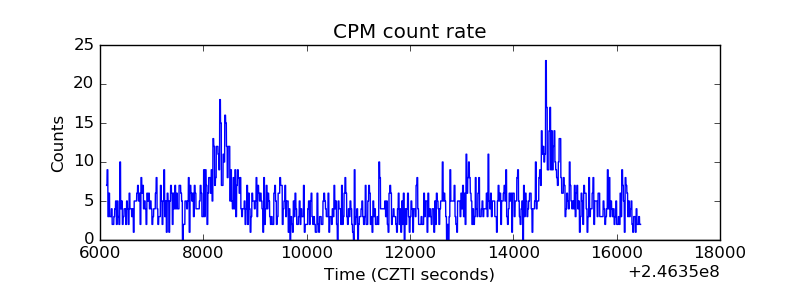 |
| CZT Counter | 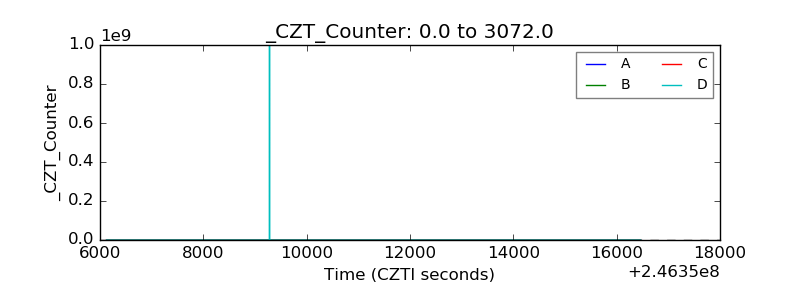 |
| +2.5 Volts monitor |  |
| +5 Volts monitor | 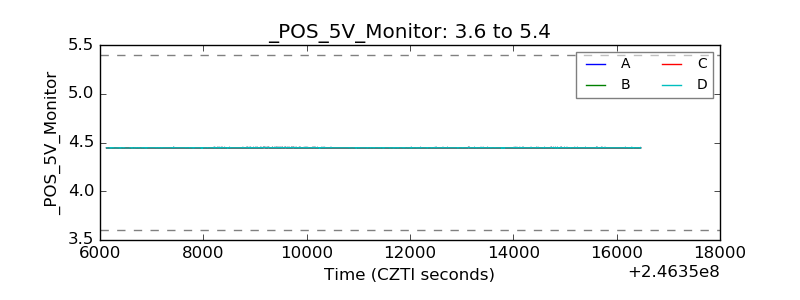 |
| _ROLL_ROT | 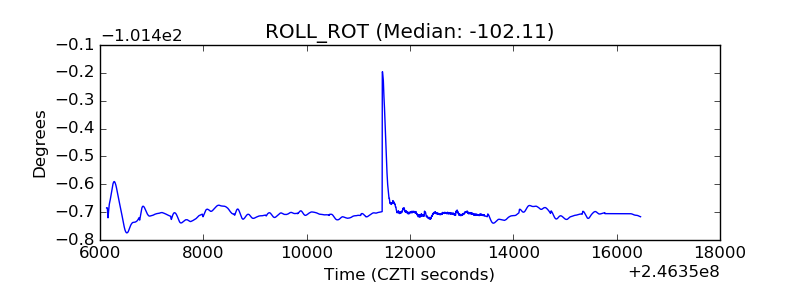 |
| _Roll_DEC | 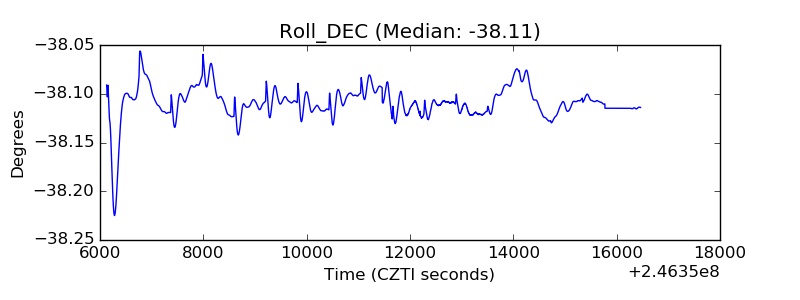 |
| _Roll_RA | 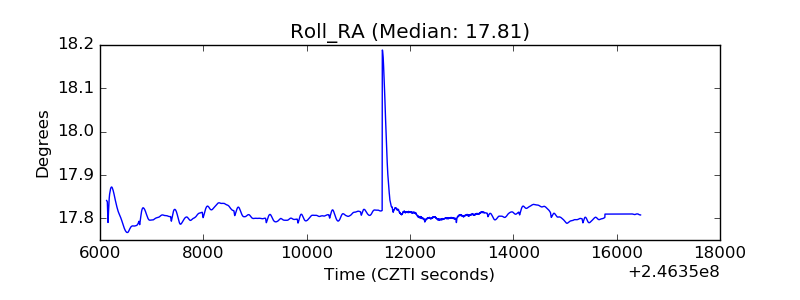 |
| Veto Counter | 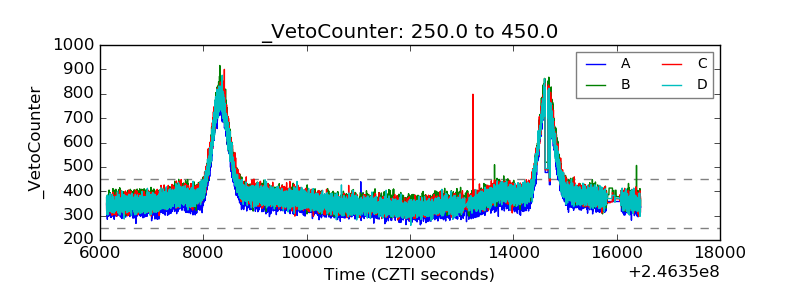 |