| Param | Original file | Final file |
|---|---|---|
| Filename | modeM0/AS1A04_171T01_9000001634_11183cztM0_level2.evt | modeM0/AS1A04_171T01_9000001634_11183cztM0_level2_quad_clean.evt |
| Size (bytes) | 1,745,568,000 | 285,523,200 |
| Size | 1.6 GB | 272.3 MB |
| Events in quadrant A | 13,006,728 | 1,820,494 |
| Events in quadrant B | 13,839,644 | 1,821,012 |
| Events in quadrant C | 9,100,604 | 1,838,813 |
| Events in quadrant D | 15,497,480 | 1,717,161 |
| Mode SS | |||
|---|---|---|---|
| Quadrant | BADHDUFLAG | Total packets | Discarded packets |
| A | 0 | 448 | 22 |
| B | 0 | 448 | 24 |
| C | 0 | 449 | 25 |
| D | 0 | 453 | 27 |
| Mode M0 | |||
|---|---|---|---|
| Quadrant | BADHDUFLAG | Total packets | Discarded packets |
| A | 0 | 55593 | 2640 |
| B | 0 | 58001 | 2697 |
| C | 0 | 45033 | 2269 |
| D | 0 | 63083 | 2495 |
| Mode M9 | |||
|---|---|---|---|
| Quadrant | BADHDUFLAG | Total packets | Discarded packets |
| A | 0 | 25 | 4 |
| B | 0 | 25 | 4 |
| C | 0 | 24 | 3 |
| D | 0 | 23 | 2 |
| Quadrant | Total seconds | Saturated seconds | Saturation percentage |
|---|---|---|---|
| A | 21042 | 719 | 3.416976% |
| B | 21051 | 1223 | 5.809700% |
| C | 21091 | 114 | 0.540515% |
| D | 21072 | 1284 | 6.093394% |
Noise dominated data is calculated using 1-second bins in cleaned event files. If a bin has >2000 counts, and if more than 50% of those come from <1% of pixels, then it is considered to be noise-dominated and hence unusable.
| Quadrant | # 1 sec bins | Bins with >0 counts | Bins with >2000 counts | High rate bins dominated by noise | Noise dominated (total time) | Noise dominated (detector-on time) | Marked lightcurve |
|---|---|---|---|---|---|---|---|
| A | 25309 | 21133 | 349 | 349 | 1.38% | 1.65% | 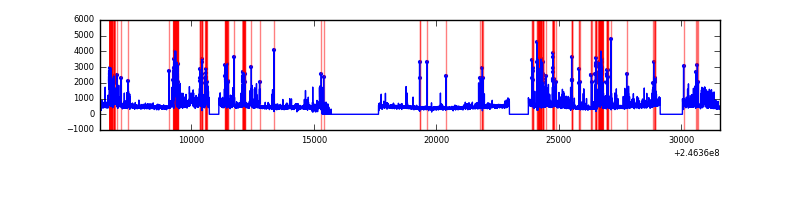 |
| B | 25309 | 21132 | 636 | 636 | 2.51% | 3.01% | 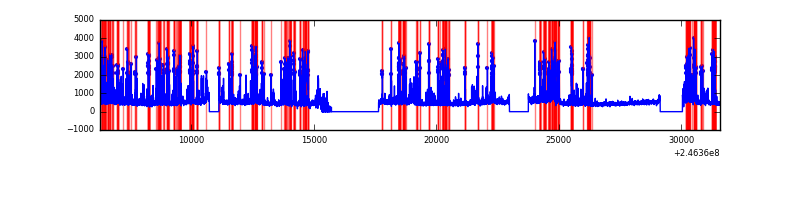 |
| C | 25309 | 21172 | 2 | 2 | 0.01% | 0.01% | 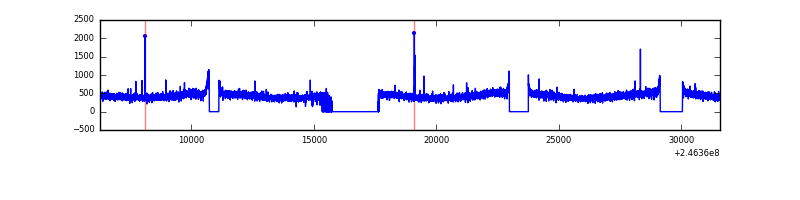 |
| D | 25309 | 21162 | 1187 | 1187 | 4.69% | 5.61% | 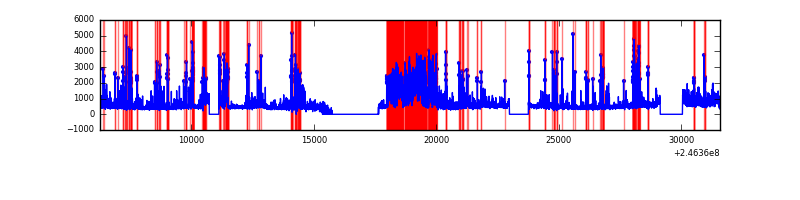 |
Top three noisy pixels from each quadrant. If the there are fewer than three noisy pixels in the level2.evt file, extra rows are filled as -1
| Pixel properties | Quadrant properties | ||||||
|---|---|---|---|---|---|---|---|
| Quadrant | DetID | PixID | Counts | Sigma | Mean | Median | Sigma |
| A | 8 | 5 | 2678520 | 5533.48 | 2375 | 2324 | 483.6 |
| A | 15 | 174 | 405501 | 833.63 | 2375 | 2324 | 483.6 |
| A | 8 | 15 | 329870 | 677.25 | 2375 | 2324 | 483.6 |
| B | 4 | 239 | 3577895 | 7901.16 | 2371 | 2313 | 452.5 |
| B | 15 | 204 | 295011 | 646.79 | 2371 | 2313 | 452.5 |
| B | 11 | 51 | 277590 | 608.29 | 2371 | 2313 | 452.5 |
| C | 13 | 61 | 17089 | 27.33 | 2327 | 2337 | 539.8 |
| C | 12 | 4 | 15663 | 24.69 | 2327 | 2337 | 539.8 |
| C | 14 | 234 | 10068 | 14.32 | 2327 | 2337 | 539.8 |
| D | 10 | 157 | 3771335 | 6889.56 | 2270 | 2205 | 547.1 |
| D | 1 | 52 | 931599 | 1698.83 | 2270 | 2205 | 547.1 |
| D | 10 | 253 | 647697 | 1179.89 | 2270 | 2205 | 547.1 |
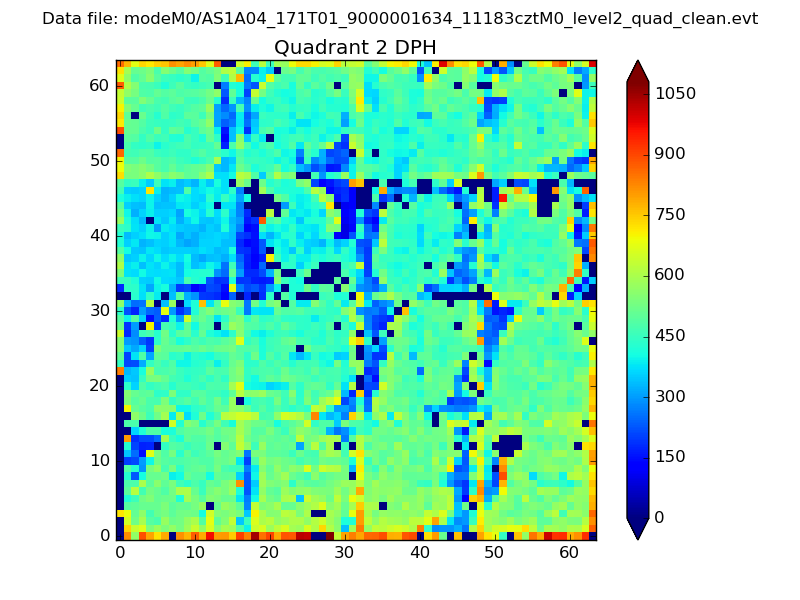
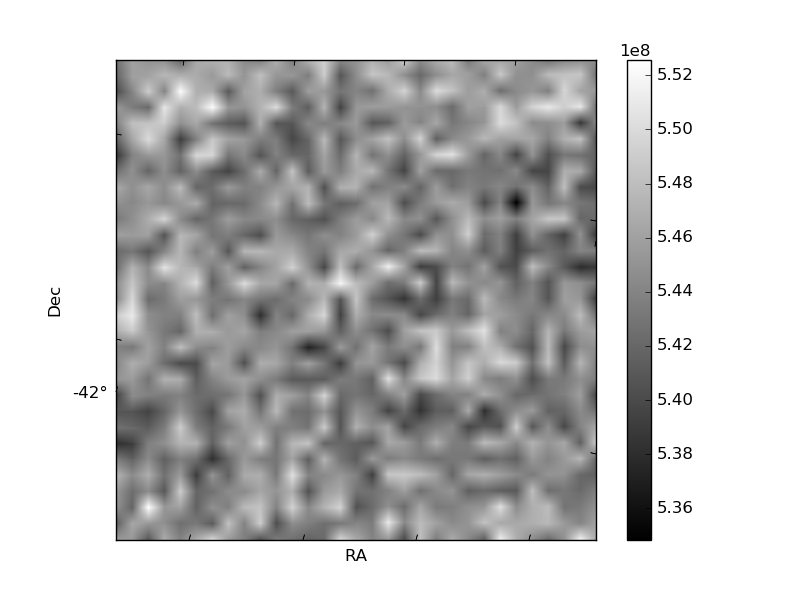
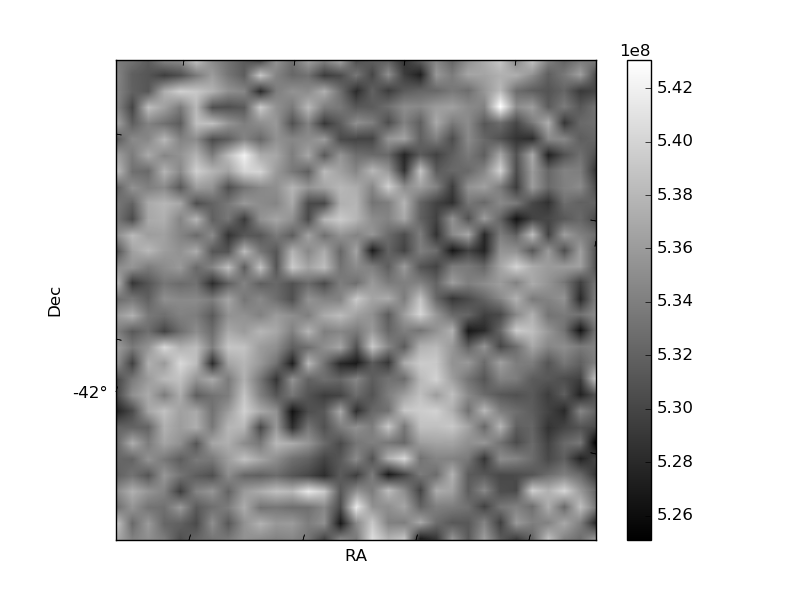
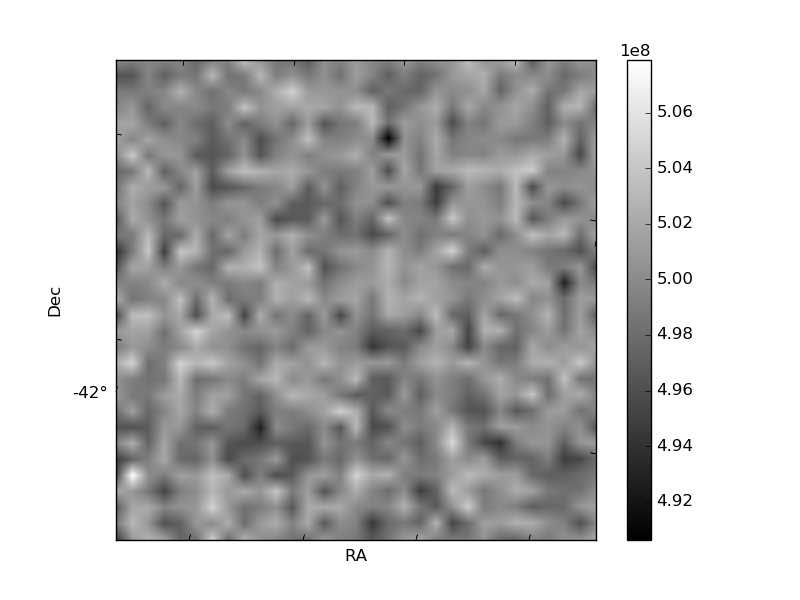
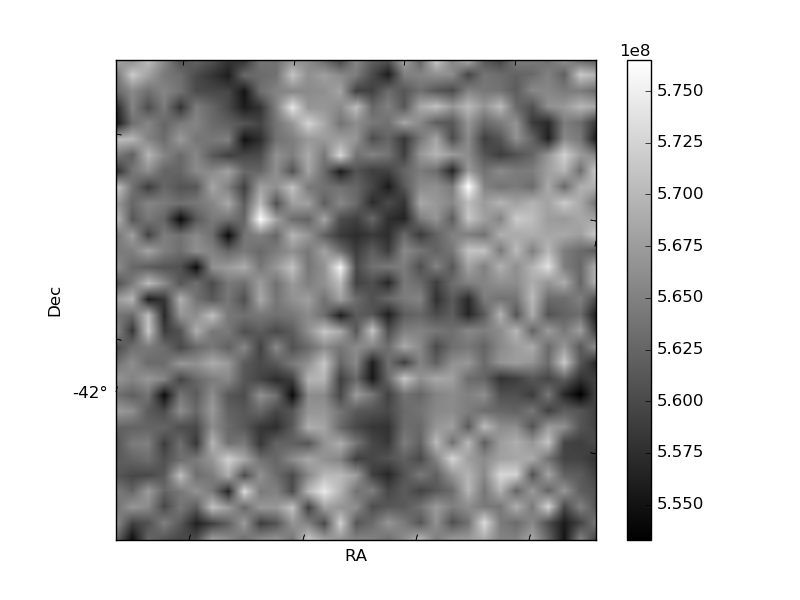
Histogram calculated using DETX and DETY for each event in the final _common_clean file
| Quadrant A | 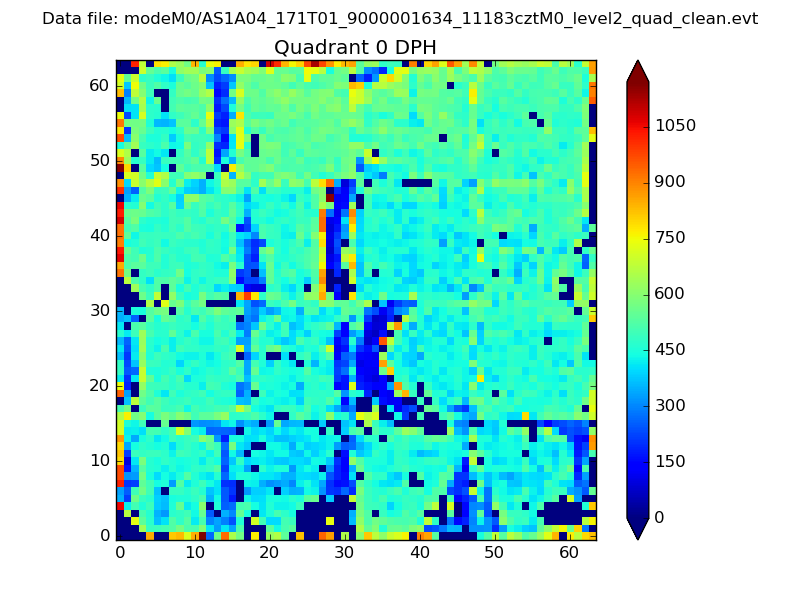 |
 |
Quadrant B |
|---|---|---|---|
| Quadrant D |  |
 |
Quadrant C |
| Plot type | Count rate plots | Images |
|---|---|---|
| Comparison with Poisson distribution Blue bars denote a histogram of data divided into 1 sec bins. Red curve is a Poisson curve with rate = median count rate of data. |
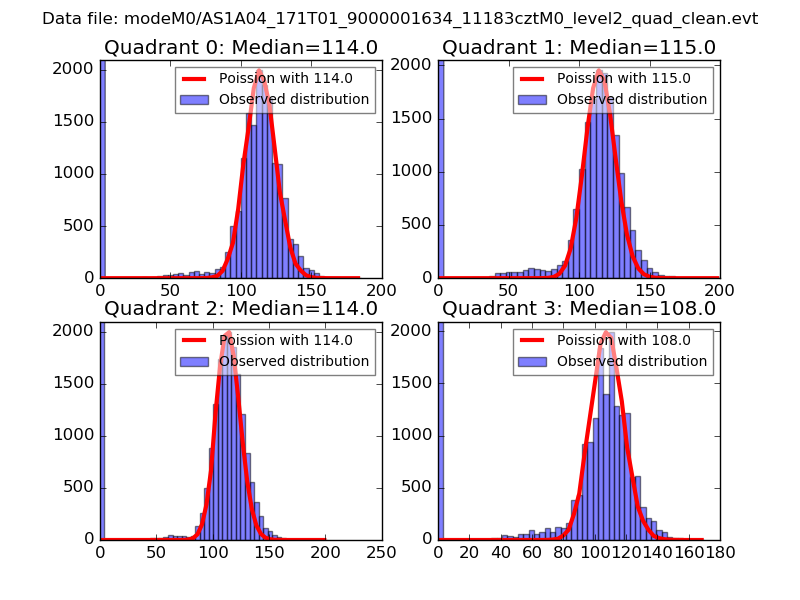 |
 |
| Quadrant-wise count rates Data is divided into 100 sec bins |
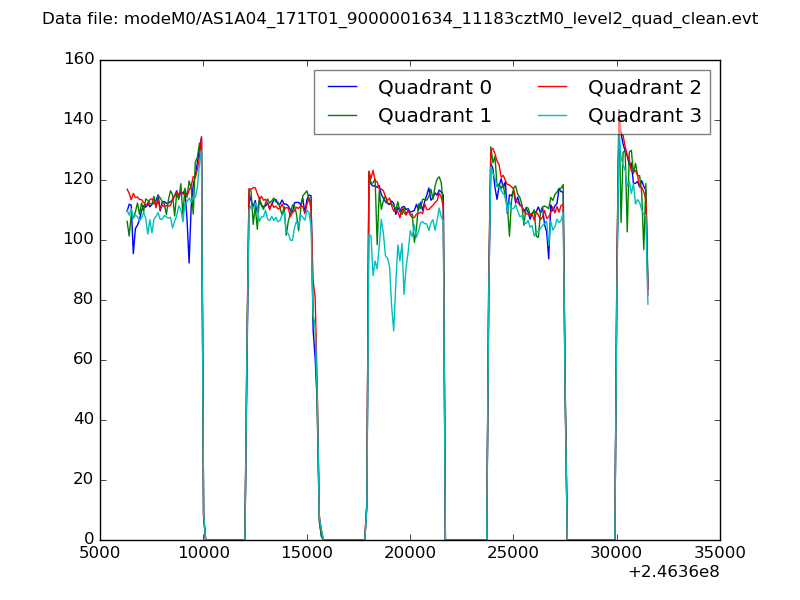 |
|
| Module-wise count rates for Quadrant A Data is divided into 100 sec bins |
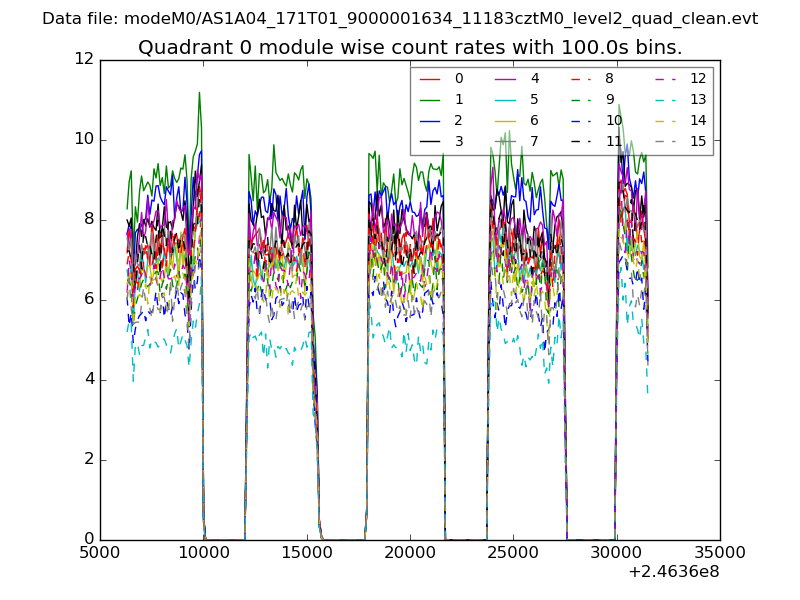 |
 |
| Module-wise count rates for Quadrant B Data is divided into 100 sec bins |
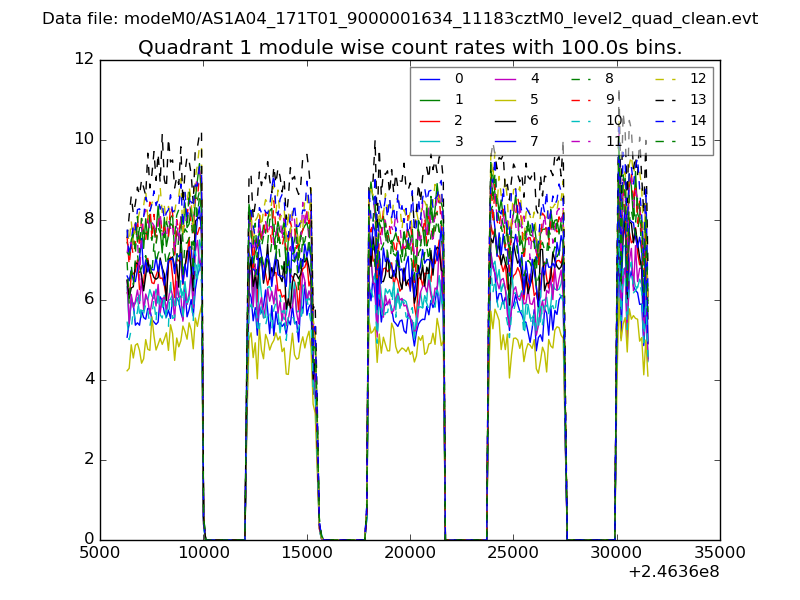 |
 |
| Module-wise count rates for Quadrant C Data is divided into 100 sec bins |
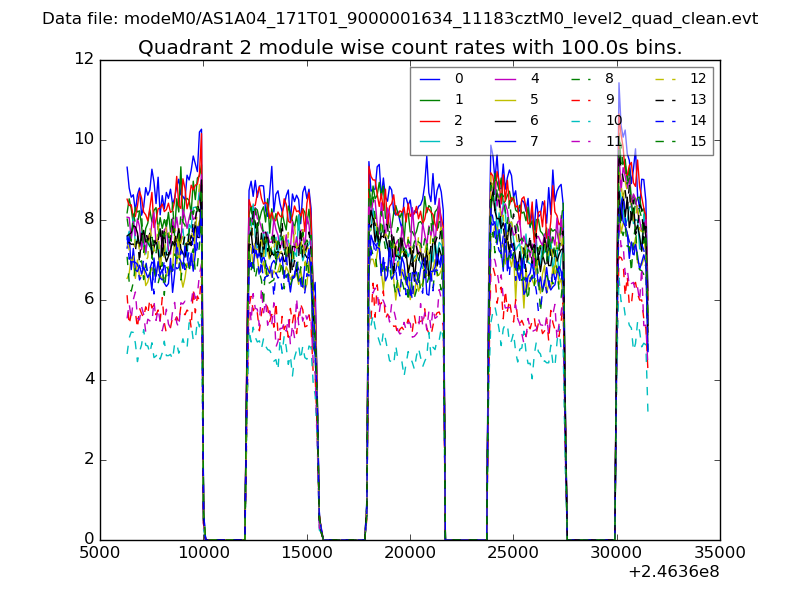 |
 |
| Module-wise count rates for Quadrant D Data is divided into 100 sec bins |
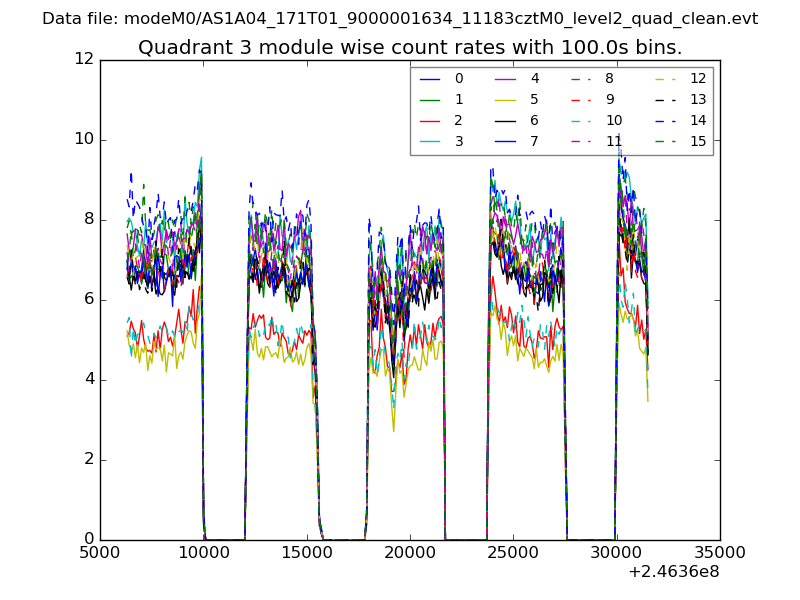 |
 |
| Parameter | Plot |
|---|---|
| CZT HV Monitor |  |
| D_VDD | 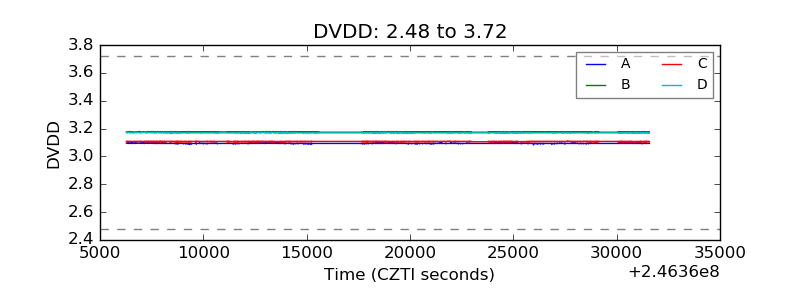 |
| Temperature 1 |  |
| Veto HV Monitor | 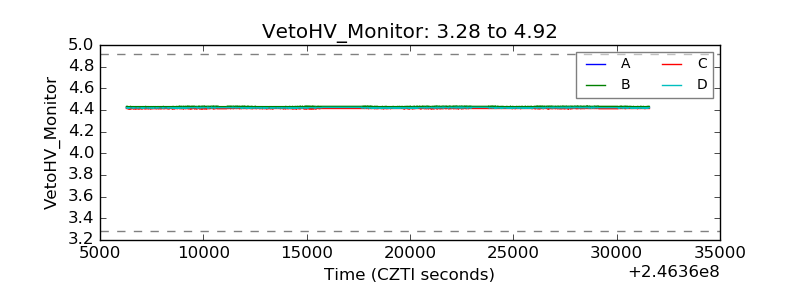 |
| Veto LLD | 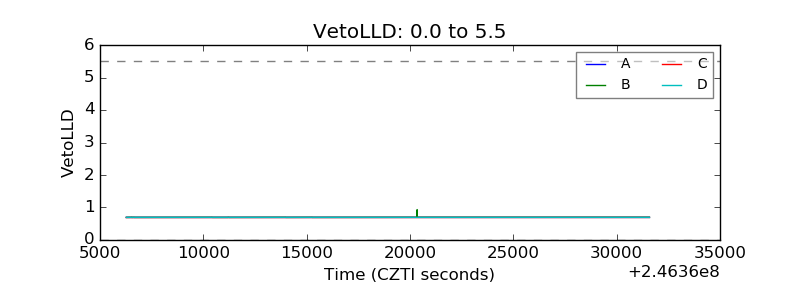 |
| Alpha Counter | 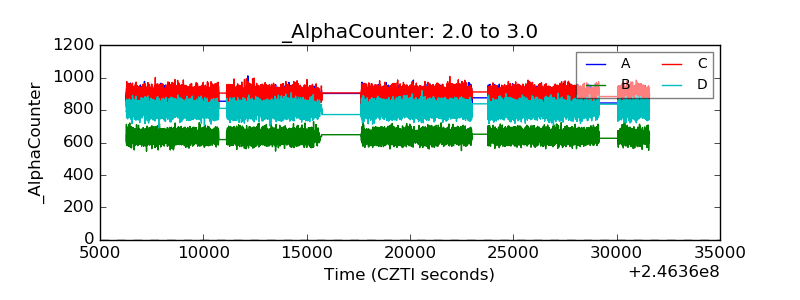 |
| _CPM_Rate | 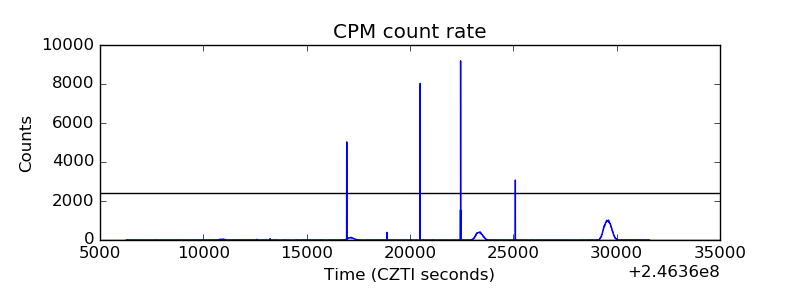 |
| CZT Counter | 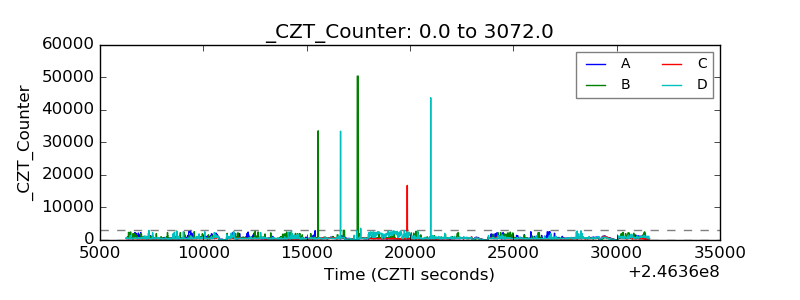 |
| +2.5 Volts monitor |  |
| +5 Volts monitor |  |
| _ROLL_ROT | 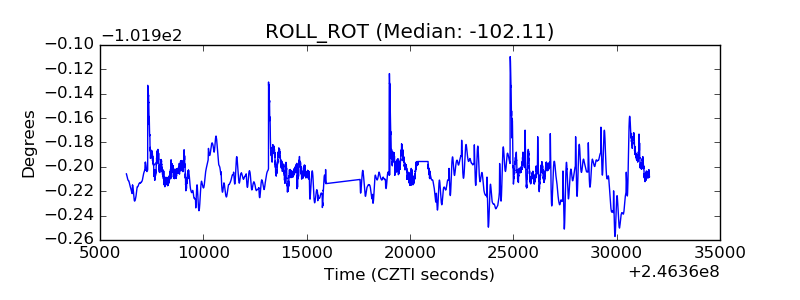 |
| _Roll_DEC | 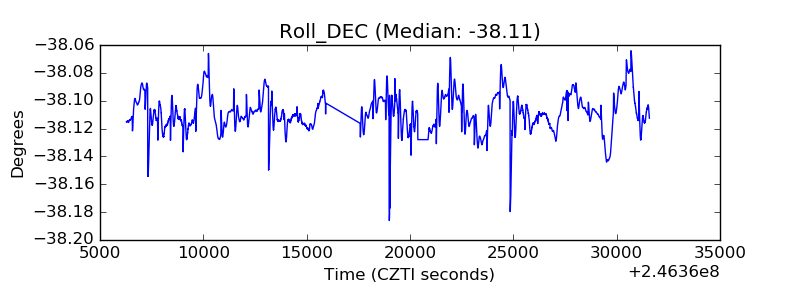 |
| _Roll_RA | 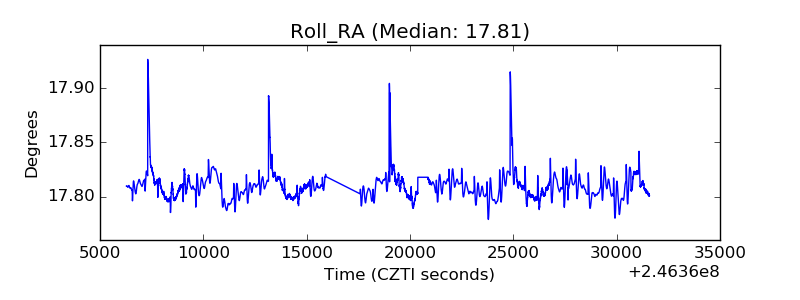 |
| Veto Counter | 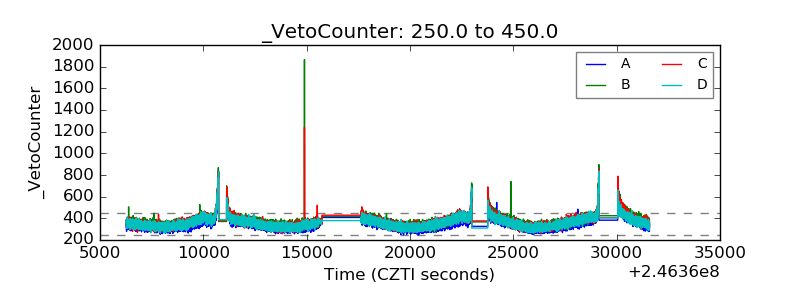 |