| Param | Original file | Final file |
|---|---|---|
| Filename | modeM0/AS1A04_171T01_9000001634_11185cztM0_level2.evt | modeM0/AS1A04_171T01_9000001634_11185cztM0_level2_quad_clean.evt |
| Size (bytes) | 2,289,058,560 | 358,568,640 |
| Size | 2.1 GB | 342.0 MB |
| Events in quadrant A | 17,345,829 | 2,269,894 |
| Events in quadrant B | 18,203,348 | 2,264,886 |
| Events in quadrant C | 12,141,226 | 2,281,031 |
| Events in quadrant D | 19,760,972 | 2,133,551 |
| Mode SS | |||
|---|---|---|---|
| Quadrant | BADHDUFLAG | Total packets | Discarded packets |
| A | 0 | 566 | 0 |
| B | 0 | 566 | 0 |
| C | 0 | 566 | 0 |
| D | 0 | 566 | 0 |
| Mode M0 | |||
|---|---|---|---|
| Quadrant | BADHDUFLAG | Total packets | Discarded packets |
| A | 0 | 70425 | 35 |
| B | 0 | 72684 | 30 |
| C | 0 | 56457 | 19 |
| D | 0 | 77889 | 37 |
| Mode M9 | |||
|---|---|---|---|
| Quadrant | BADHDUFLAG | Total packets | Discarded packets |
| A | 0 | 38 | 0 |
| B | 0 | 38 | 0 |
| C | 0 | 38 | 0 |
| D | 0 | 38 | 0 |
| Quadrant | Total seconds | Saturated seconds | Saturation percentage |
|---|---|---|---|
| A | 27780 | 1009 | 3.632109% |
| B | 27787 | 1697 | 6.107172% |
| C | 27787 | 173 | 0.622593% |
| D | 27781 | 1574 | 5.665743% |
Noise dominated data is calculated using 1-second bins in cleaned event files. If a bin has >2000 counts, and if more than 50% of those come from <1% of pixels, then it is considered to be noise-dominated and hence unusable.
| Quadrant | # 1 sec bins | Bins with >0 counts | Bins with >2000 counts | High rate bins dominated by noise | Noise dominated (total time) | Noise dominated (detector-on time) | Marked lightcurve |
|---|---|---|---|---|---|---|---|
| A | 31561 | 27796 | 475 | 475 | 1.51% | 1.71% | 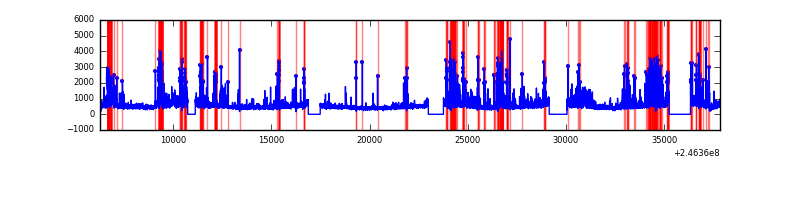 |
| B | 31563 | 27797 | 873 | 873 | 2.77% | 3.14% | 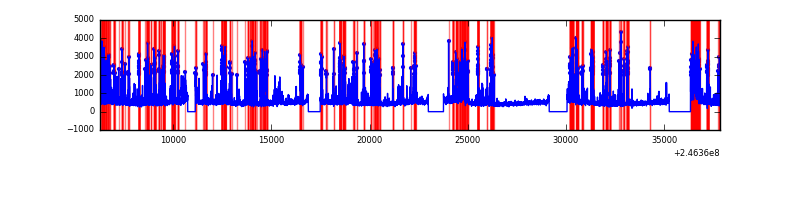 |
| C | 31563 | 27798 | 3 | 3 | 0.01% | 0.01% | 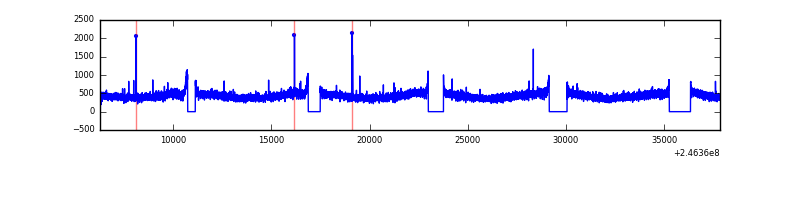 |
| D | 31563 | 27797 | 1378 | 1378 | 4.37% | 4.96% | 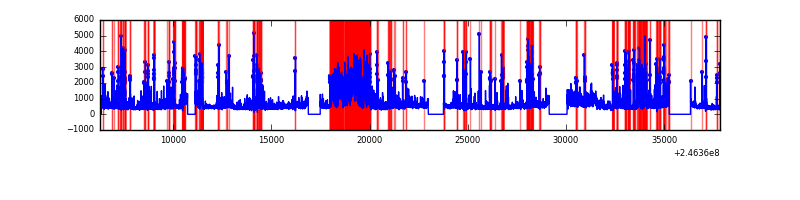 |
Top three noisy pixels from each quadrant. If the there are fewer than three noisy pixels in the level2.evt file, extra rows are filled as -1
| Pixel properties | Quadrant properties | ||||||
|---|---|---|---|---|---|---|---|
| Quadrant | DetID | PixID | Counts | Sigma | Mean | Median | Sigma |
| A | 8 | 5 | 3563404 | 5549.15 | 3164 | 3093 | 641.6 |
| A | 8 | 15 | 631479 | 979.41 | 3164 | 3093 | 641.6 |
| A | 15 | 174 | 407502 | 630.32 | 3164 | 3093 | 641.6 |
| B | 4 | 239 | 4741779 | 7907.52 | 3161 | 3080 | 599.3 |
| B | 15 | 204 | 361417 | 597.96 | 3161 | 3080 | 599.3 |
| B | 11 | 51 | 279166 | 460.71 | 3161 | 3080 | 599.3 |
| C | 13 | 61 | 22981 | 27.59 | 3105 | 3116 | 720.1 |
| C | 14 | 234 | 17125 | 19.45 | 3105 | 3116 | 720.1 |
| C | 12 | 4 | 16981 | 19.25 | 3105 | 3116 | 720.1 |
| D | 10 | 157 | 3927205 | 5420.77 | 3025 | 2940 | 723.9 |
| D | 10 | 253 | 1071227 | 1475.68 | 3025 | 2940 | 723.9 |
| D | 1 | 52 | 1041039 | 1433.97 | 3025 | 2940 | 723.9 |
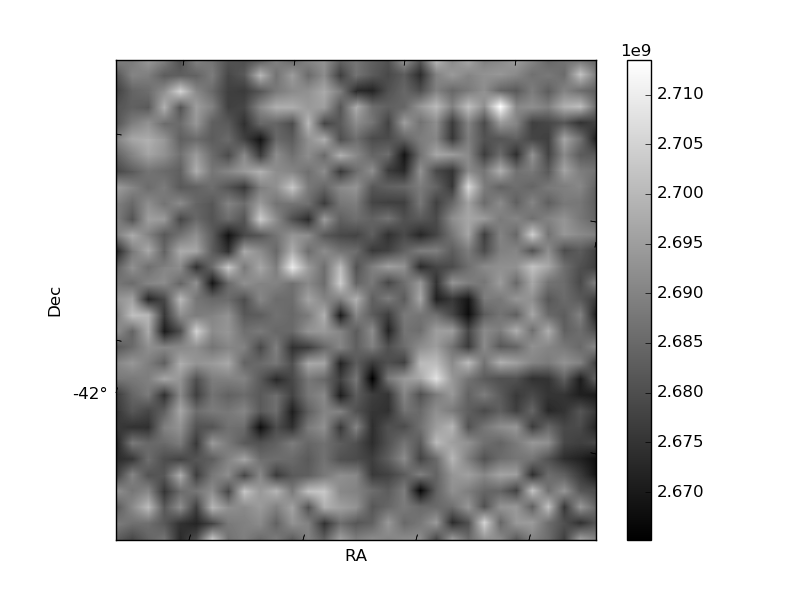
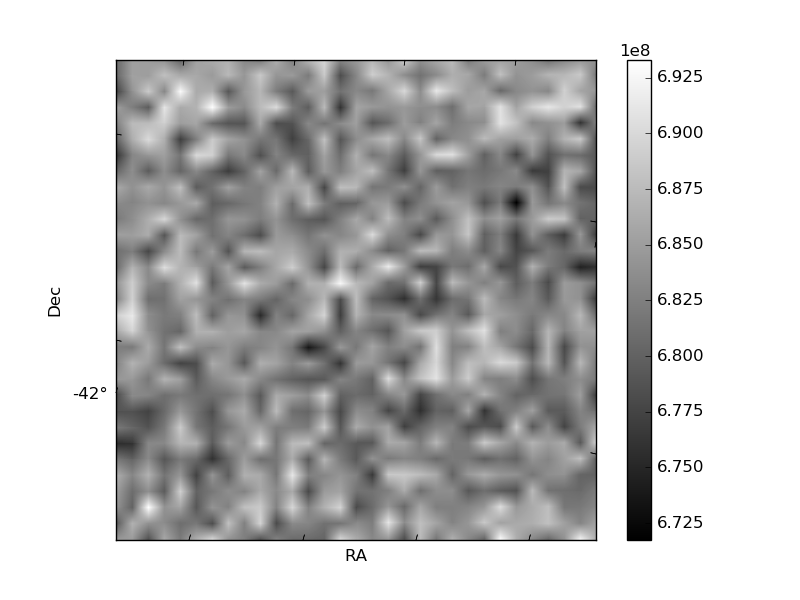
Histogram calculated using DETX and DETY for each event in the final _common_clean file
| Quadrant A | 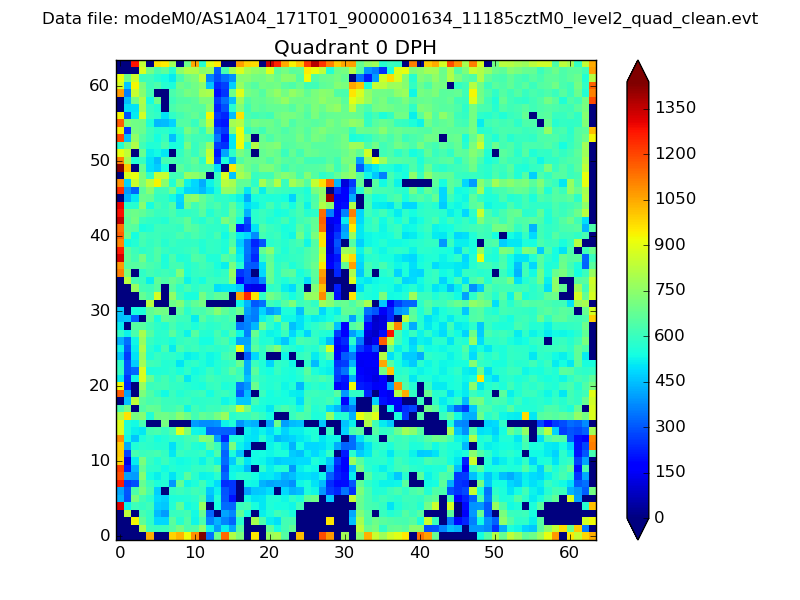 |
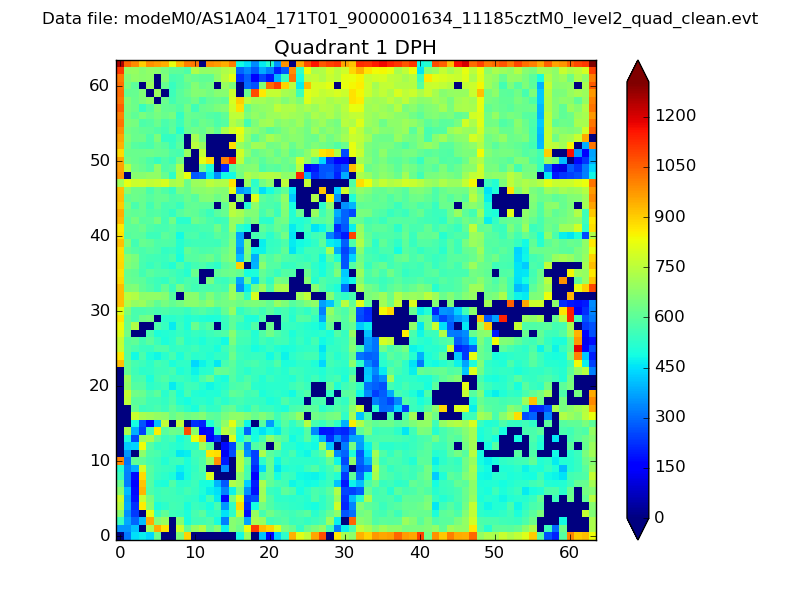 |
Quadrant B |
|---|---|---|---|
| Quadrant D |  |
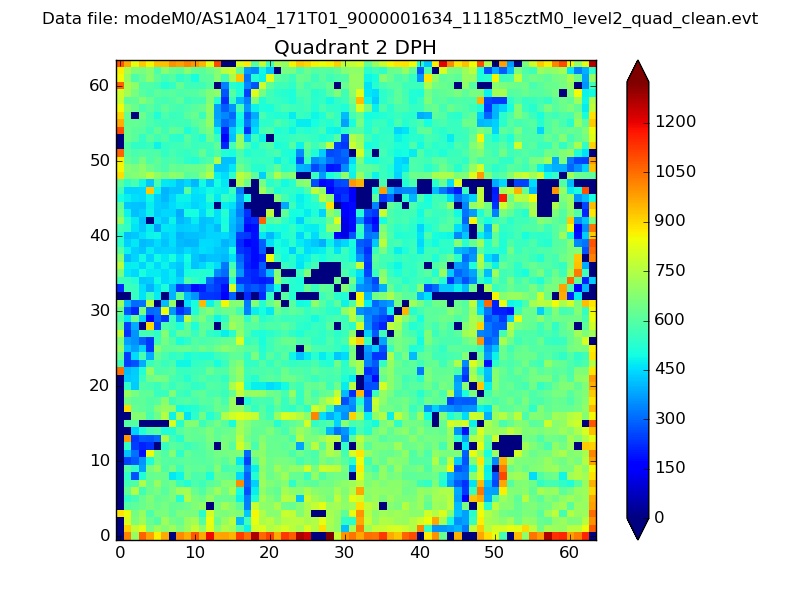 |
Quadrant C |
| Plot type | Count rate plots | Images |
|---|---|---|
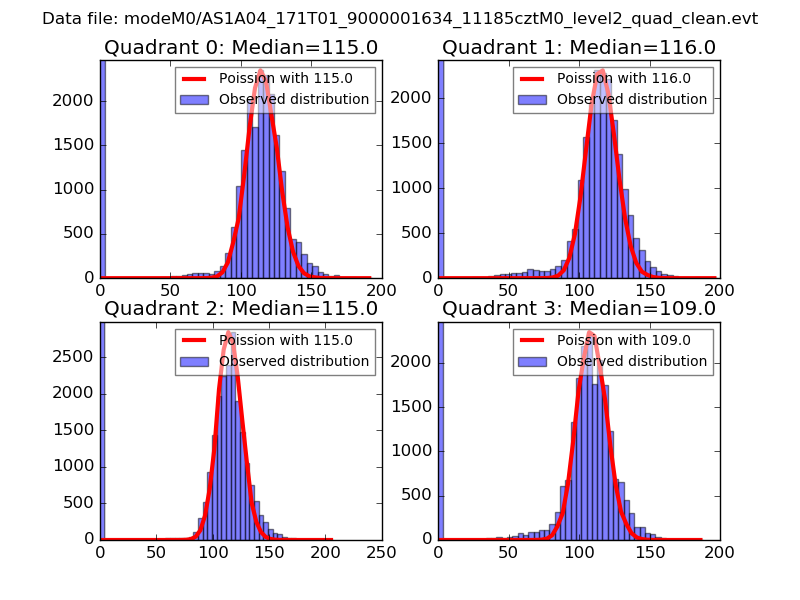
| Comparison with Poisson distribution Blue bars denote a histogram of data divided into 1 sec bins. Red curve is a Poisson curve with rate = median count rate of data. |
 |
 |
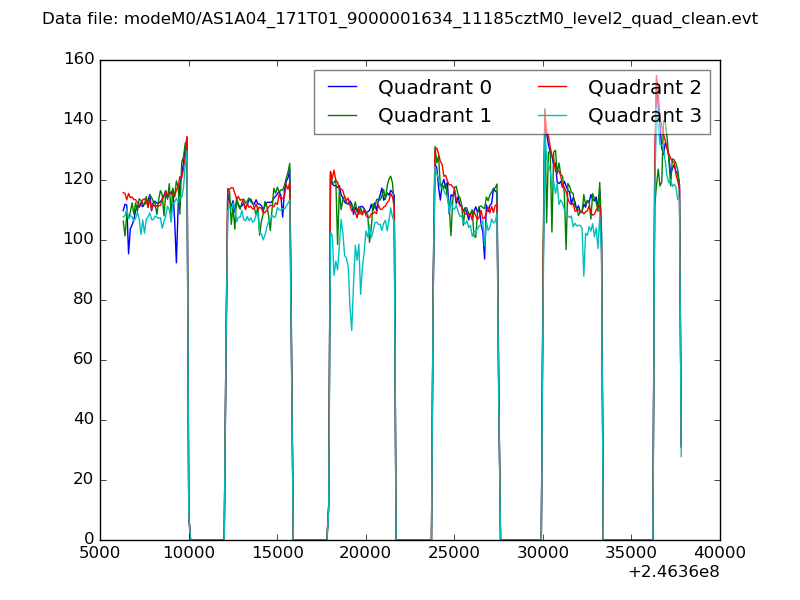
| Quadrant-wise count rates Data is divided into 100 sec bins |
 |
|
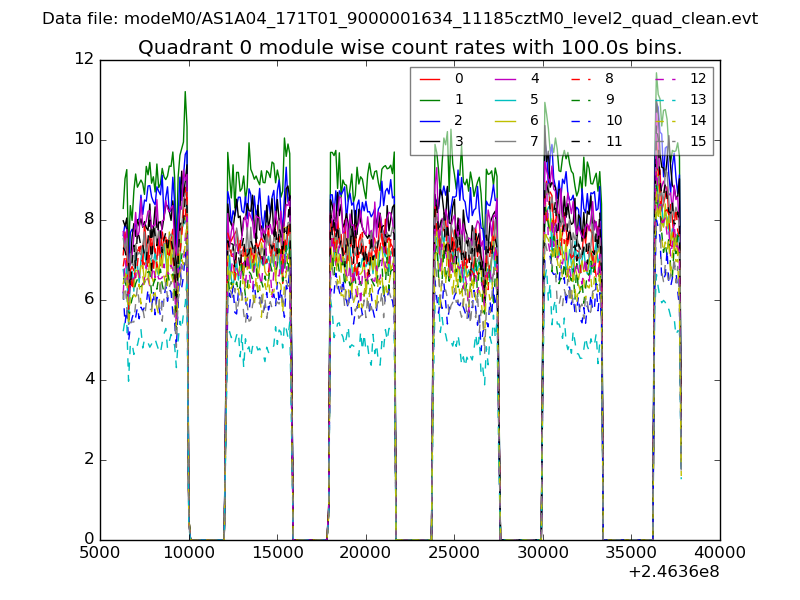
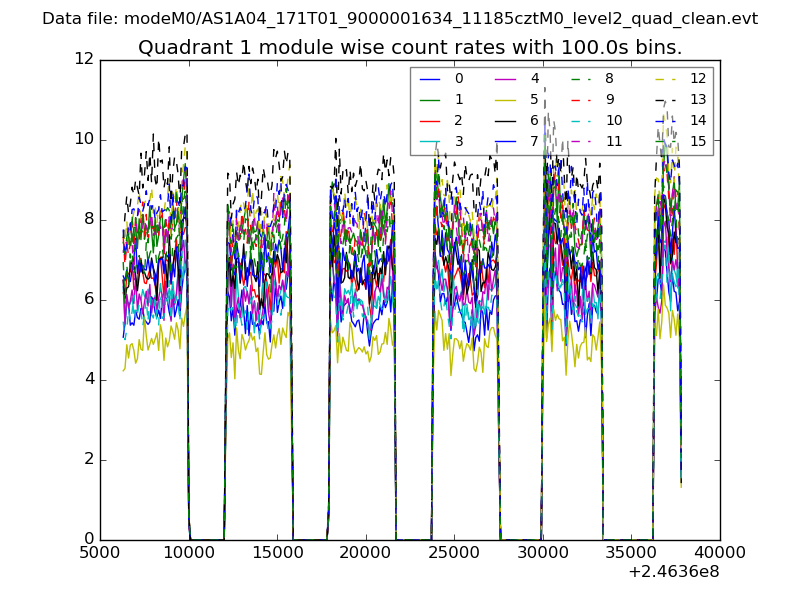
| Module-wise count rates for Quadrant A Data is divided into 100 sec bins |
 |
 |
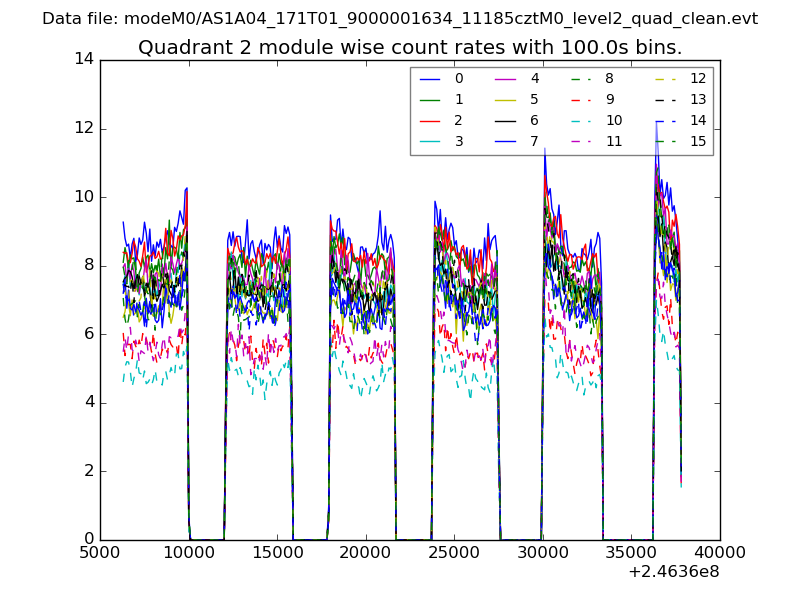
| Module-wise count rates for Quadrant B Data is divided into 100 sec bins |
 |
 |
| Module-wise count rates for Quadrant C Data is divided into 100 sec bins |
 |
 |
| Module-wise count rates for Quadrant D Data is divided into 100 sec bins |
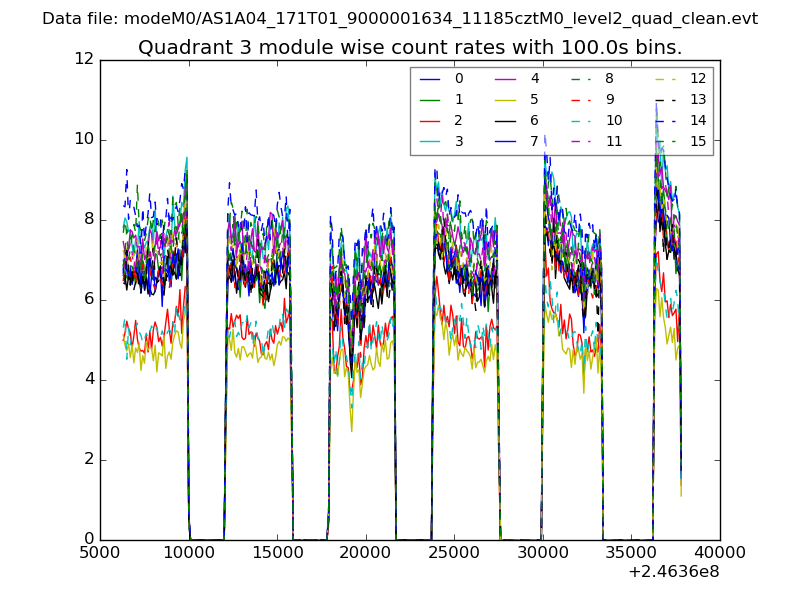 |
 |
| Parameter | Plot |
|---|---|
| CZT HV Monitor | 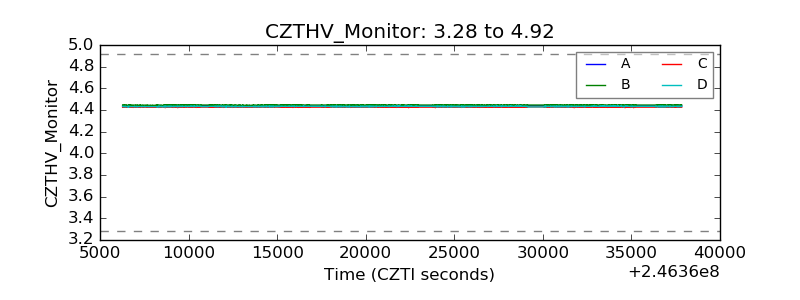 |
| D_VDD | 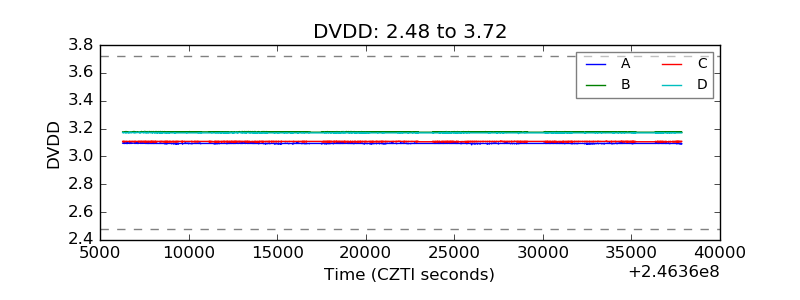 |
| Temperature 1 | 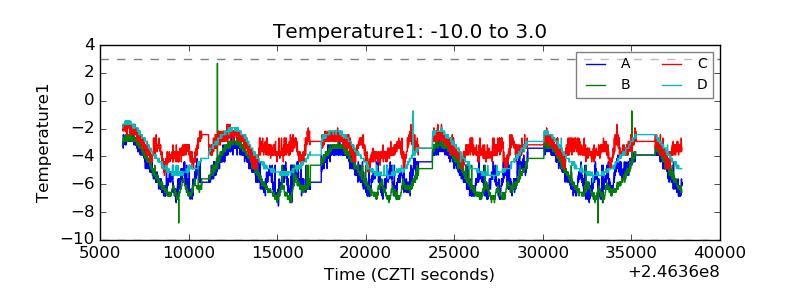 |
| Veto HV Monitor | 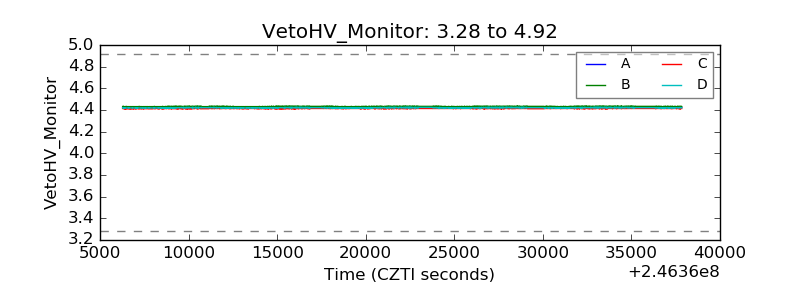 |
| Veto LLD | 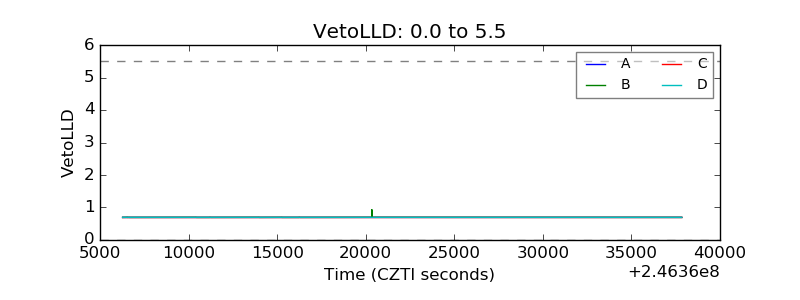 |
| Alpha Counter | 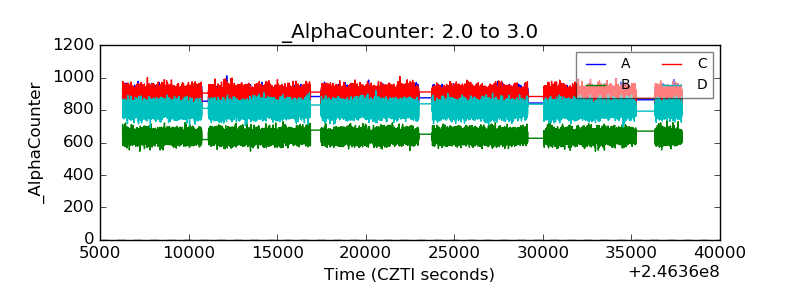 |
| _CPM_Rate | 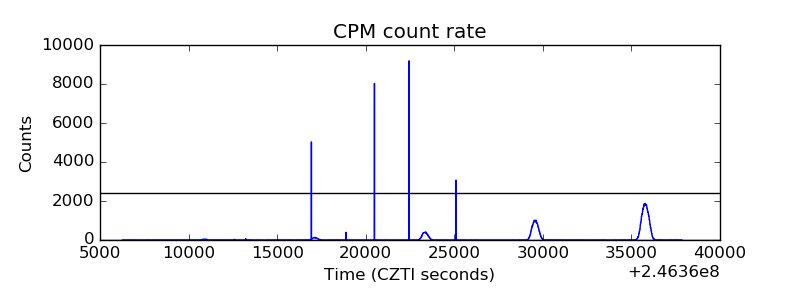 |
| CZT Counter | 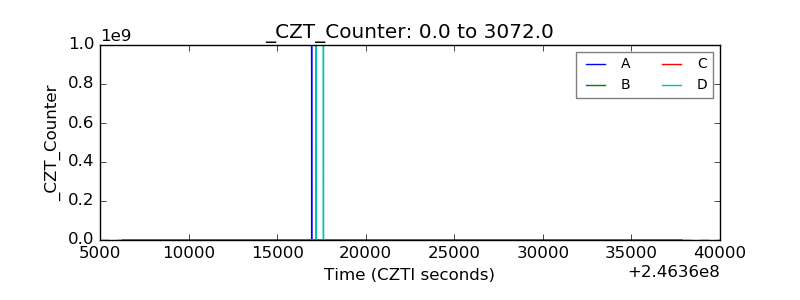 |
| +2.5 Volts monitor |  |
| +5 Volts monitor | 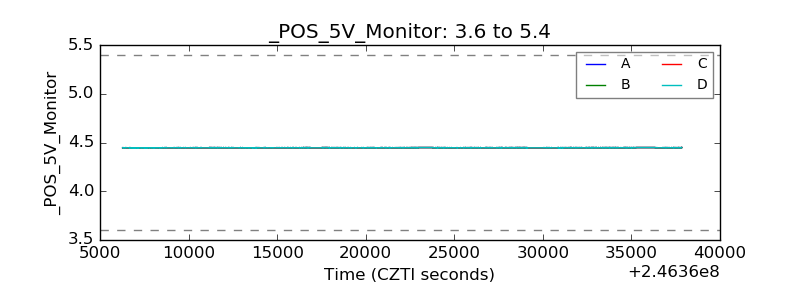 |
| _ROLL_ROT | 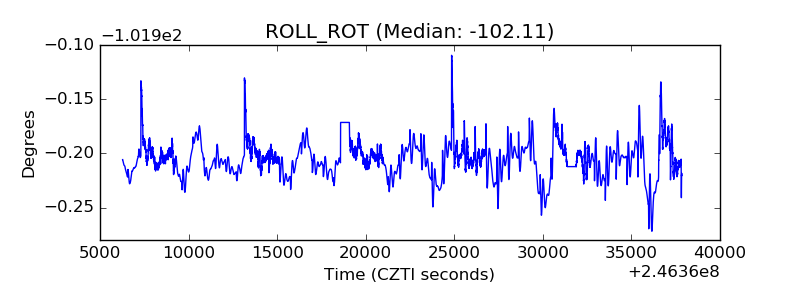 |
| _Roll_DEC | 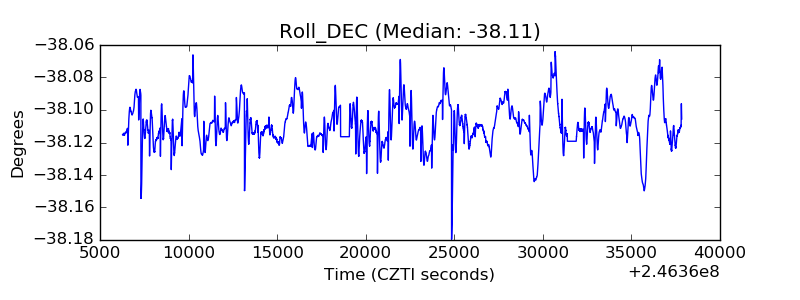 |
| _Roll_RA | 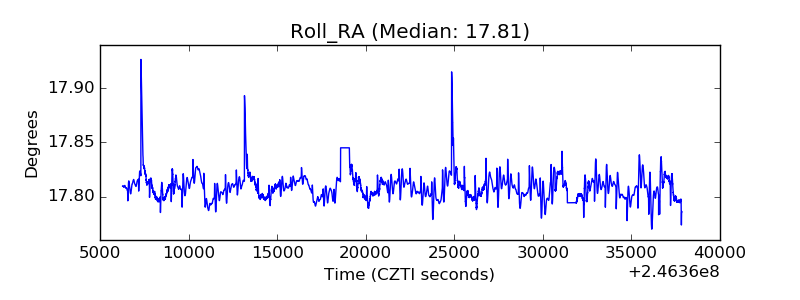 |
| Veto Counter | 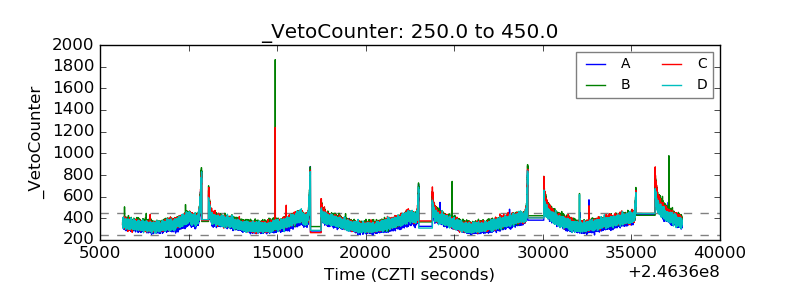 |