| Param | Original file | Final file |
|---|---|---|
| Filename | modeM0/AS1A04_171T01_9000001634_11190cztM0_level2.evt | modeM0/AS1A04_171T01_9000001634_11190cztM0_level2_quad_clean.evt |
| Size (bytes) | 498,196,800 | 82,463,040 |
| Size | 475.1 MB | 78.6 MB |
| Events in quadrant A | 3,713,017 | 512,915 |
| Events in quadrant B | 3,471,544 | 530,382 |
| Events in quadrant C | 3,017,685 | 521,412 |
| Events in quadrant D | 4,448,230 | 482,559 |
| Mode SS | |||
|---|---|---|---|
| Quadrant | BADHDUFLAG | Total packets | Discarded packets |
| A | 0 | 132 | 0 |
| B | 0 | 132 | 0 |
| C | 0 | 132 | 0 |
| D | 0 | 132 | 0 |
| Mode M0 | |||
|---|---|---|---|
| Quadrant | BADHDUFLAG | Total packets | Discarded packets |
| A | 0 | 14980 | 3 |
| B | 0 | 14268 | 2 |
| C | 0 | 13214 | 2 |
| D | 0 | 17528 | 2 |
| Mode M9 | |||
|---|---|---|---|
| Quadrant | BADHDUFLAG | Total packets | Discarded packets |
| A | 0 | 16 | 0 |
| B | 0 | 16 | 1 |
| C | 0 | 16 | 1 |
| D | 0 | 17 | 1 |
| Quadrant | Total seconds | Saturated seconds | Saturation percentage |
|---|---|---|---|
| A | 6442 | 113 | 1.754114% |
| B | 6442 | 151 | 2.343993% |
| C | 6442 | 61 | 0.946911% |
| D | 6442 | 291 | 4.517231% |
Noise dominated data is calculated using 1-second bins in cleaned event files. If a bin has >2000 counts, and if more than 50% of those come from <1% of pixels, then it is considered to be noise-dominated and hence unusable.
| Quadrant | # 1 sec bins | Bins with >0 counts | Bins with >2000 counts | High rate bins dominated by noise | Noise dominated (total time) | Noise dominated (detector-on time) | Marked lightcurve |
|---|---|---|---|---|---|---|---|
| A | 7512 | 6443 | 16 | 16 | 0.21% | 0.25% | 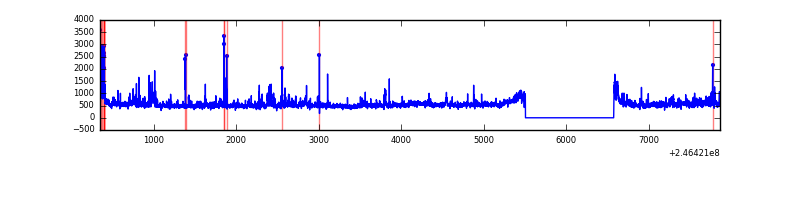 |
| B | 7512 | 6443 | 30 | 30 | 0.40% | 0.47% | 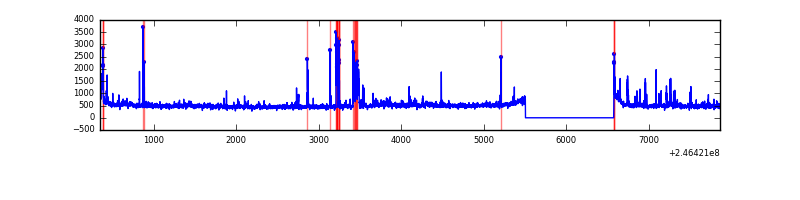 |
| C | 7512 | 6443 | 0 | 0 | 0.00% | 0.00% | 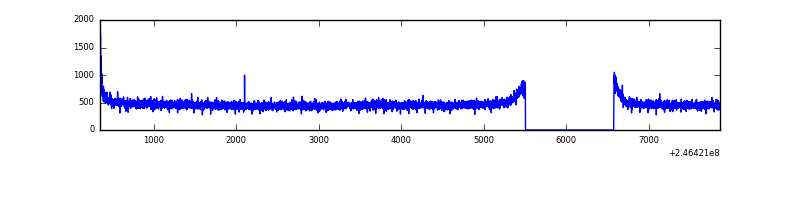 |
| D | 7512 | 6443 | 220 | 220 | 2.93% | 3.41% | 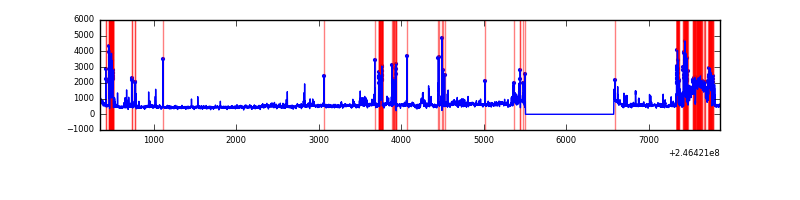 |
Top three noisy pixels from each quadrant. If the there are fewer than three noisy pixels in the level2.evt file, extra rows are filled as -1
| Pixel properties | Quadrant properties | ||||||
|---|---|---|---|---|---|---|---|
| Quadrant | DetID | PixID | Counts | Sigma | Mean | Median | Sigma |
| A | 8 | 5 | 394228 | 2507.53 | 772 | 755 | 156.9 |
| A | 8 | 15 | 275602 | 1751.55 | 772 | 755 | 156.9 |
| A | 14 | 238 | 63249 | 398.26 | 772 | 755 | 156.9 |
| B | 4 | 239 | 282433 | 1881.86 | 784 | 764 | 149.7 |
| B | 0 | 187 | 60099 | 396.42 | 784 | 764 | 149.7 |
| B | 0 | 229 | 19999 | 128.51 | 784 | 764 | 149.7 |
| C | 0 | 10 | 11120 | 57.71 | 771 | 775 | 179.3 |
| C | 13 | 61 | 5857 | 28.35 | 771 | 775 | 179.3 |
| C | 3 | 202 | 1877 | 6.15 | 771 | 775 | 179.3 |
| D | 12 | 157 | 554754 | 3084.68 | 746 | 726 | 179.6 |
| D | 8 | 195 | 526319 | 2926.36 | 746 | 726 | 179.6 |
| D | 2 | 14 | 241387 | 1339.93 | 746 | 726 | 179.6 |
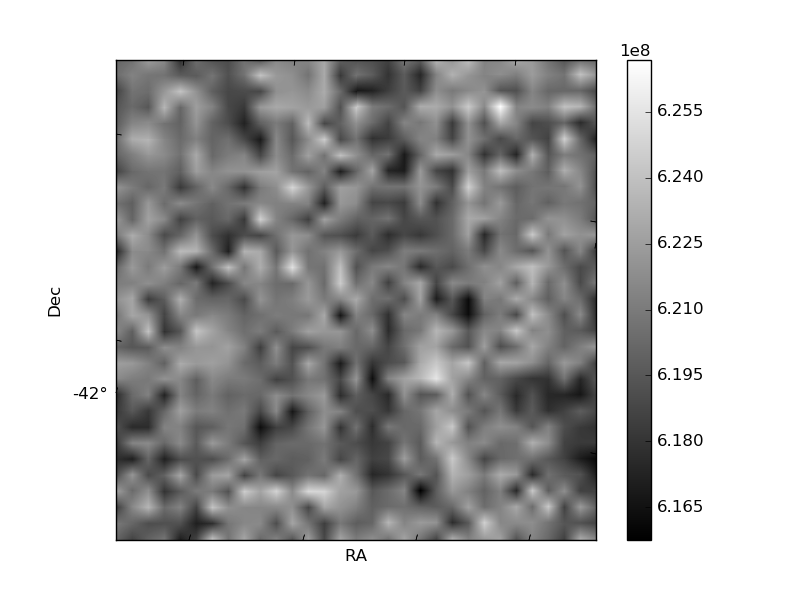
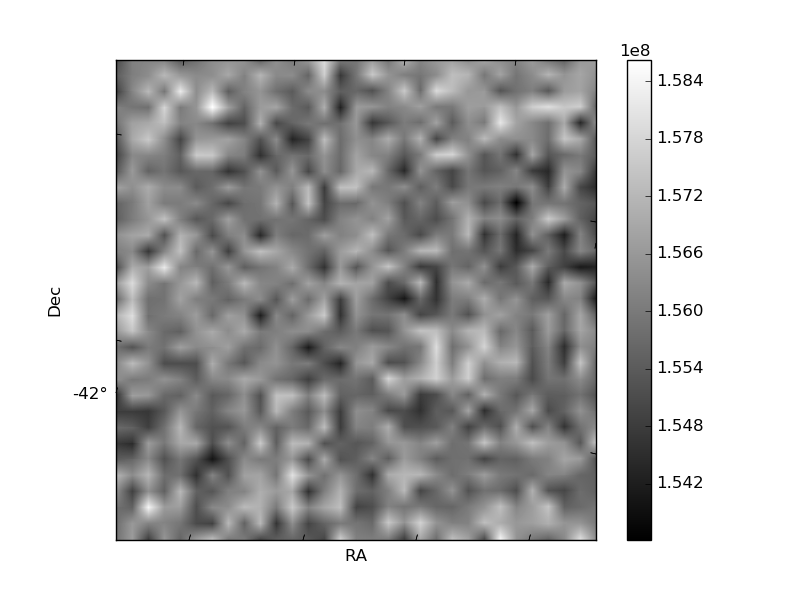
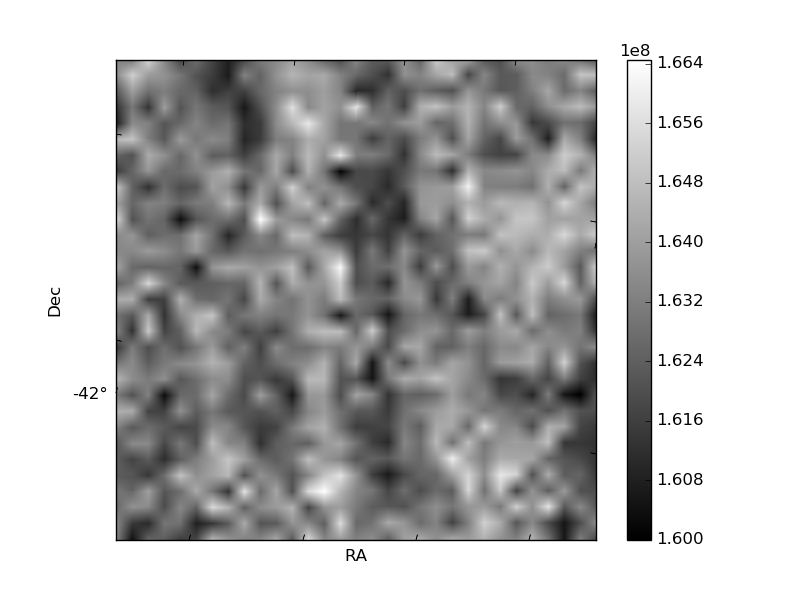
Histogram calculated using DETX and DETY for each event in the final _common_clean file
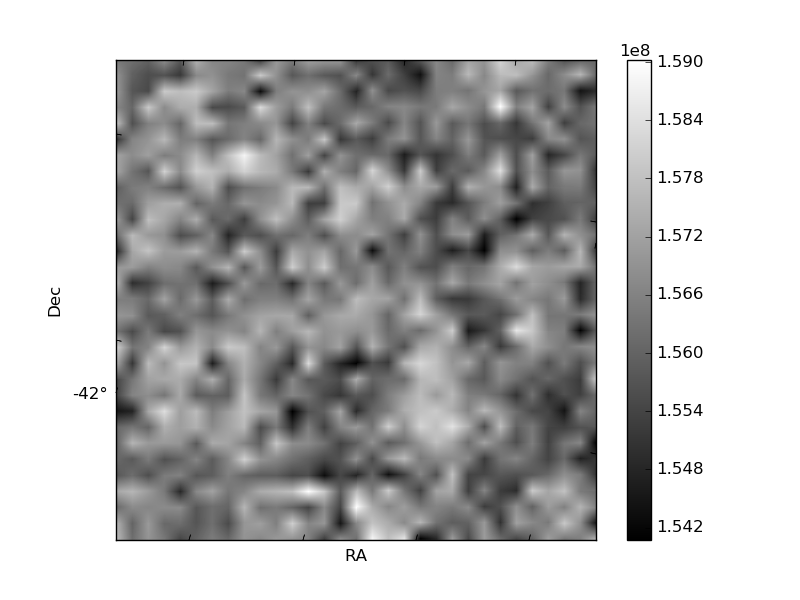
| Quadrant A | 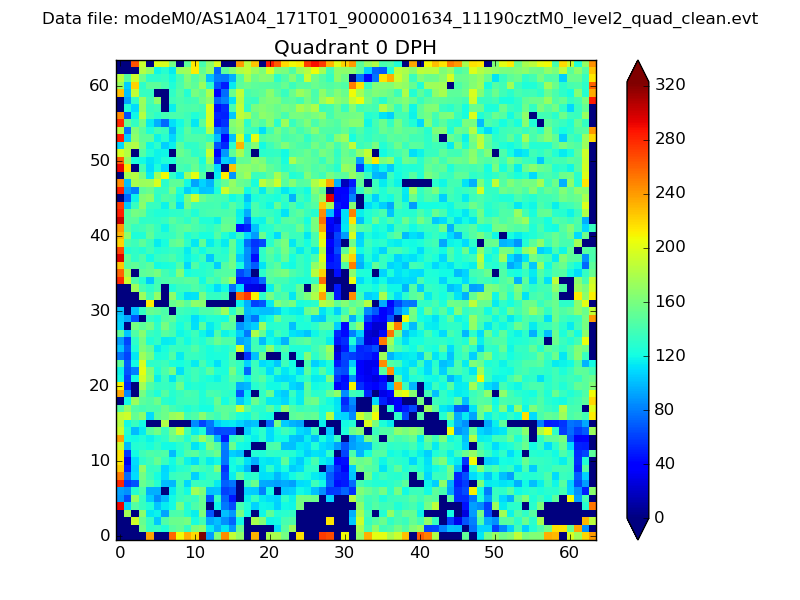 |
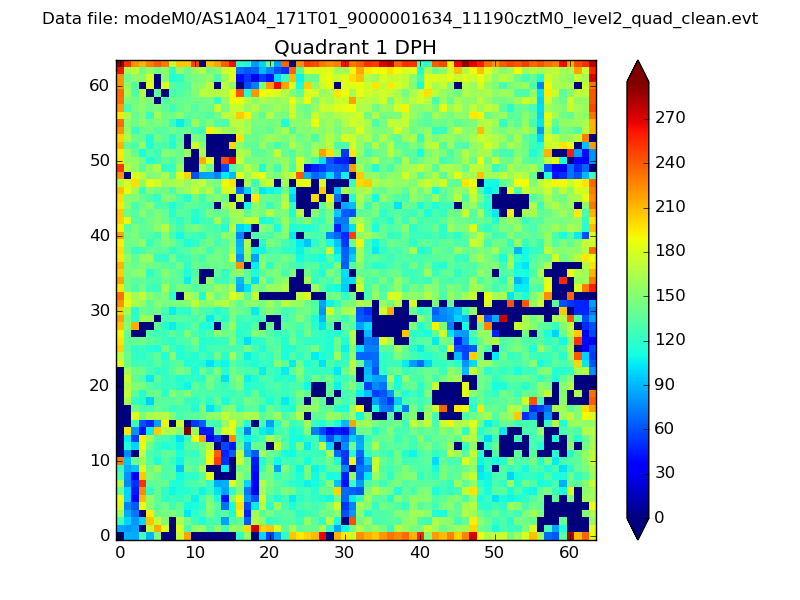 |
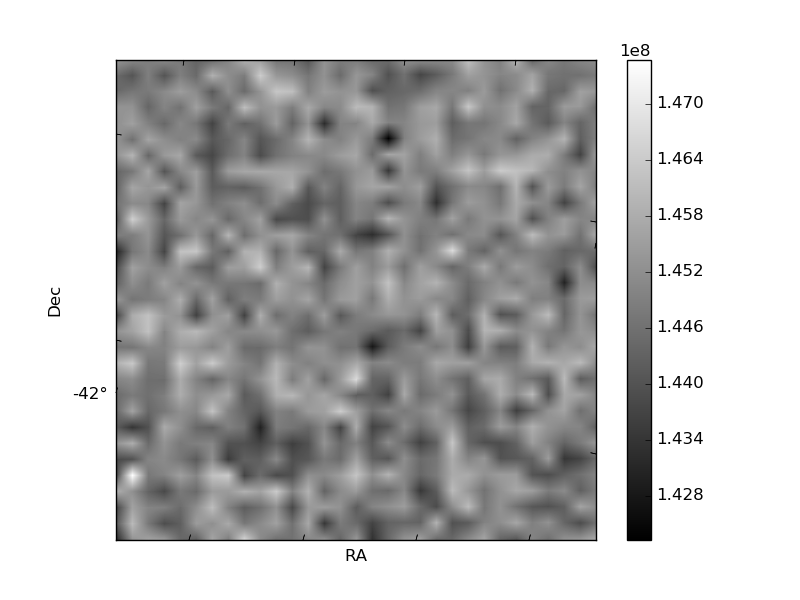
Quadrant B |
|---|---|---|---|
| Quadrant D | 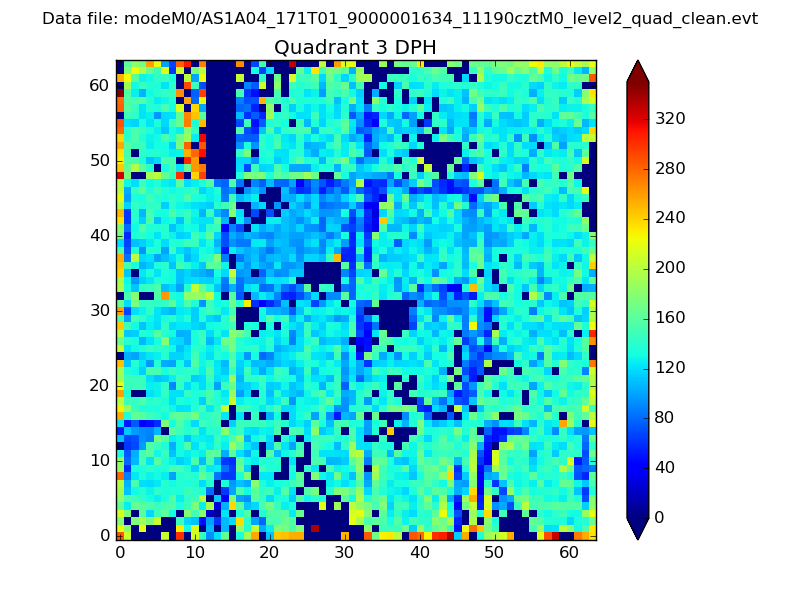 |
 |
Quadrant C |
| Plot type | Count rate plots | Images |
|---|---|---|
| Comparison with Poisson distribution Blue bars denote a histogram of data divided into 1 sec bins. Red curve is a Poisson curve with rate = median count rate of data. |
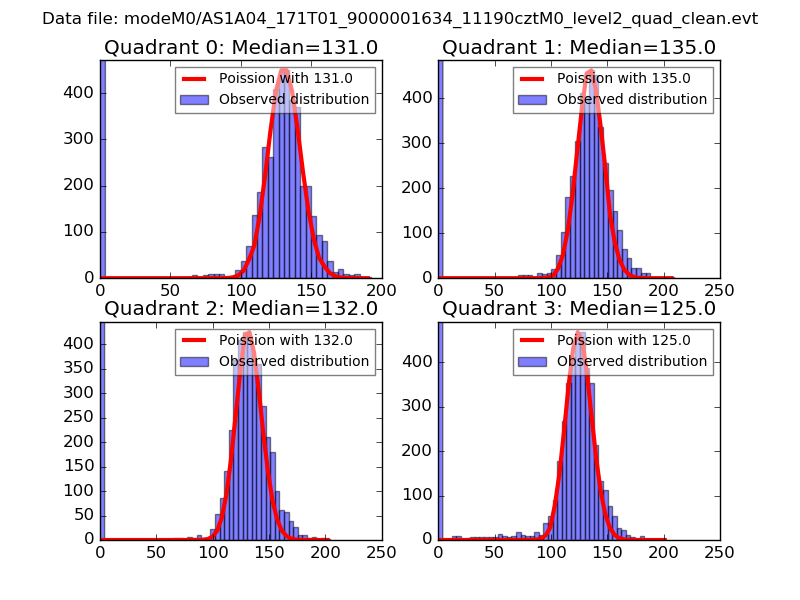 |
 |
| Quadrant-wise count rates Data is divided into 100 sec bins |
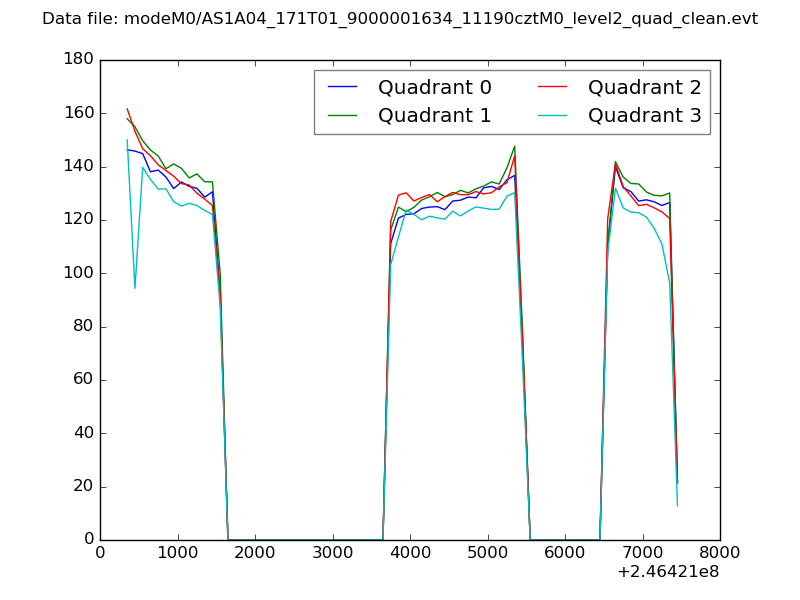 |
|
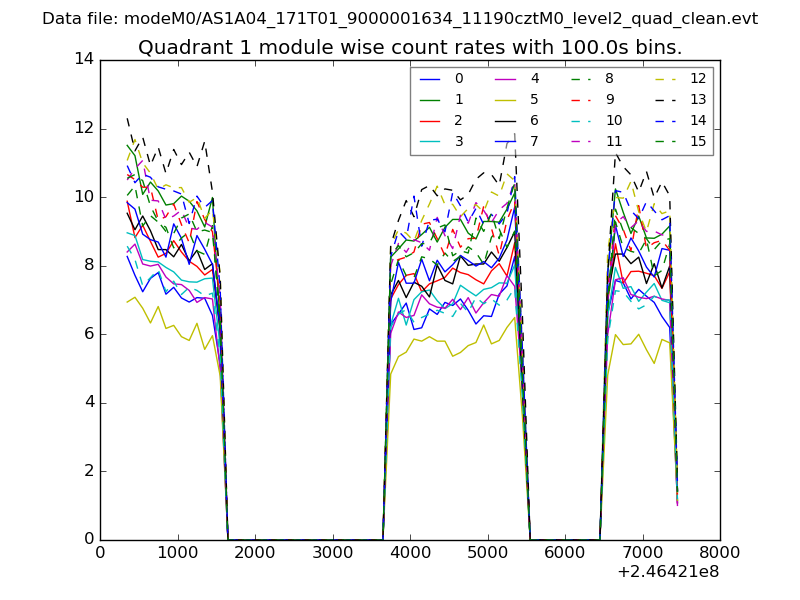
| Module-wise count rates for Quadrant A Data is divided into 100 sec bins |
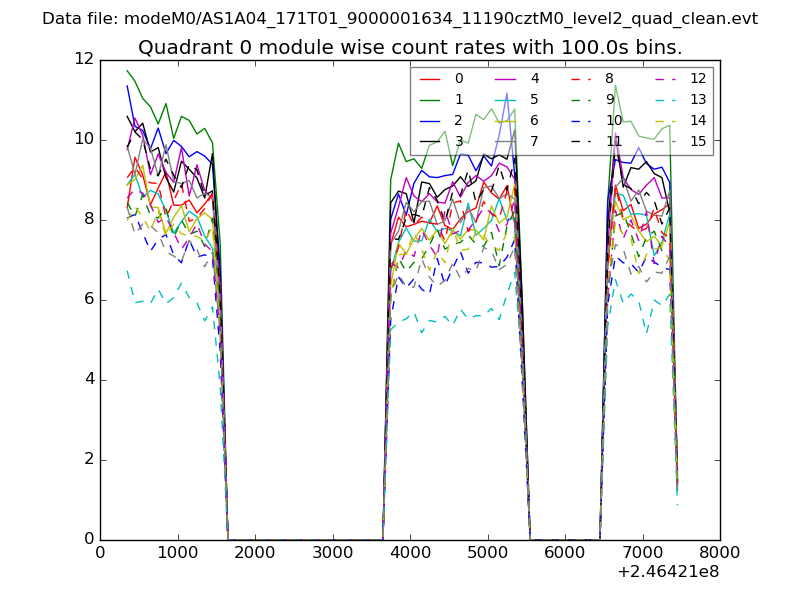 |
 |
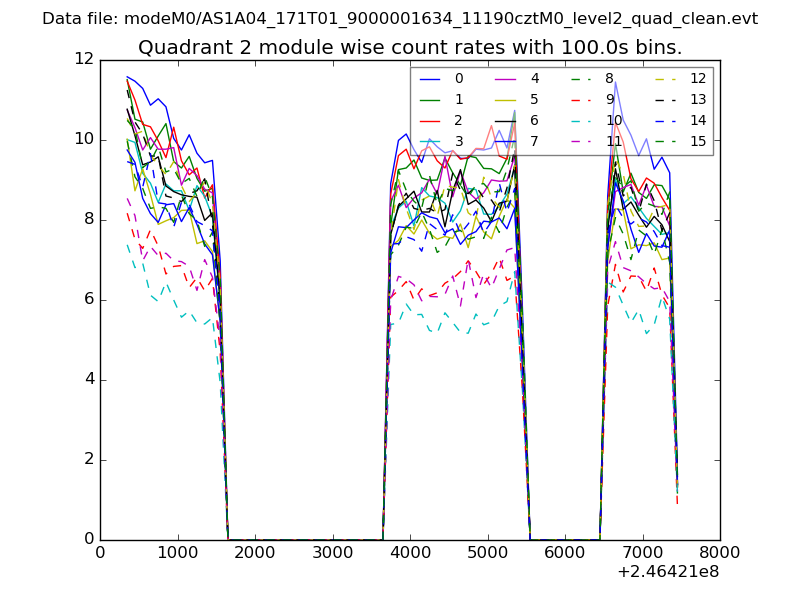
| Module-wise count rates for Quadrant B Data is divided into 100 sec bins |
 |
 |
| Module-wise count rates for Quadrant C Data is divided into 100 sec bins |
 |
 |
| Module-wise count rates for Quadrant D Data is divided into 100 sec bins |
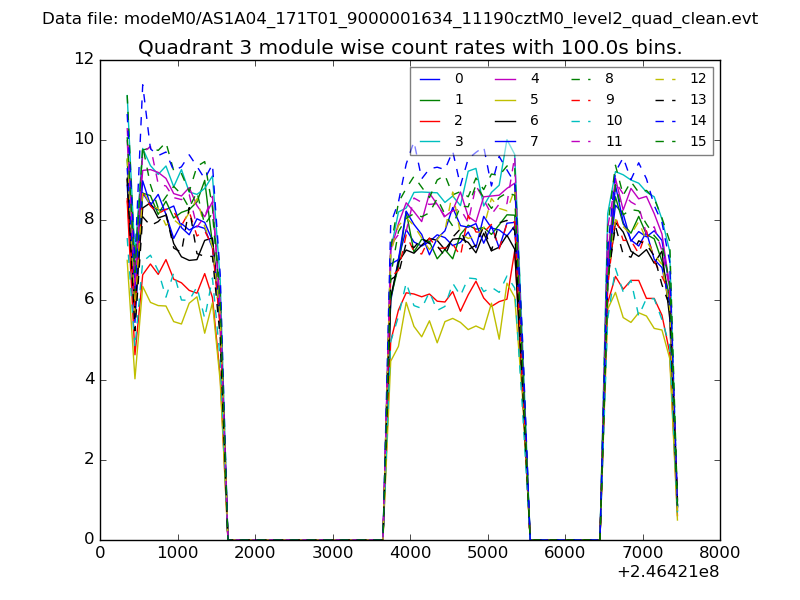 |
 |
| Parameter | Plot |
|---|---|
| CZT HV Monitor | 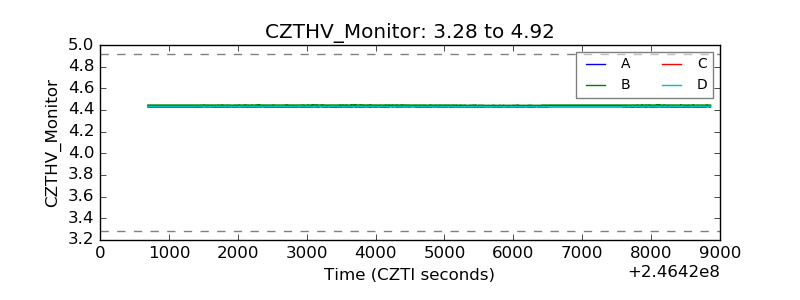 |
| D_VDD | 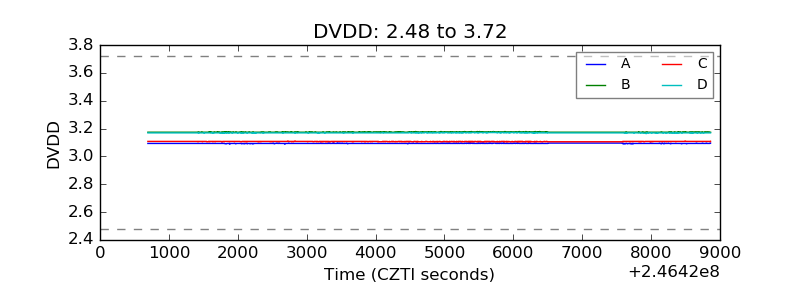 |
| Temperature 1 |  |
| Veto HV Monitor | 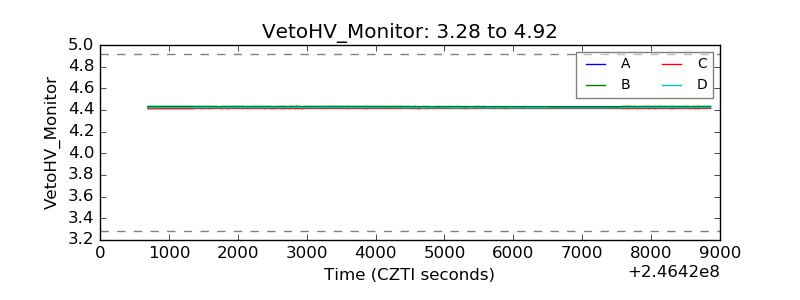 |
| Veto LLD | 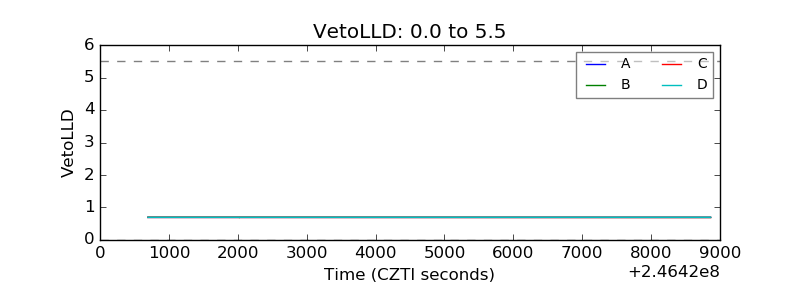 |
| Alpha Counter | 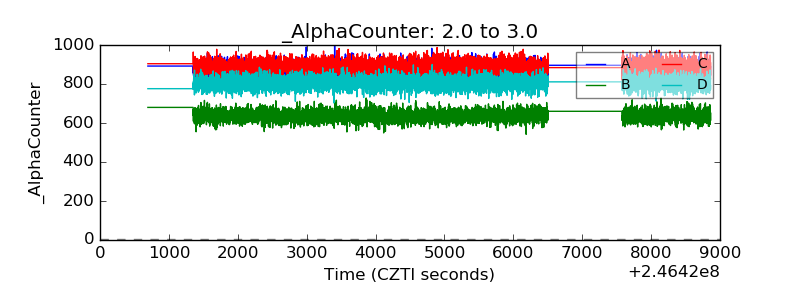 |
| _CPM_Rate | 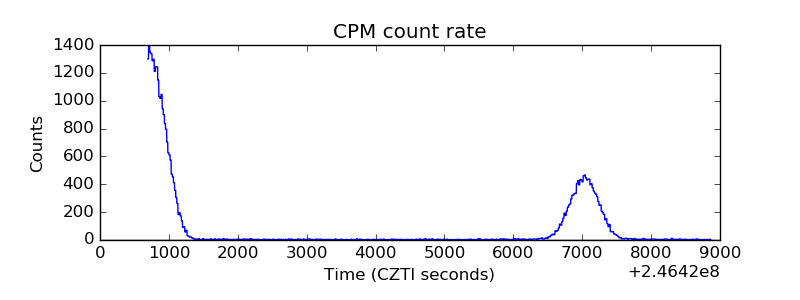 |
| CZT Counter |  |
| +2.5 Volts monitor | 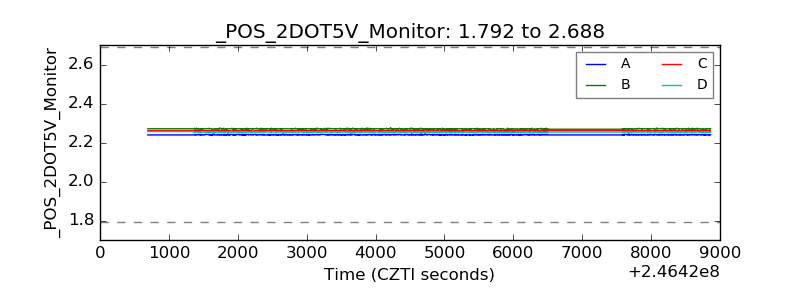 |
| +5 Volts monitor |  |
| _ROLL_ROT | 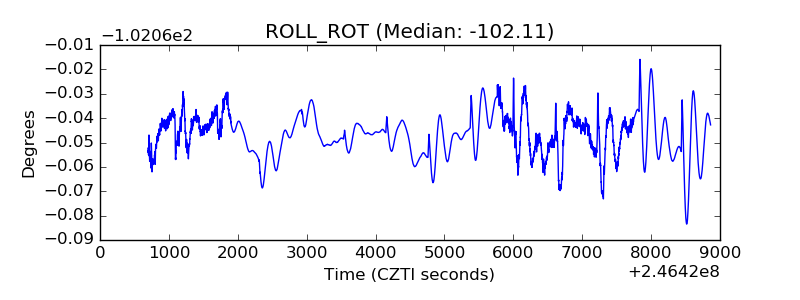 |
| _Roll_DEC | 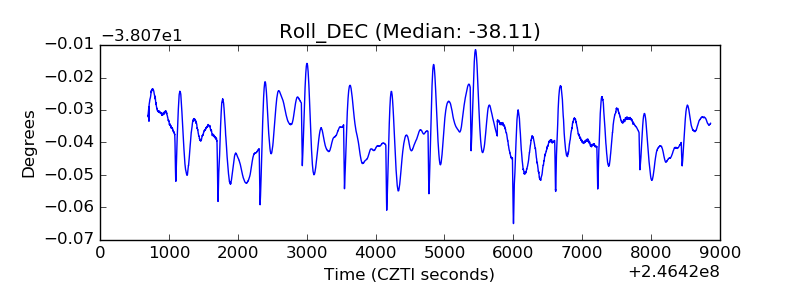 |
| _Roll_RA | 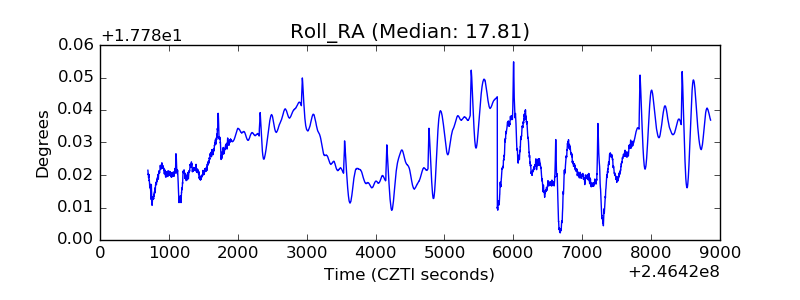 |
| Veto Counter | 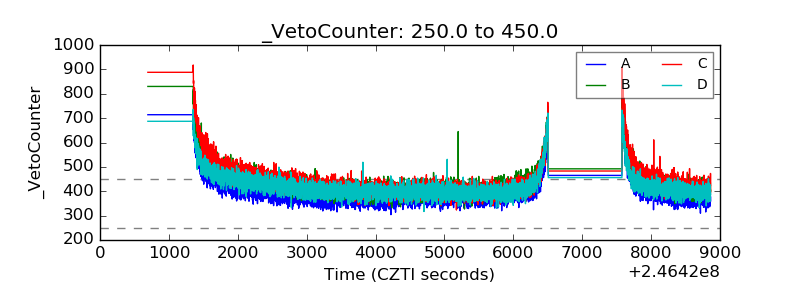 |