| Param | Original file | Final file |
|---|---|---|
| Filename | modeM0/AS1A04_171T01_9000001634_11191cztM0_level2.evt | modeM0/AS1A04_171T01_9000001634_11191cztM0_level2_quad_clean.evt |
| Size (bytes) | 547,234,560 | 85,512,960 |
| Size | 521.9 MB | 81.6 MB |
| Events in quadrant A | 3,958,648 | 522,970 |
| Events in quadrant B | 3,632,386 | 538,532 |
| Events in quadrant C | 3,319,535 | 530,620 |
| Events in quadrant D | 5,173,737 | 495,655 |
| Mode SS | |||
|---|---|---|---|
| Quadrant | BADHDUFLAG | Total packets | Discarded packets |
| A | 0 | 150 | 2 |
| B | 0 | 150 | 0 |
| C | 0 | 150 | 0 |
| D | 0 | 150 | 0 |
| Mode M0 | |||
|---|---|---|---|
| Quadrant | BADHDUFLAG | Total packets | Discarded packets |
| A | 0 | 16391 | 18 |
| B | 0 | 15499 | 26 |
| C | 0 | 14873 | 20 |
| D | 0 | 20108 | 25 |
| Mode M9 | |||
|---|---|---|---|
| Quadrant | BADHDUFLAG | Total packets | Discarded packets |
| A | 0 | 18 | 0 |
| B | 0 | 18 | 0 |
| C | 0 | 18 | 0 |
| D | 0 | 18 | 0 |
| Quadrant | Total seconds | Saturated seconds | Saturation percentage |
|---|---|---|---|
| A | 7198 | 170 | 2.361767% |
| B | 7194 | 164 | 2.279678% |
| C | 7196 | 114 | 1.584213% |
| D | 7197 | 332 | 4.613033% |
Noise dominated data is calculated using 1-second bins in cleaned event files. If a bin has >2000 counts, and if more than 50% of those come from <1% of pixels, then it is considered to be noise-dominated and hence unusable.
| Quadrant | # 1 sec bins | Bins with >0 counts | Bins with >2000 counts | High rate bins dominated by noise | Noise dominated (total time) | Noise dominated (detector-on time) | Marked lightcurve |
|---|---|---|---|---|---|---|---|
| A | 9060 | 7206 | 9 | 9 | 0.10% | 0.12% | 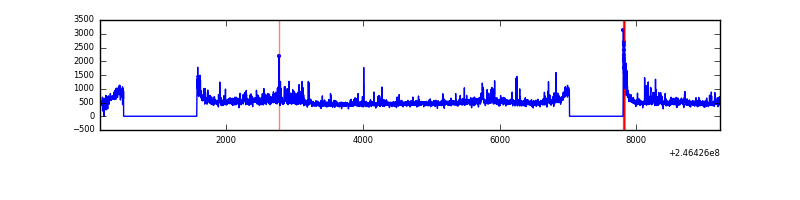 |
| B | 9060 | 7206 | 9 | 9 | 0.10% | 0.12% | 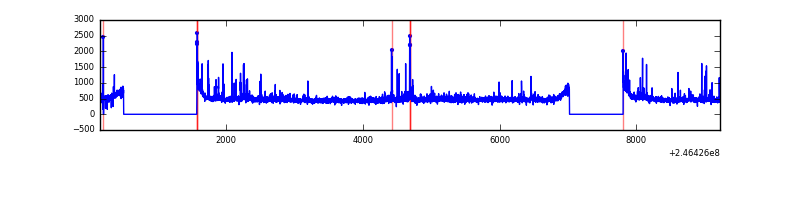 |
| C | 9060 | 7206 | 0 | 0 | 0.00% | 0.00% | 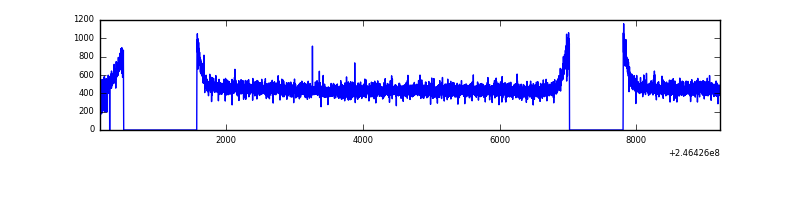 |
| D | 9060 | 7207 | 215 | 215 | 2.37% | 2.98% | 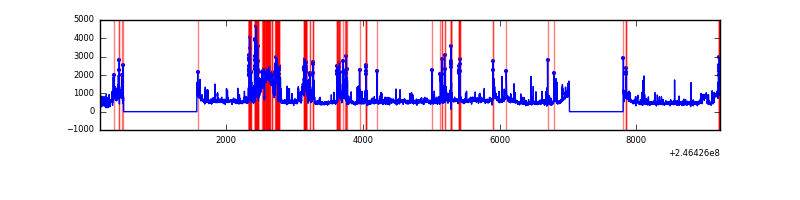 |
Top three noisy pixels from each quadrant. If the there are fewer than three noisy pixels in the level2.evt file, extra rows are filled as -1
| Pixel properties | Quadrant properties | ||||||
|---|---|---|---|---|---|---|---|
| Quadrant | DetID | PixID | Counts | Sigma | Mean | Median | Sigma |
| A | 8 | 15 | 327911 | 1883.1 | 856 | 836 | 173.7 |
| A | 8 | 5 | 236965 | 1359.49 | 856 | 836 | 173.7 |
| A | 14 | 238 | 93643 | 534.33 | 856 | 836 | 173.7 |
| B | 4 | 239 | 115817 | 690.35 | 866 | 845 | 166.5 |
| B | 3 | 189 | 63487 | 376.13 | 866 | 845 | 166.5 |
| B | 0 | 198 | 22761 | 131.59 | 866 | 845 | 166.5 |
| C | 13 | 61 | 6314 | 27.45 | 851 | 854 | 198.9 |
| C | 14 | 234 | 2093 | 6.23 | 851 | 854 | 198.9 |
| C | 3 | 202 | 2054 | 6.03 | 851 | 854 | 198.9 |
| D | 12 | 157 | 900738 | 4501.89 | 828 | 803 | 199.9 |
| D | 8 | 195 | 571629 | 2855.53 | 828 | 803 | 199.9 |
| D | 2 | 14 | 185663 | 924.75 | 828 | 803 | 199.9 |
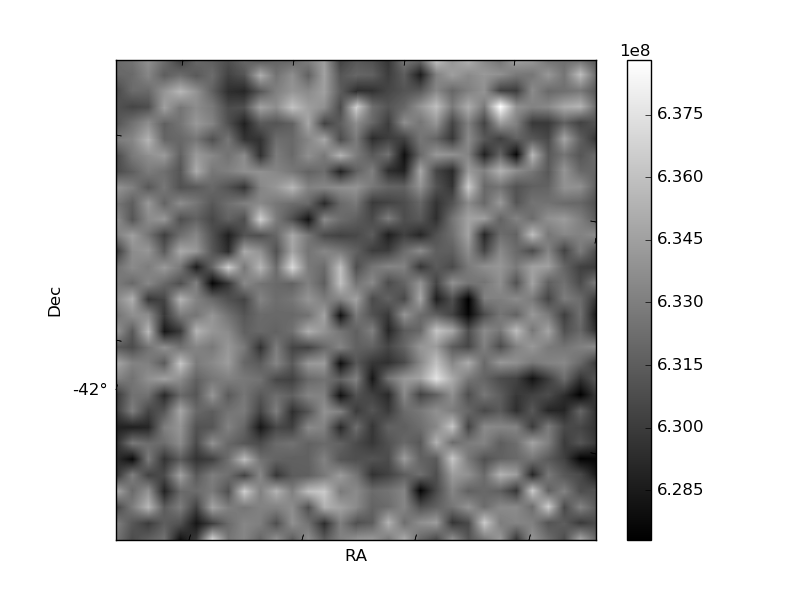
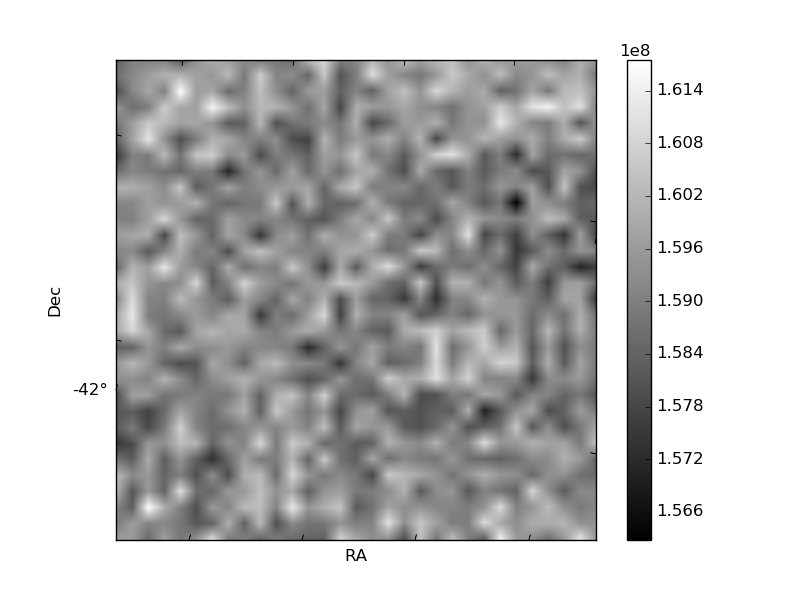
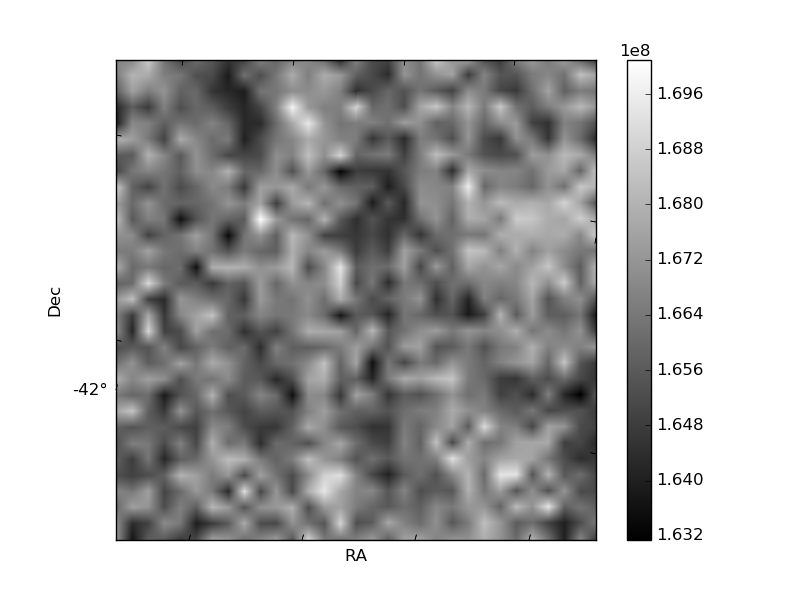
Histogram calculated using DETX and DETY for each event in the final _common_clean file
| Quadrant A | 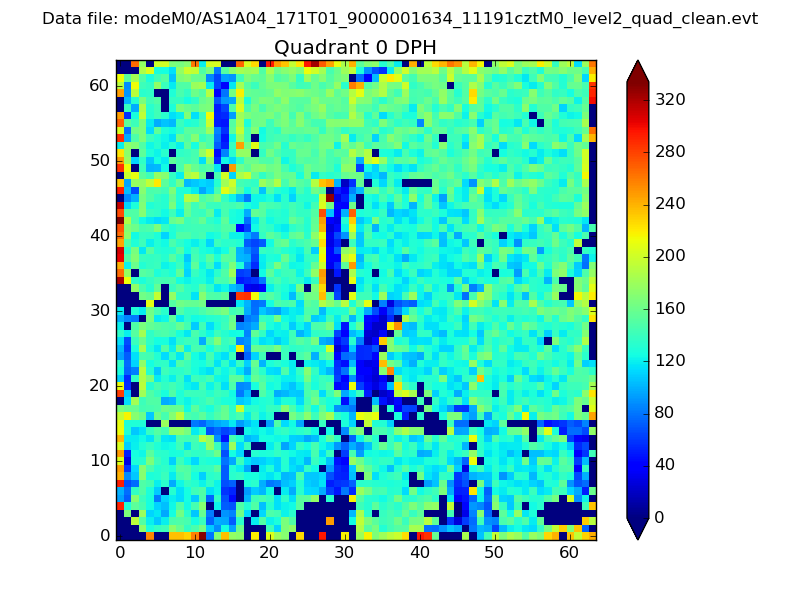 |
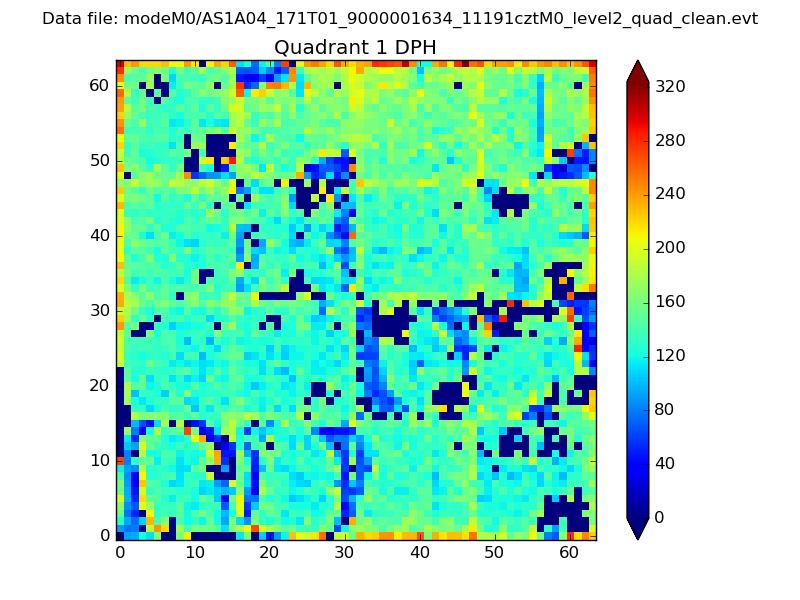 |
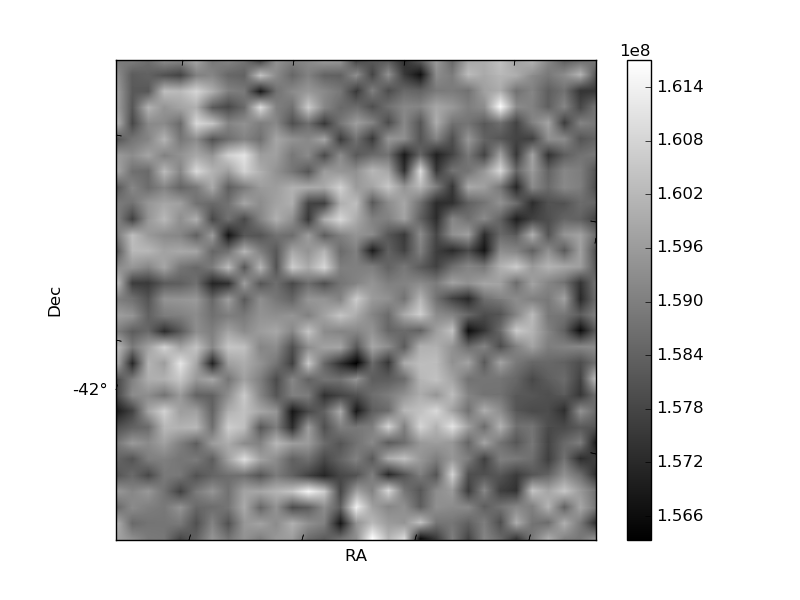
Quadrant B |
|---|---|---|---|
| Quadrant D | 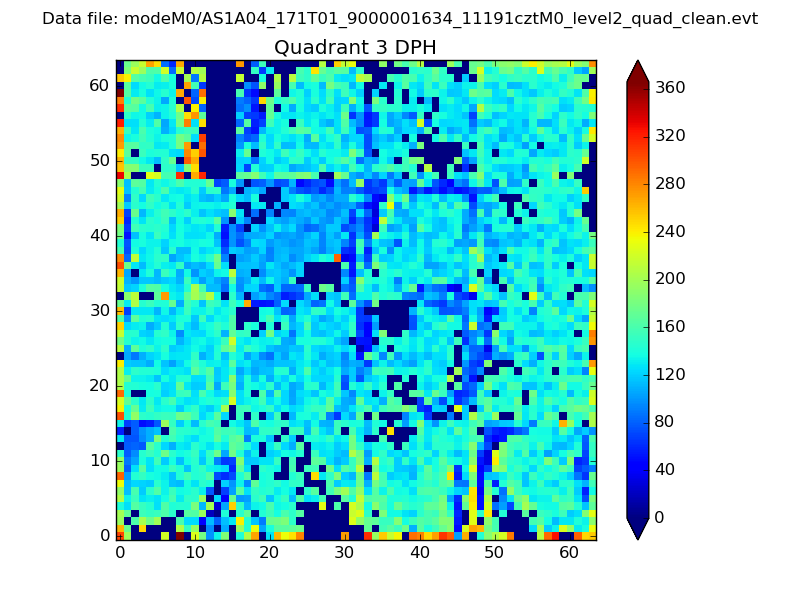 |
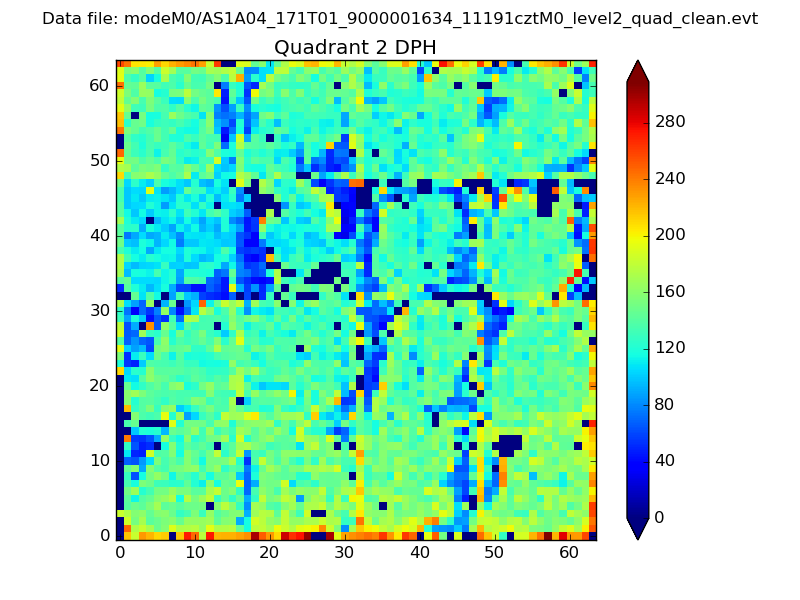 |
Quadrant C |
| Plot type | Count rate plots | Images |
|---|---|---|
| Comparison with Poisson distribution Blue bars denote a histogram of data divided into 1 sec bins. Red curve is a Poisson curve with rate = median count rate of data. |
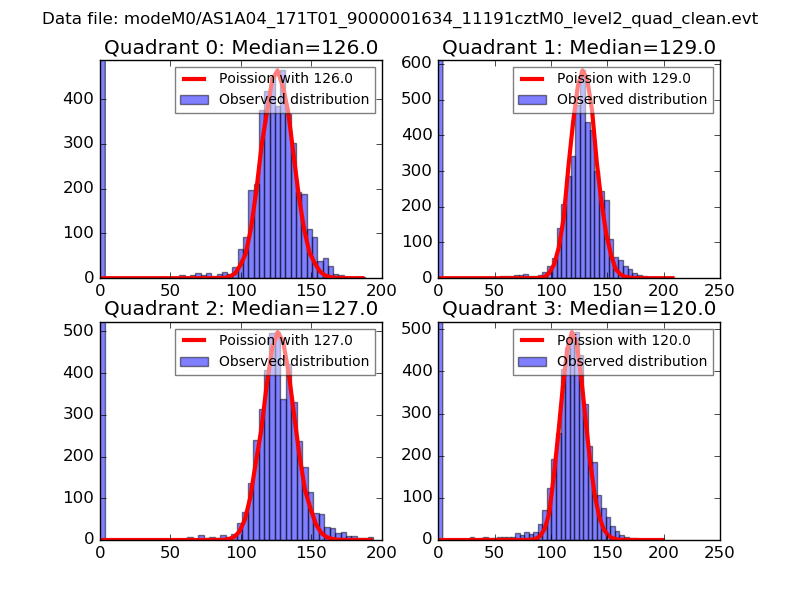 |
 |
| Quadrant-wise count rates Data is divided into 100 sec bins |
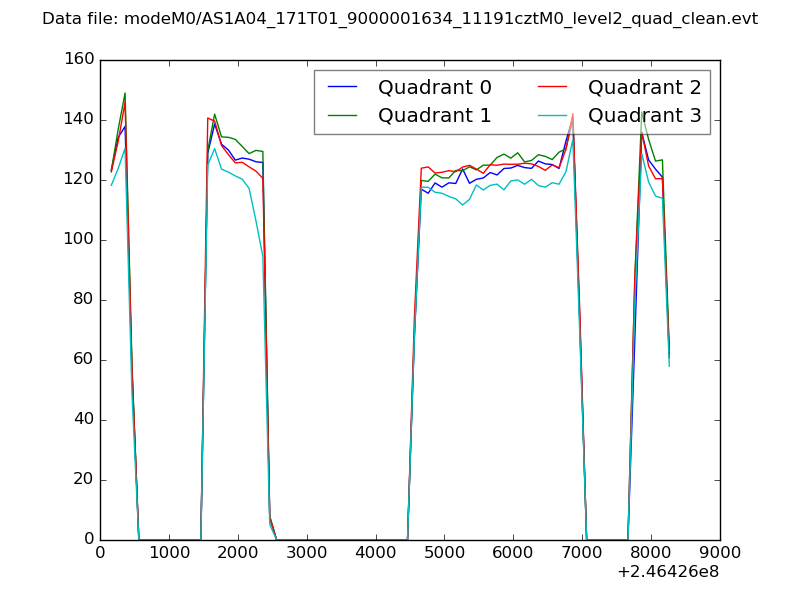 |
|
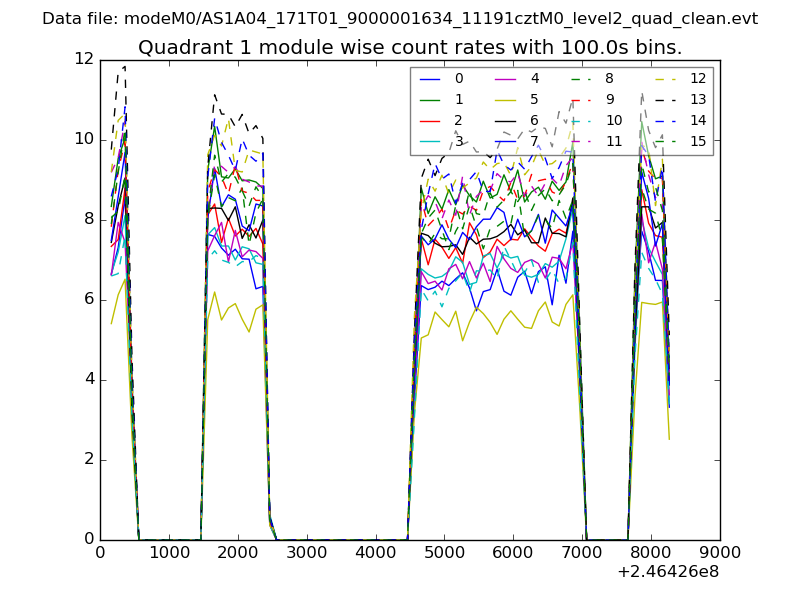
| Module-wise count rates for Quadrant A Data is divided into 100 sec bins |
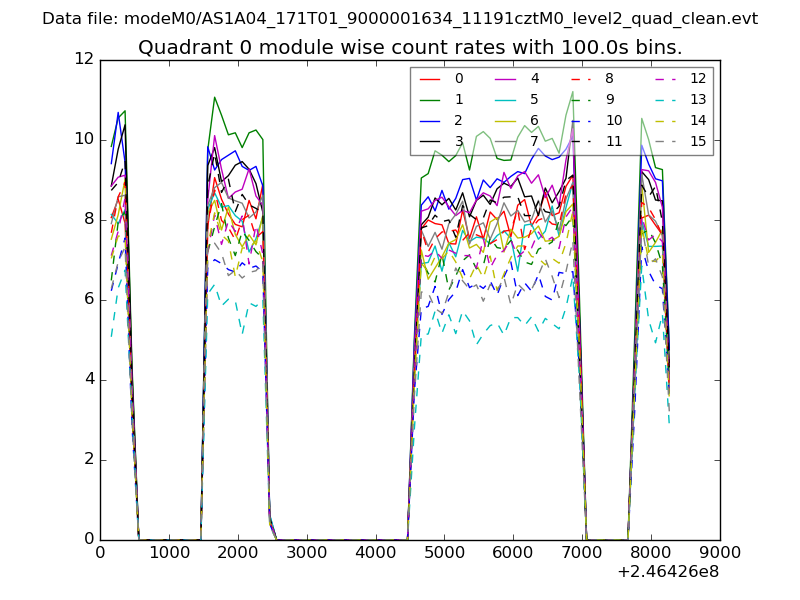 |
 |
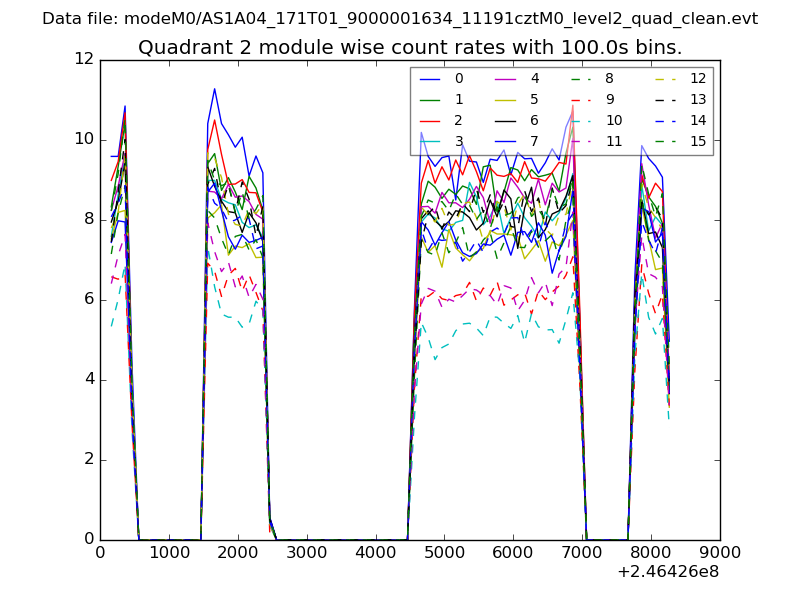
| Module-wise count rates for Quadrant B Data is divided into 100 sec bins |
 |
 |
| Module-wise count rates for Quadrant C Data is divided into 100 sec bins |
 |
 |
| Module-wise count rates for Quadrant D Data is divided into 100 sec bins |
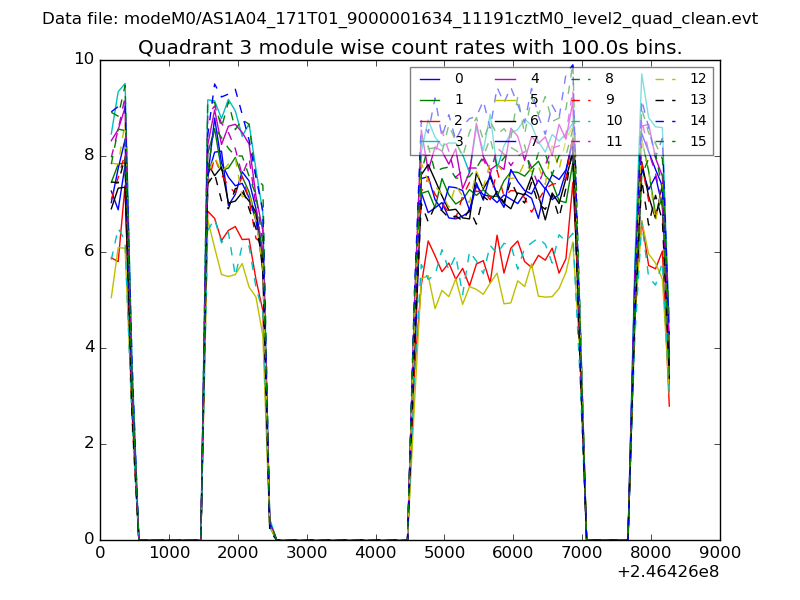 |
 |
| Parameter | Plot |
|---|---|
| CZT HV Monitor | 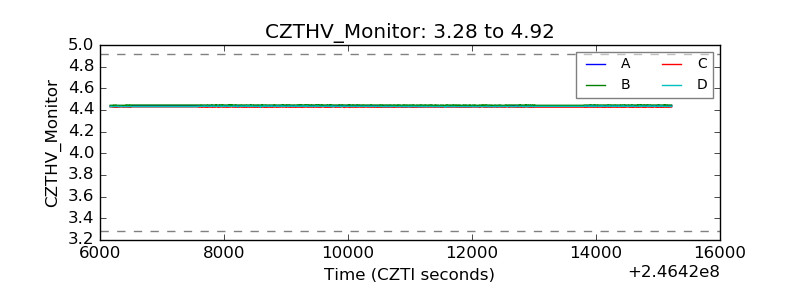 |
| D_VDD | 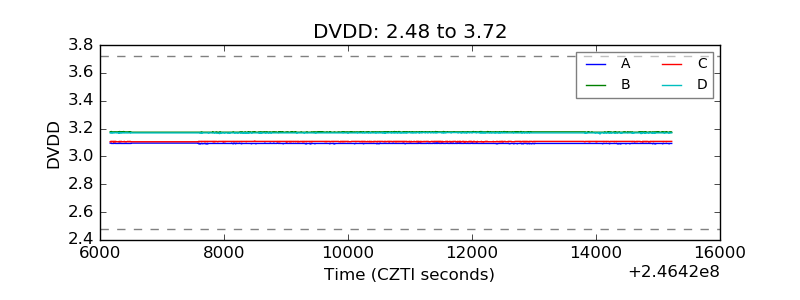 |
| Temperature 1 | 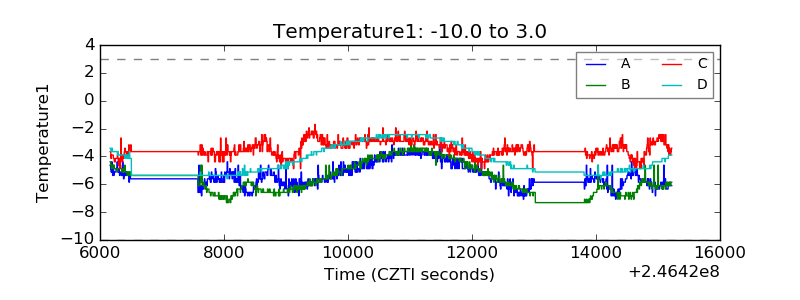 |
| Veto HV Monitor |  |
| Veto LLD | 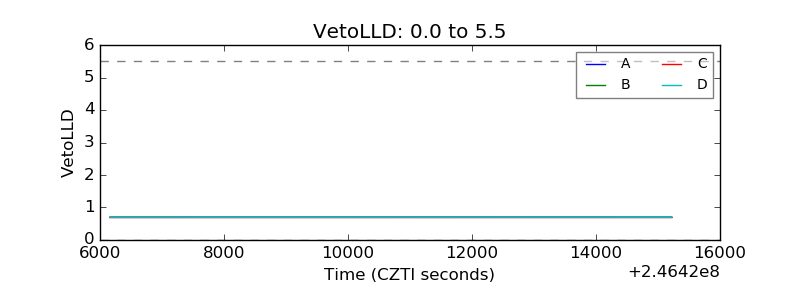 |
| Alpha Counter | 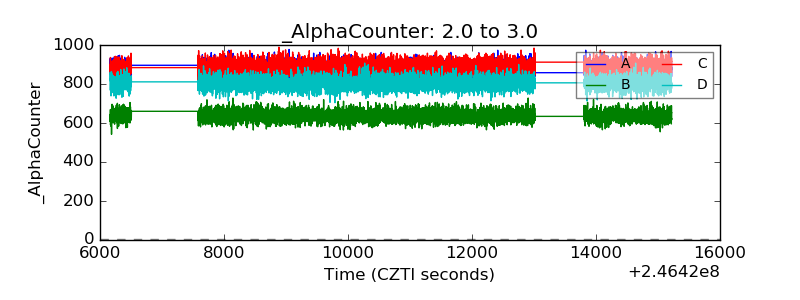 |
| _CPM_Rate | 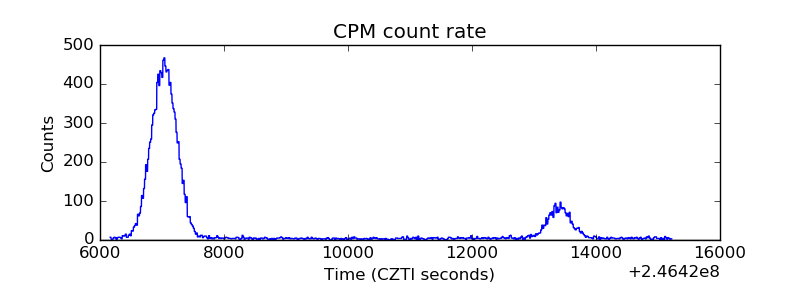 |
| CZT Counter |  |
| +2.5 Volts monitor |  |
| +5 Volts monitor |  |
| _ROLL_ROT | 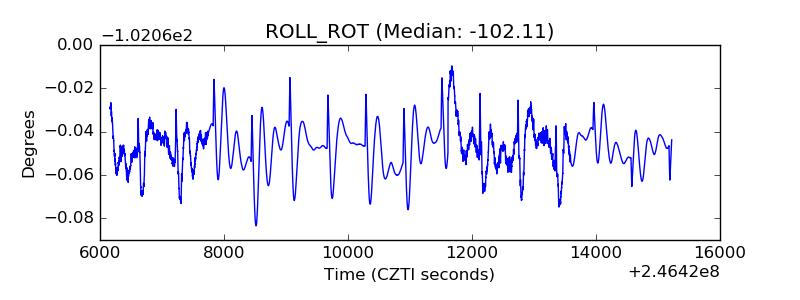 |
| _Roll_DEC | 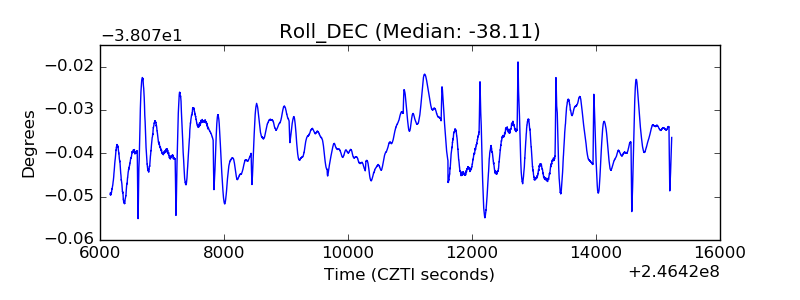 |
| _Roll_RA | 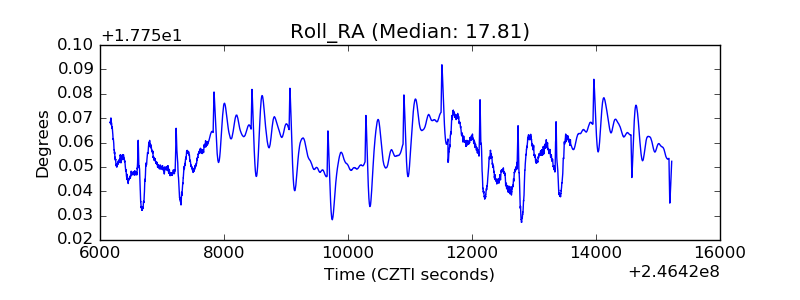 |
| Veto Counter | 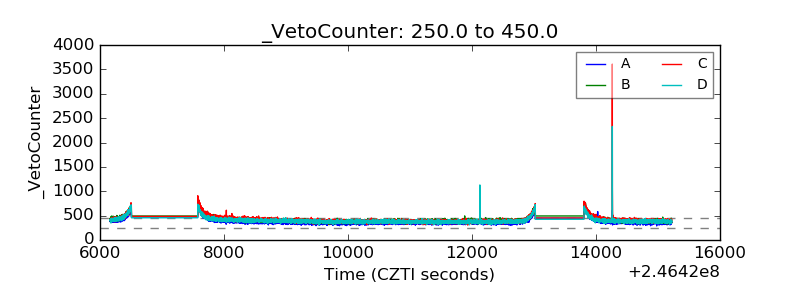 |