| Param | Original file | Final file |
|---|---|---|
| Filename | modeM0/AS1A04_171T01_9000001634_11192cztM0_level2.evt | modeM0/AS1A04_171T01_9000001634_11192cztM0_level2_quad_clean.evt |
| Size (bytes) | 616,276,800 | 99,573,120 |
| Size | 587.7 MB | 95.0 MB |
| Events in quadrant A | 4,563,790 | 609,443 |
| Events in quadrant B | 4,201,524 | 623,739 |
| Events in quadrant C | 3,914,598 | 616,597 |
| Events in quadrant D | 5,413,060 | 580,486 |
| Mode SS | |||
|---|---|---|---|
| Quadrant | BADHDUFLAG | Total packets | Discarded packets |
| A | 0 | 174 | 0 |
| B | 0 | 174 | 0 |
| C | 0 | 174 | 0 |
| D | 0 | 174 | 0 |
| Mode M0 | |||
|---|---|---|---|
| Quadrant | BADHDUFLAG | Total packets | Discarded packets |
| A | 0 | 19034 | 3 |
| B | 0 | 18103 | 2 |
| C | 0 | 17654 | 4 |
| D | 0 | 21620 | 12 |
| Mode M9 | |||
|---|---|---|---|
| Quadrant | BADHDUFLAG | Total packets | Discarded packets |
| A | 0 | 11 | 0 |
| B | 0 | 11 | 0 |
| C | 0 | 11 | 0 |
| D | 0 | 11 | 0 |
| Quadrant | Total seconds | Saturated seconds | Saturation percentage |
|---|---|---|---|
| A | 8418 | 327 | 3.884533% |
| B | 8418 | 294 | 3.492516% |
| C | 8417 | 233 | 2.768207% |
| D | 8415 | 470 | 5.585264% |
Noise dominated data is calculated using 1-second bins in cleaned event files. If a bin has >2000 counts, and if more than 50% of those come from <1% of pixels, then it is considered to be noise-dominated and hence unusable.
| Quadrant | # 1 sec bins | Bins with >0 counts | Bins with >2000 counts | High rate bins dominated by noise | Noise dominated (total time) | Noise dominated (detector-on time) | Marked lightcurve |
|---|---|---|---|---|---|---|---|
| A | 9478 | 8421 | 27 | 27 | 0.28% | 0.32% | 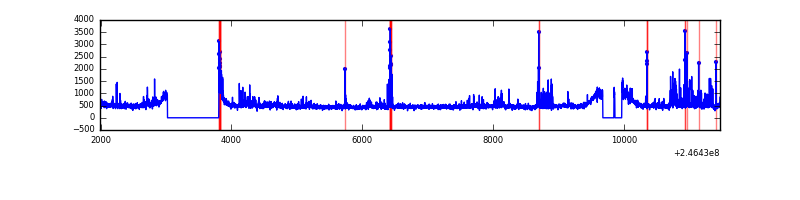 |
| B | 9478 | 8420 | 2 | 2 | 0.02% | 0.02% | 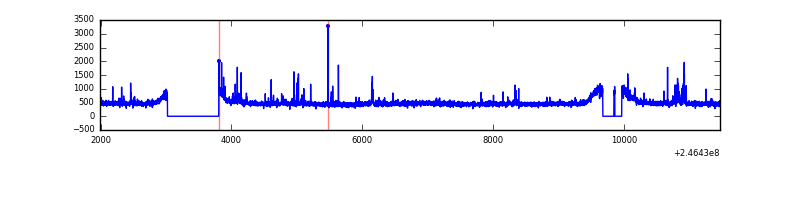 |
| C | 9478 | 8421 | 0 | 0 | 0.00% | 0.00% | 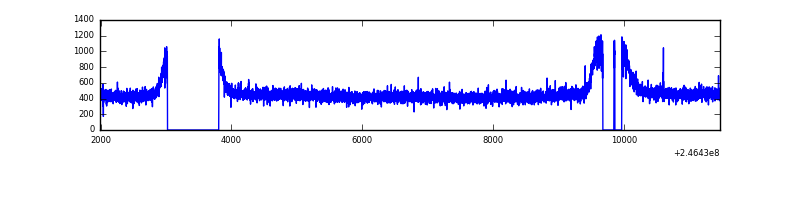 |
| D | 9478 | 8420 | 161 | 161 | 1.70% | 1.91% | 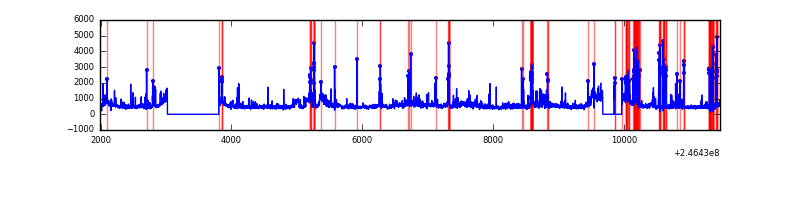 |
Top three noisy pixels from each quadrant. If the there are fewer than three noisy pixels in the level2.evt file, extra rows are filled as -1
| Pixel properties | Quadrant properties | ||||||
|---|---|---|---|---|---|---|---|
| Quadrant | DetID | PixID | Counts | Sigma | Mean | Median | Sigma |
| A | 8 | 5 | 407996 | 1930.07 | 1014 | 989 | 210.9 |
| A | 8 | 15 | 164276 | 774.32 | 1014 | 989 | 210.9 |
| A | 14 | 238 | 83768 | 392.55 | 1014 | 989 | 210.9 |
| B | 4 | 239 | 102506 | 511.21 | 1023 | 998 | 198.6 |
| B | 4 | 80 | 35126 | 171.87 | 1023 | 998 | 198.6 |
| B | 0 | 214 | 31456 | 153.39 | 1023 | 998 | 198.6 |
| C | 13 | 61 | 7392 | 27.25 | 1001 | 1006 | 234.4 |
| C | 8 | 128 | 4817 | 16.26 | 1001 | 1006 | 234.4 |
| C | 14 | 234 | 3225 | 9.47 | 1001 | 1006 | 234.4 |
| D | 1 | 52 | 473325 | 1994.41 | 974 | 946 | 236.9 |
| D | 8 | 195 | 469118 | 1976.64 | 974 | 946 | 236.9 |
| D | 2 | 14 | 227631 | 957.07 | 974 | 946 | 236.9 |
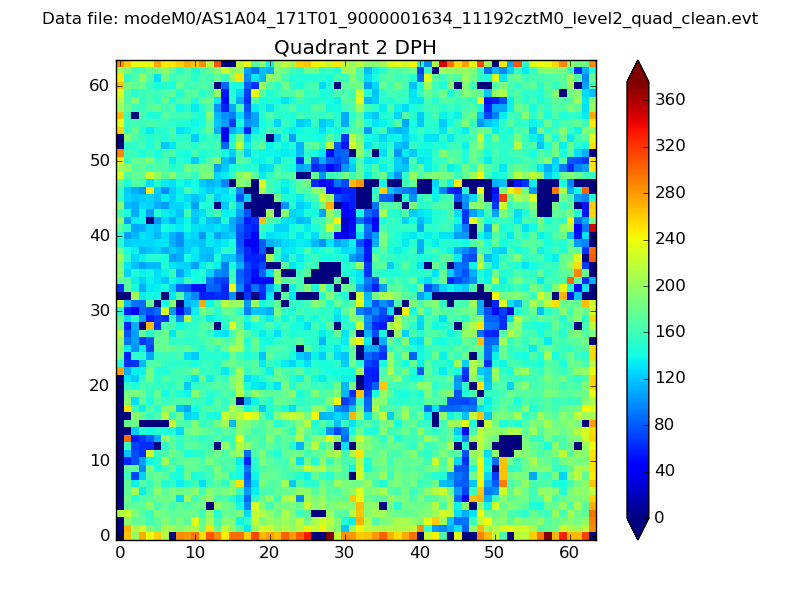
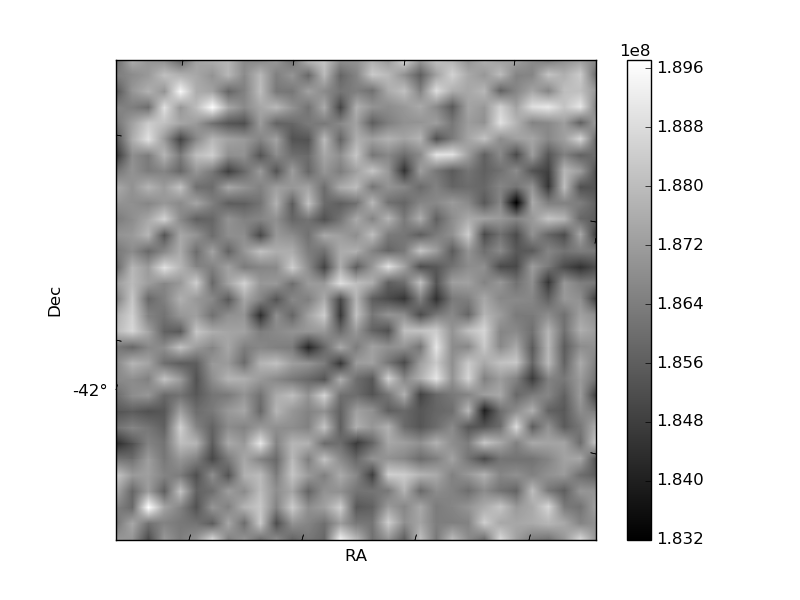
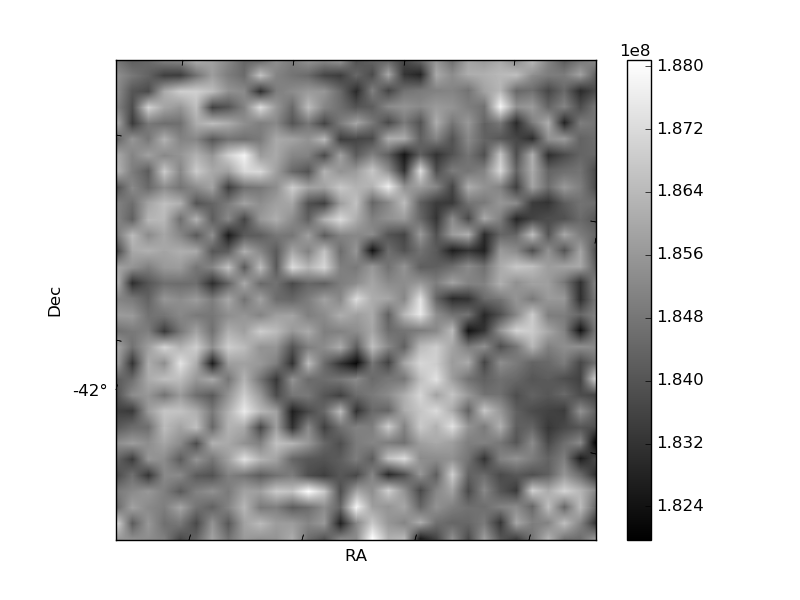
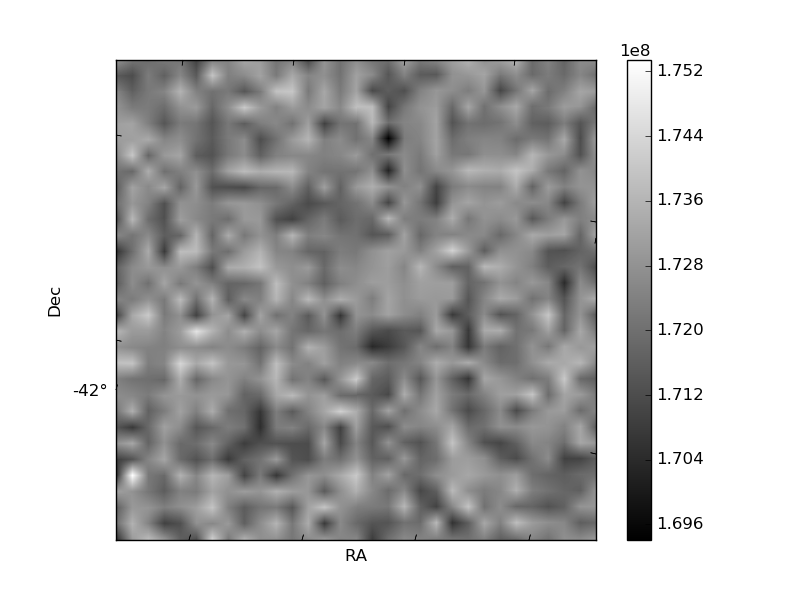
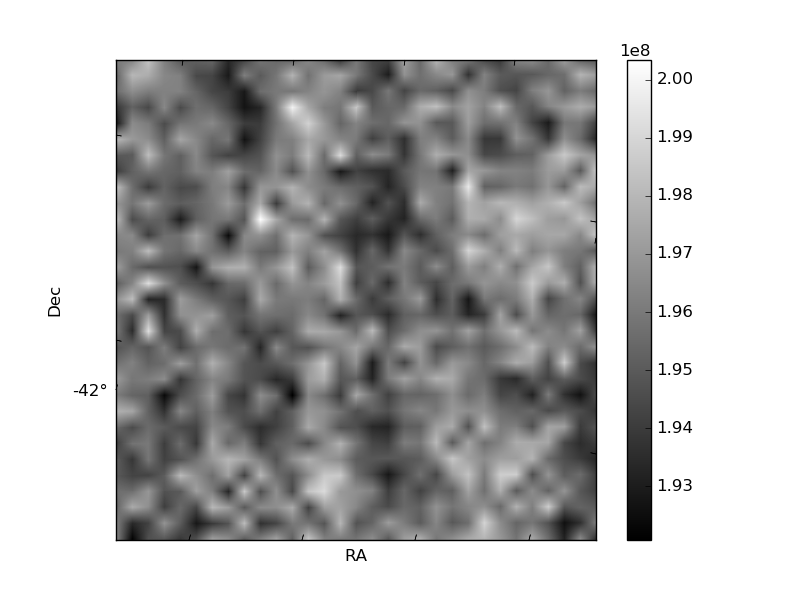
Histogram calculated using DETX and DETY for each event in the final _common_clean file
| Quadrant A | 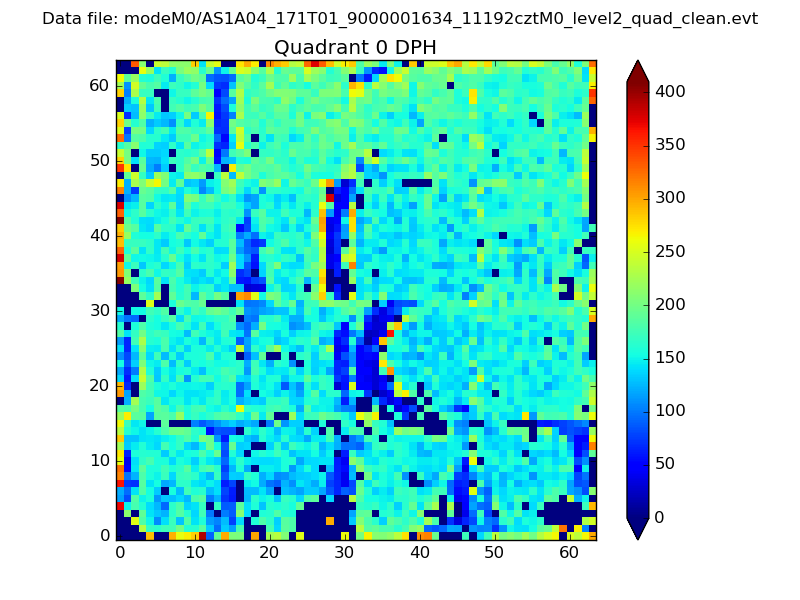 |
 |
Quadrant B |
|---|---|---|---|
| Quadrant D |  |
 |
Quadrant C |
| Plot type | Count rate plots | Images |
|---|---|---|
| Comparison with Poisson distribution Blue bars denote a histogram of data divided into 1 sec bins. Red curve is a Poisson curve with rate = median count rate of data. |
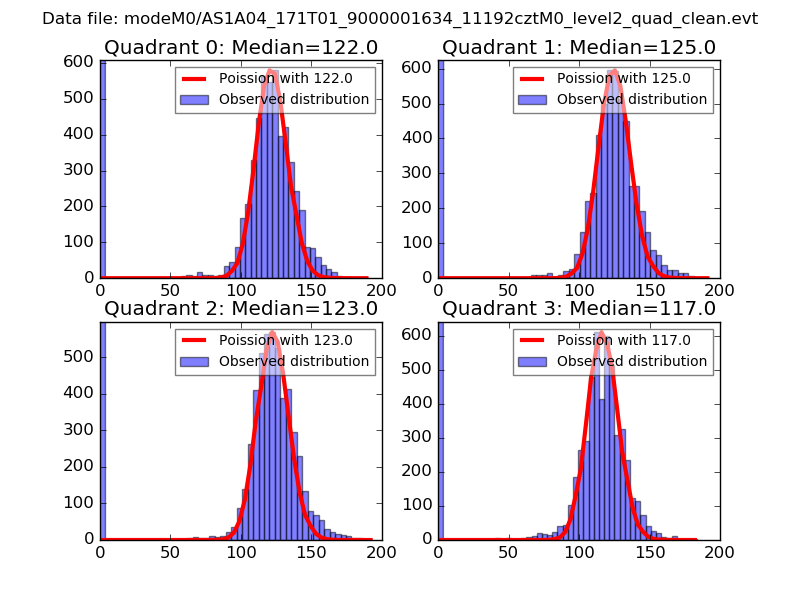 |
 |
| Quadrant-wise count rates Data is divided into 100 sec bins |
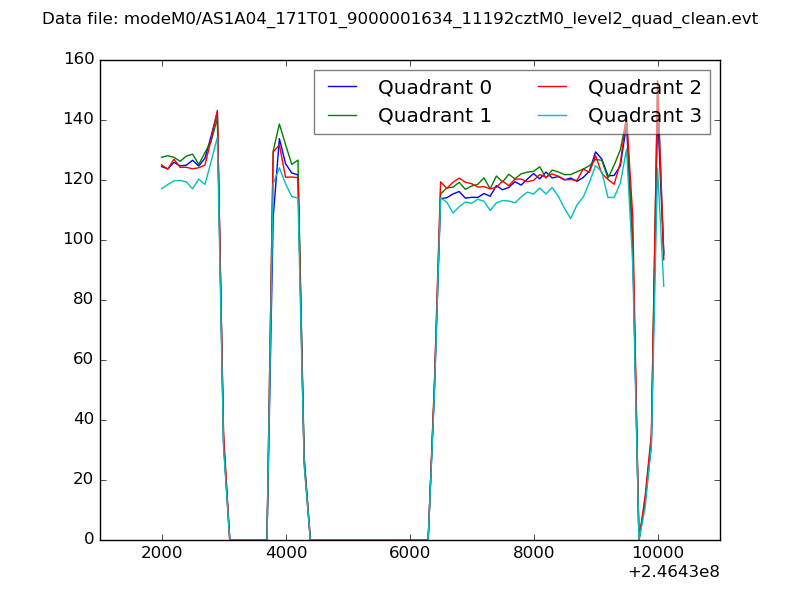 |
|
| Module-wise count rates for Quadrant A Data is divided into 100 sec bins |
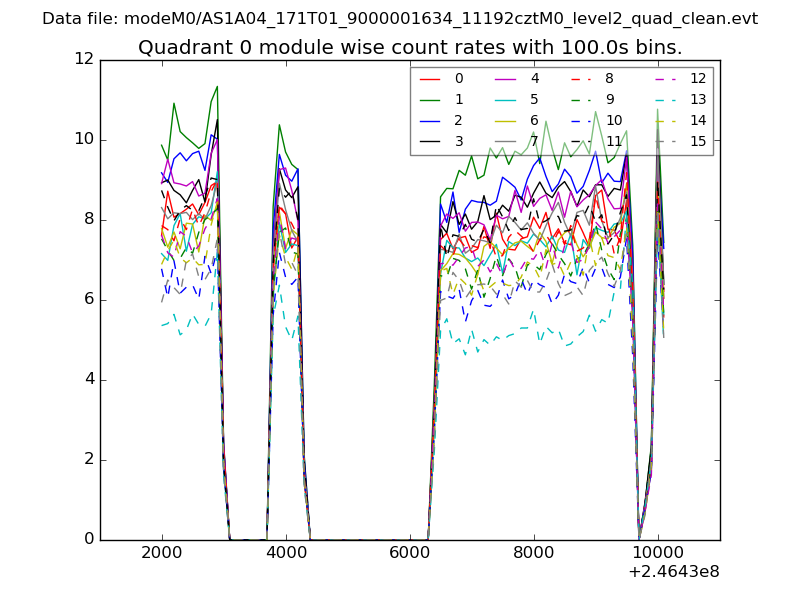 |
 |
| Module-wise count rates for Quadrant B Data is divided into 100 sec bins |
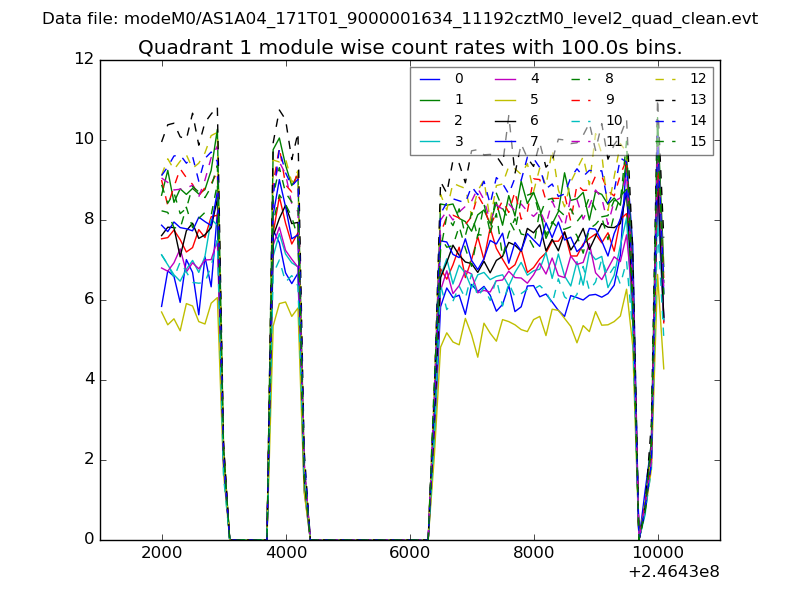 |
 |
| Module-wise count rates for Quadrant C Data is divided into 100 sec bins |
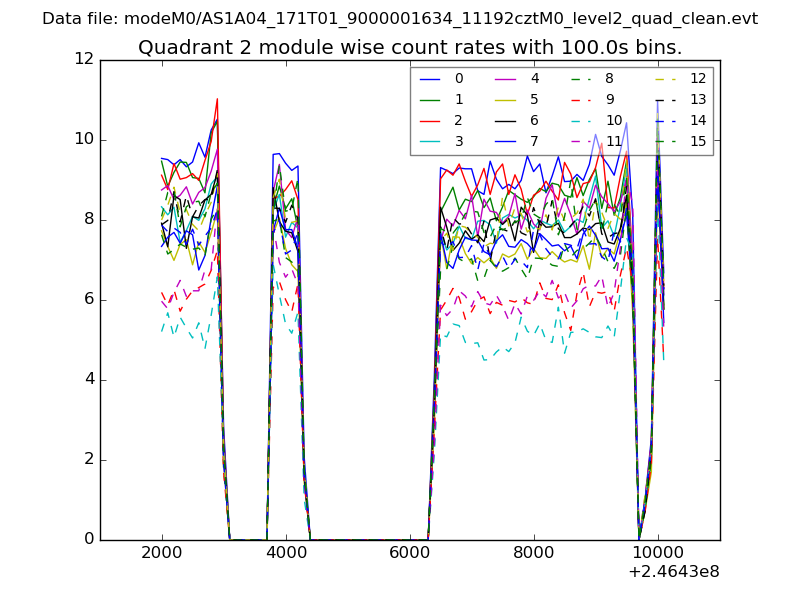 |
 |
| Module-wise count rates for Quadrant D Data is divided into 100 sec bins |
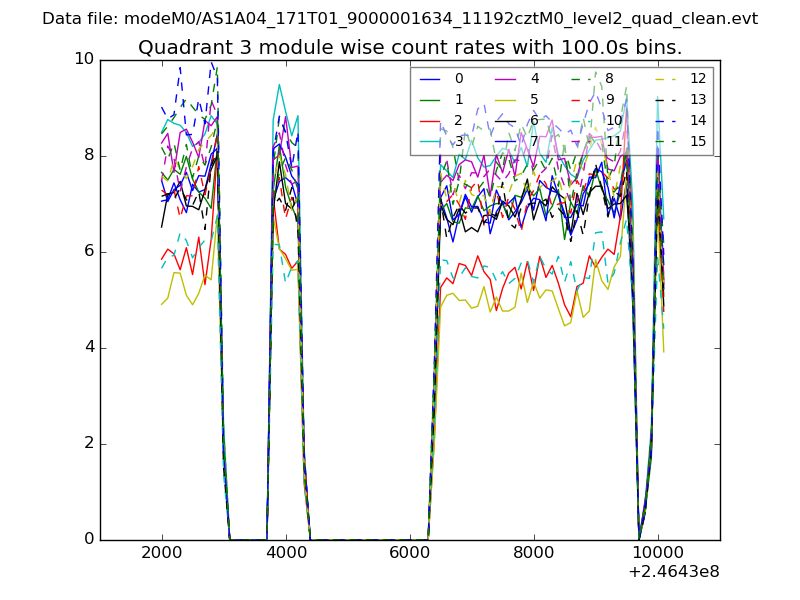 |
 |
| Parameter | Plot |
|---|---|
| CZT HV Monitor | 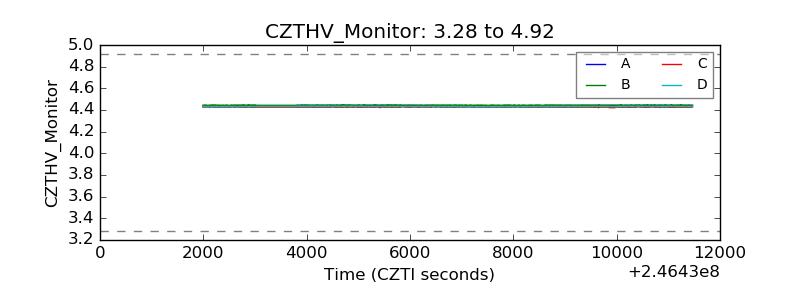 |
| D_VDD | 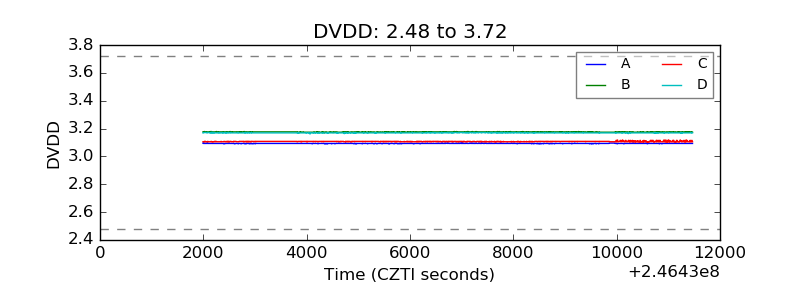 |
| Temperature 1 | 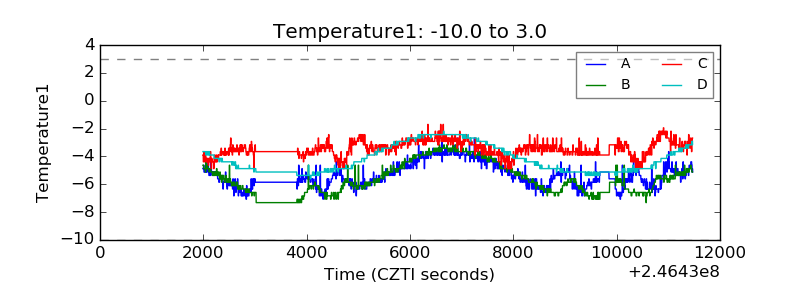 |
| Veto HV Monitor | 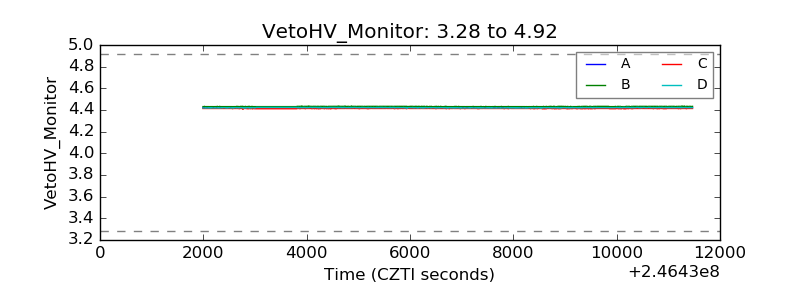 |
| Veto LLD | 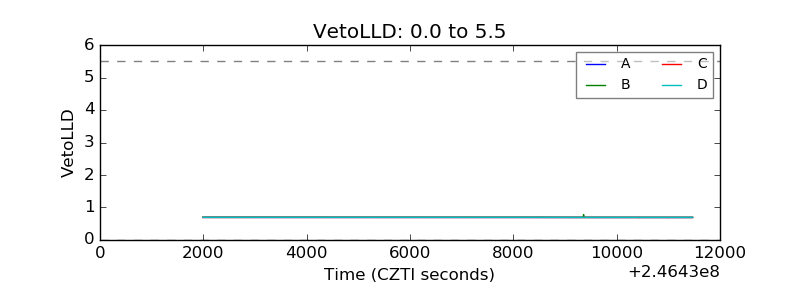 |
| Alpha Counter | 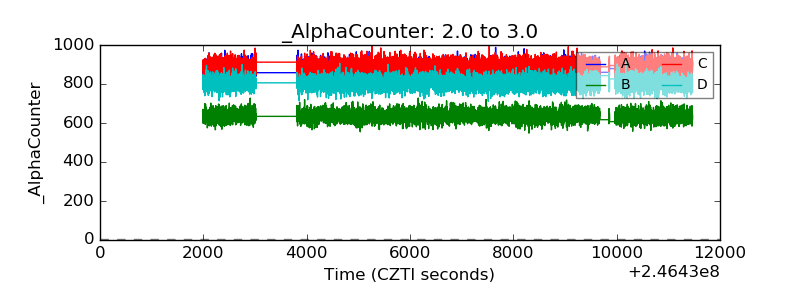 |
| _CPM_Rate | 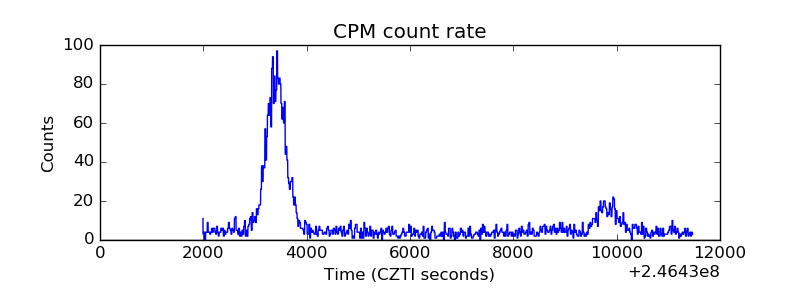 |
| CZT Counter | 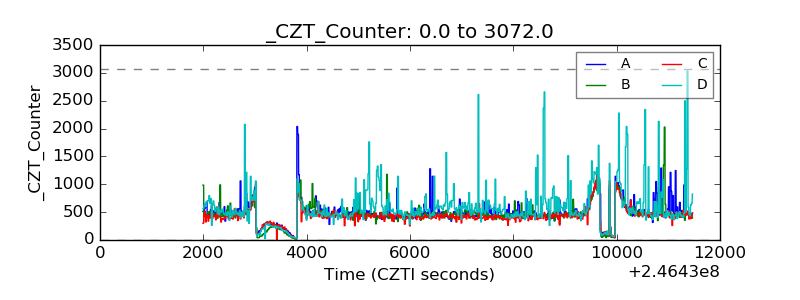 |
| +2.5 Volts monitor |  |
| +5 Volts monitor |  |
| _ROLL_ROT | 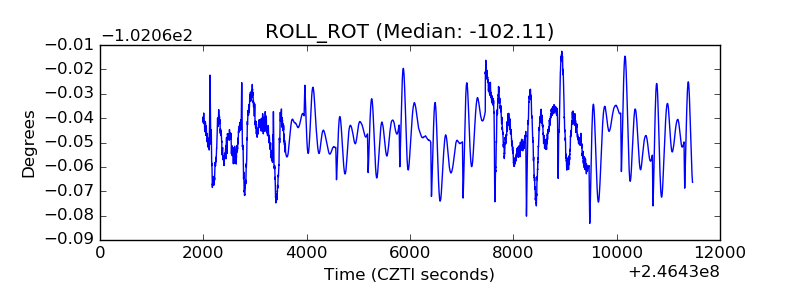 |
| _Roll_DEC | 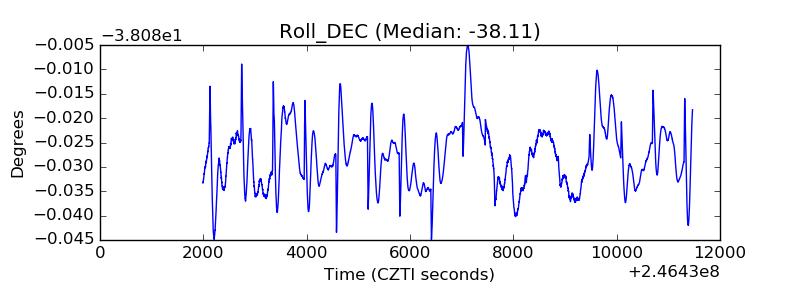 |
| _Roll_RA | 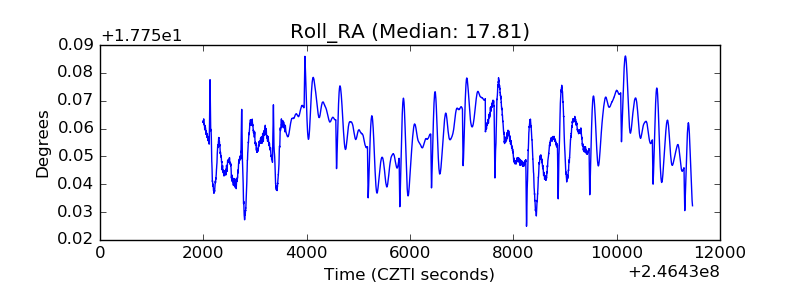 |
| Veto Counter | 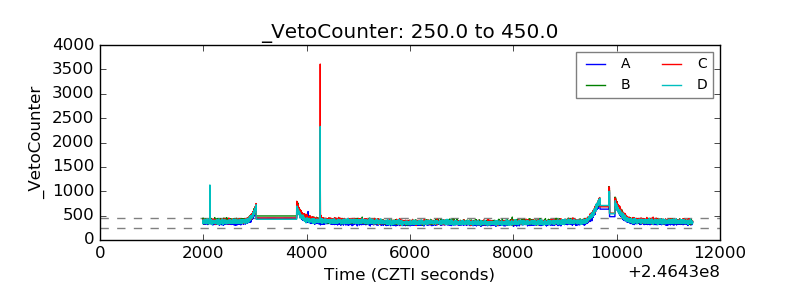 |